The reality, which gold bugs need to accept, is that cyclical inflationary forces are still dominant
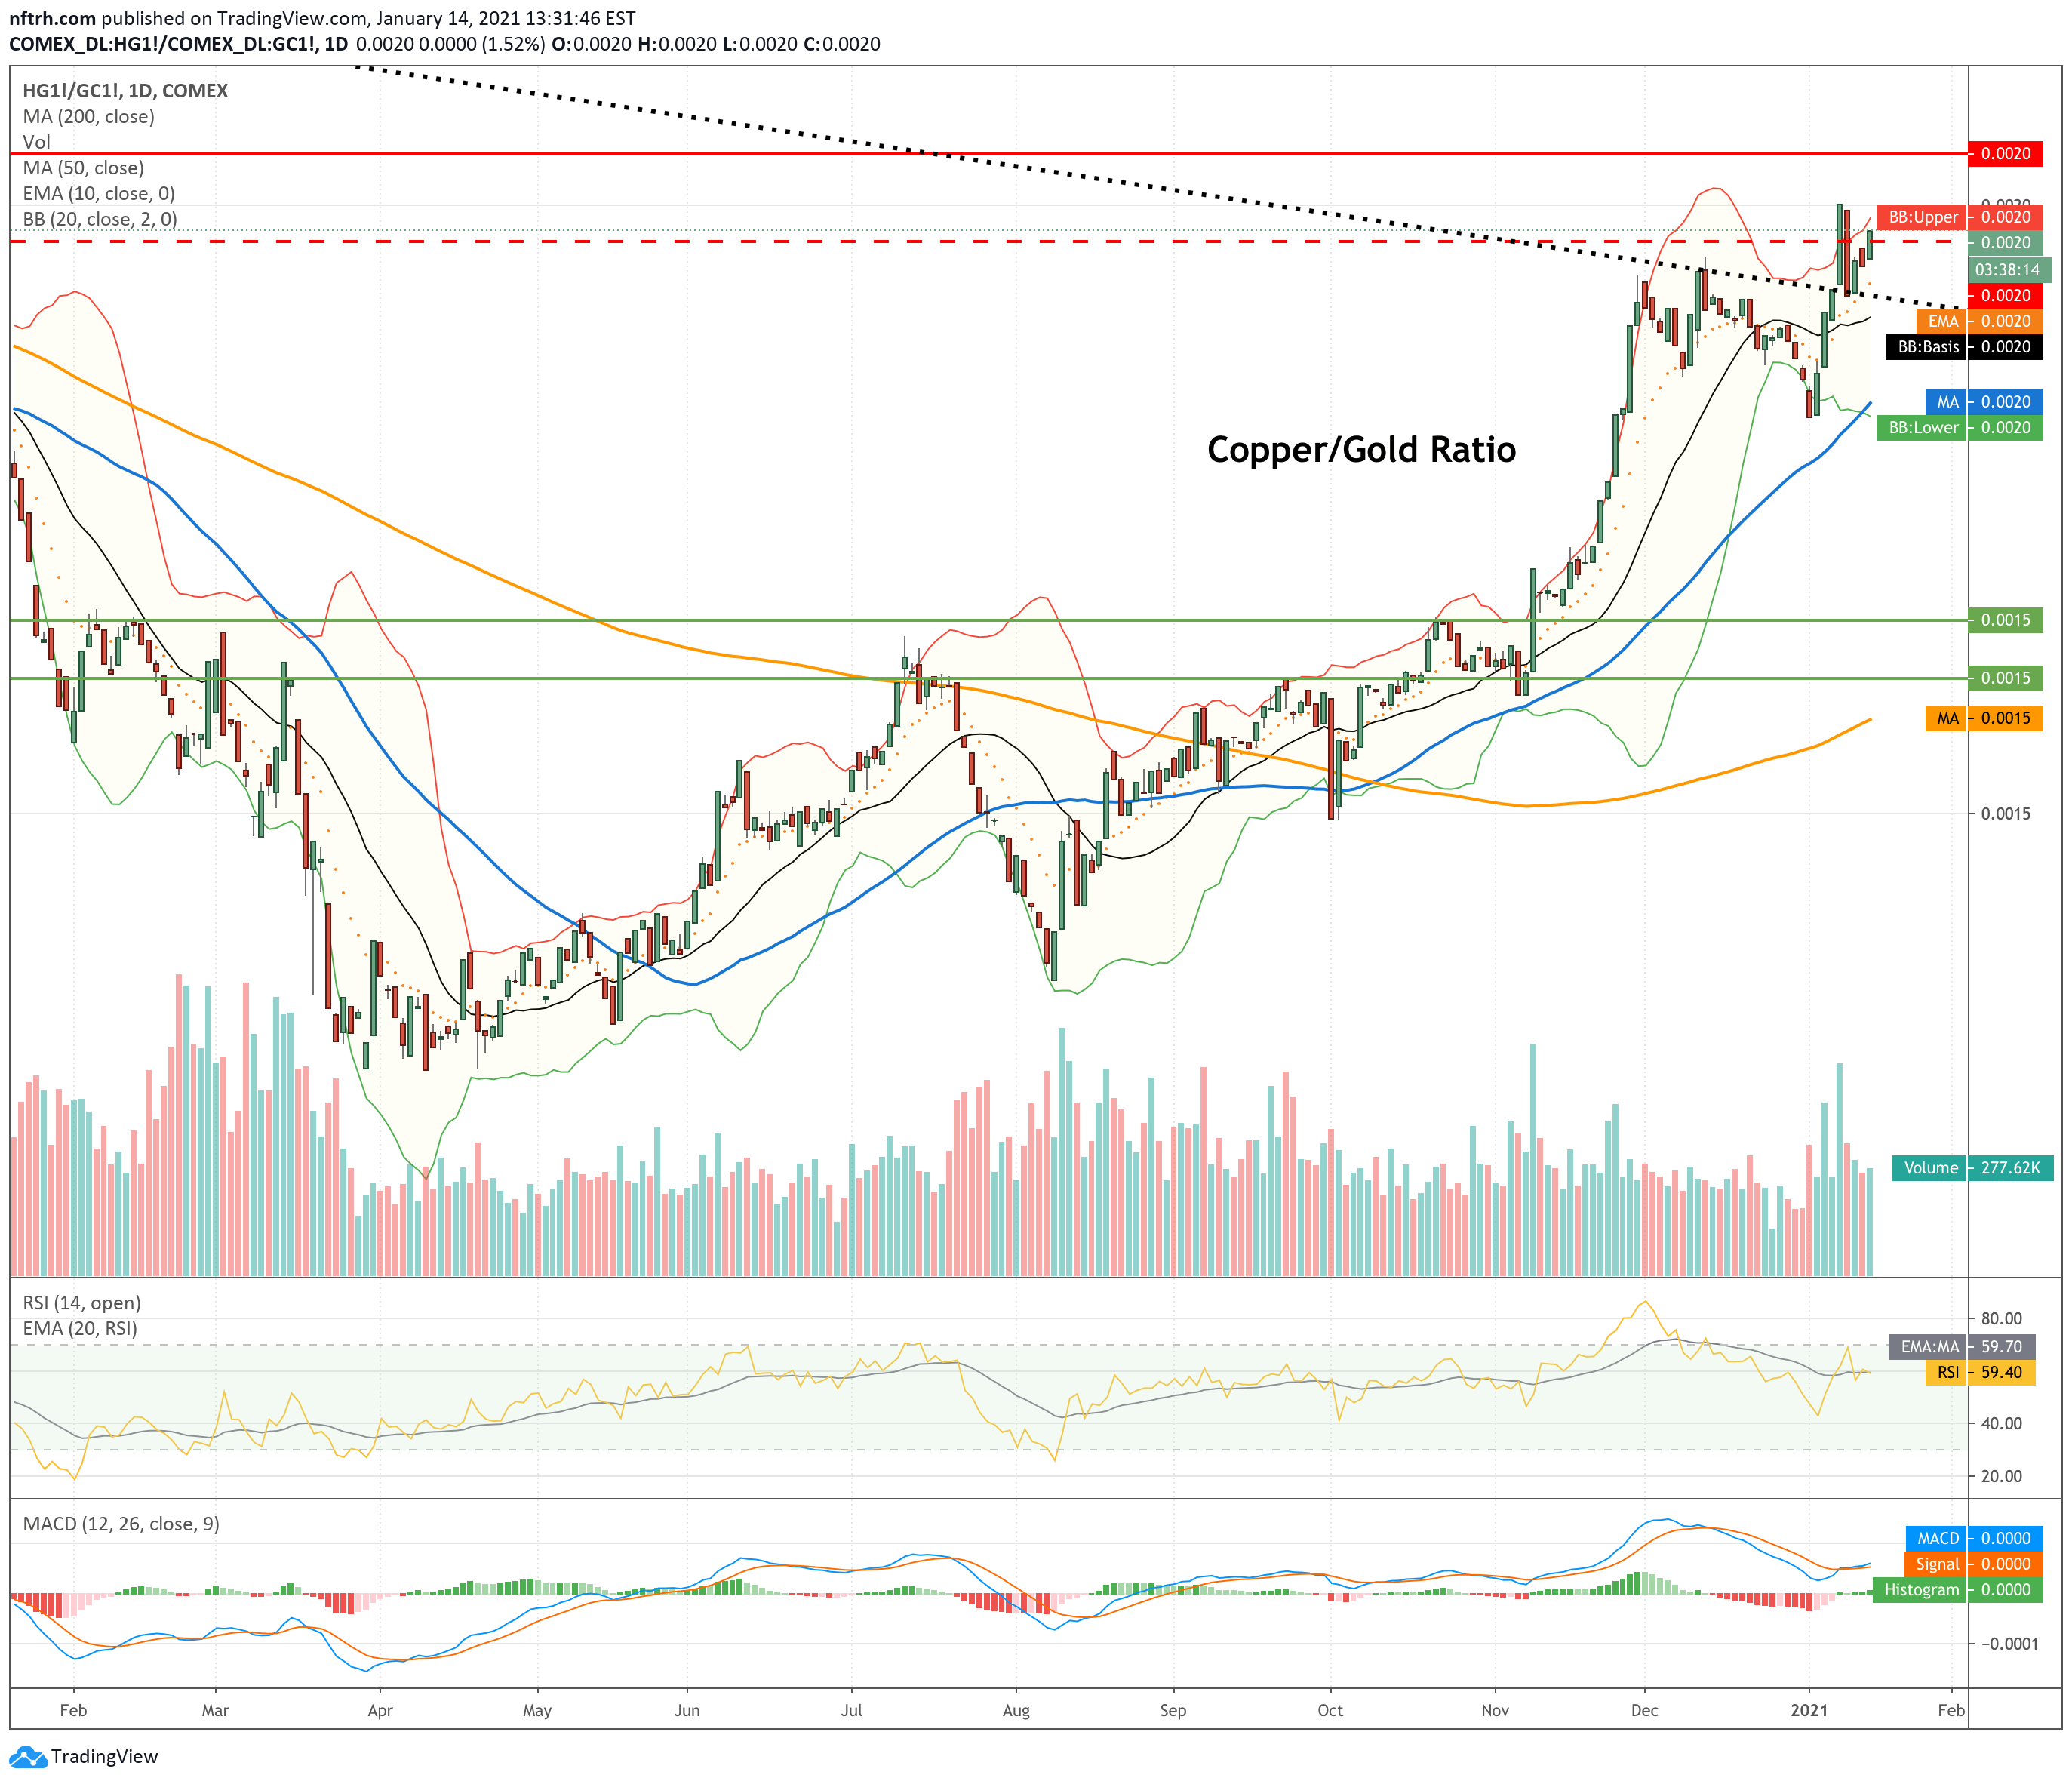
Not many market or economic indicators are clearer in indicating a cyclical vs. counter-cyclical backdrop than the Copper/Gold Ratio. Copper, having pro-cyclical characteristics has been out-performing gold in the post-March inflationary operation by the Fed. MMT TMM (Total Market Manipulation) is alive and well.
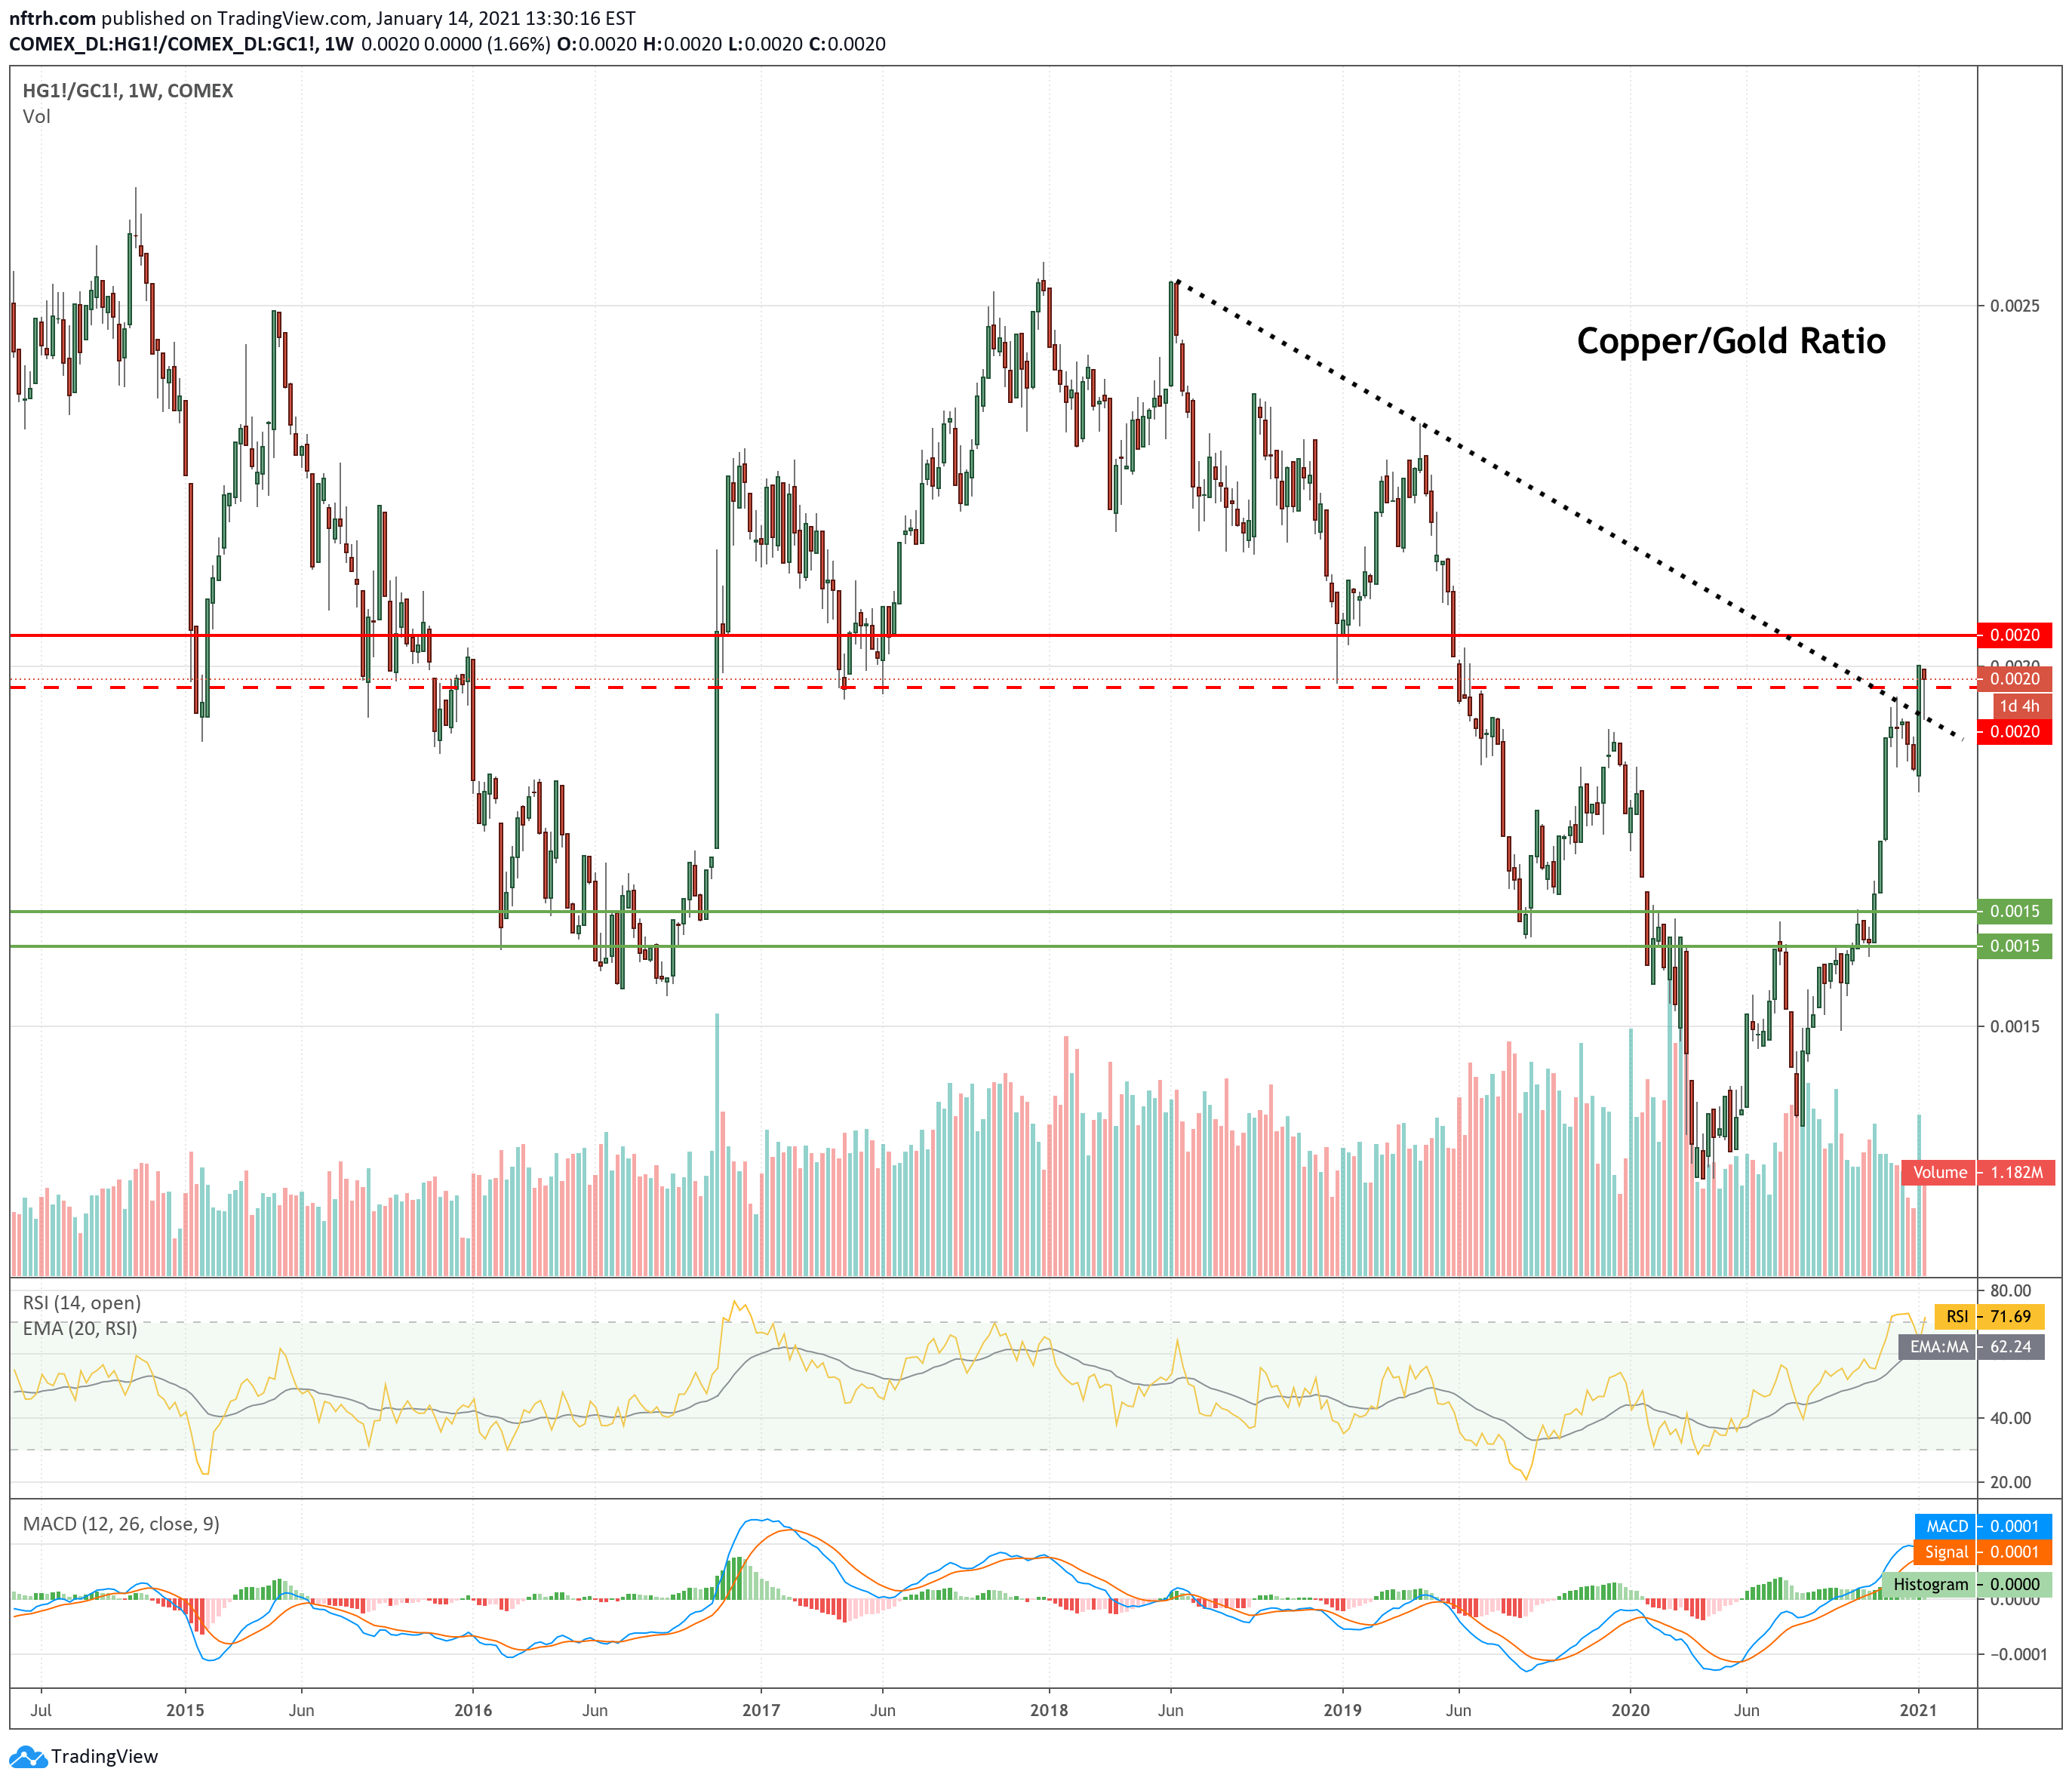
The weekly chart shows the ratio into the meat of a thick resistance zone.
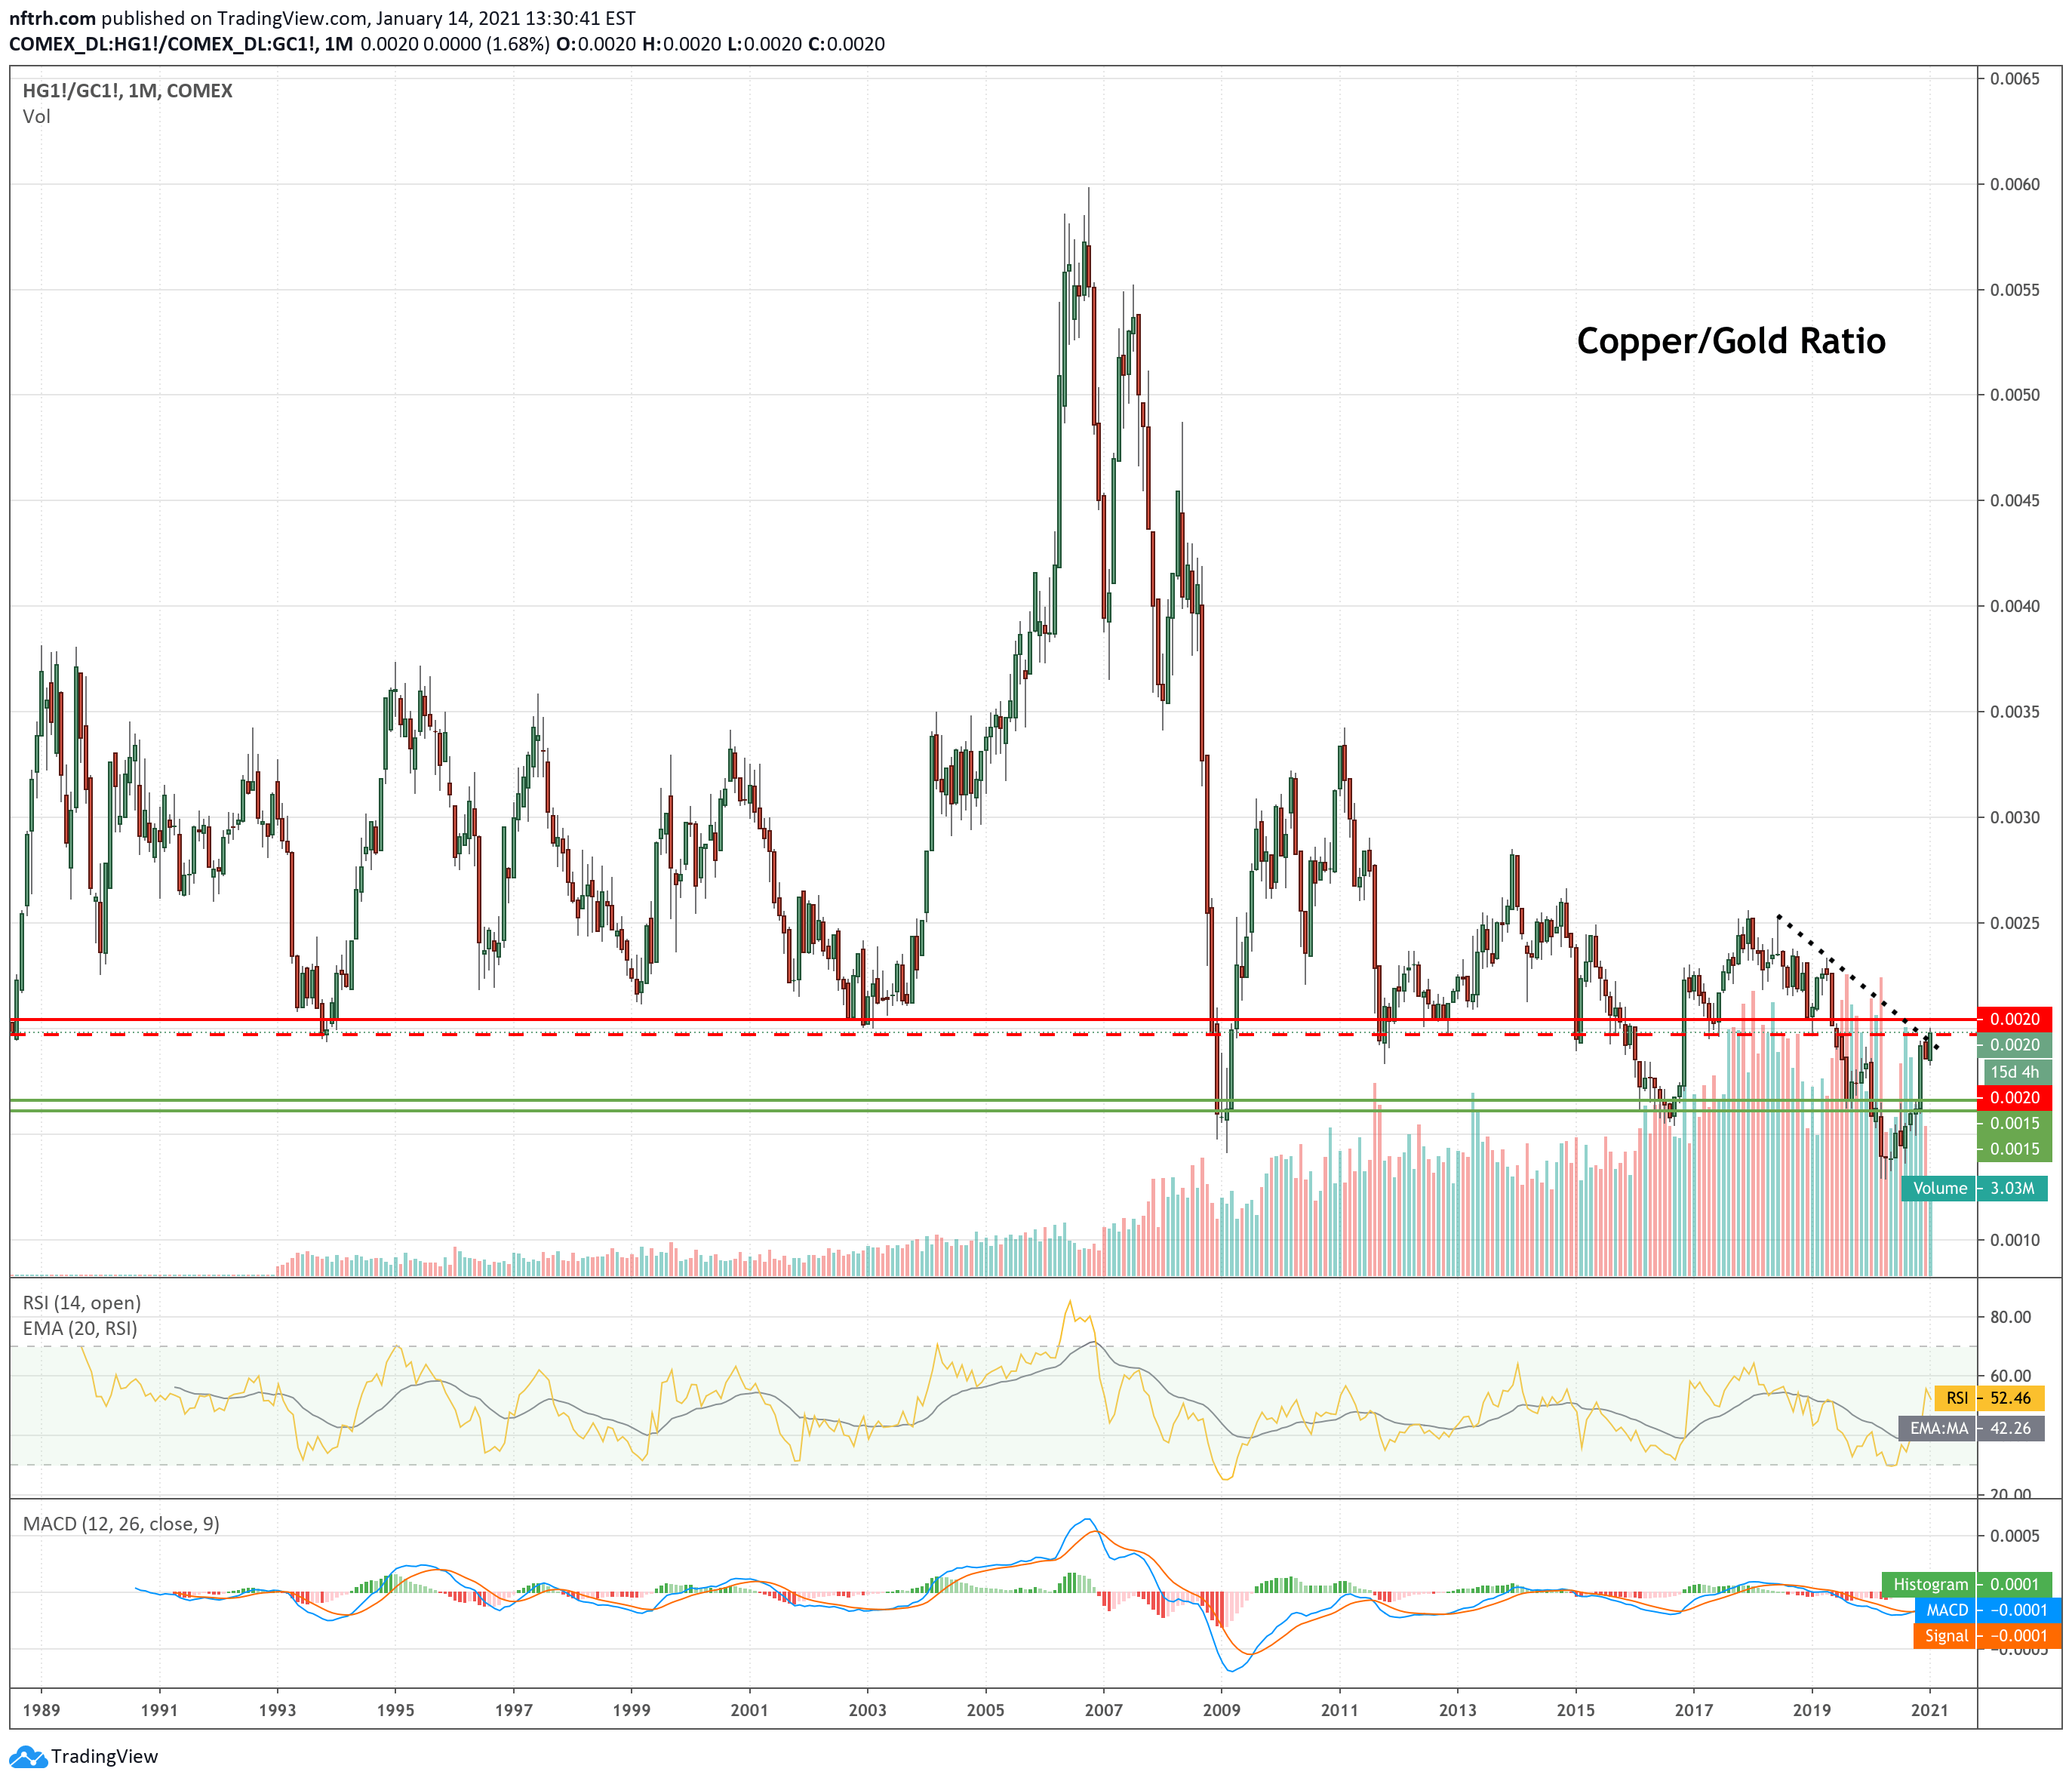
The monthly chart shows just how long-term that resistance zone is. We are at an important juncture and as of now Doctor Copper has the ball and the stodgy old monetary man can’t get it back. It doesn’t mean gold won’t perform well (for ref. check out the 2003-2008 inflation phase), but it does mean that since March gold is nothing special (well it is, long-term, but work with me here…) and since August (when gold stock investors finally got the memo), neither are the miners.
It’s a cyclical inflationary party and your hosts are the Federal Reserve and its world’s ‘reserve’ whipping boy, Uncle Buck.
As with other metrics, risk is high from this vantage point but the trends are in play and they are cycle and inflation positive.
For “best of breed” top down analysis of all major markets, subscribe to NFTRH Premium, which includes an in-depth weekly market report, detailed interim market updates and NFTRH+ dynamic updates and chart/trade setup ideas. You can also keep up to date with actionable public content at NFTRH.com by using the email form on the right sidebar. Follow via Twitter @NFTRHgt.