
Musk and the bond market are in a convenient alignment, but the bond market situation has been in progress since 2023
Our (NFTRH) view has been for falling inflation signals (check), a slowly decelerating economy despite Biden/Yellen/Powell best efforts to keep it inflated (check), and a future problem when disinflation and an easing economy slide into a deflation/liquidity scare and an obviously weakening economy. We have held this big picture macro view since 2023.
This snippet on Musk and the bond market was sent to me by a subscriber, and though I have a very uneven market week (going under the knife for the first time), this just needed to be addressed.
Trump measure of success is no longer a rising S&P 500, it is now a falling 10-year yield.
Musk got the message loud and clear. The bond market was doubting him, demanding more evidence that the cuts were adding up fast enough to actually rein in the bloated budget deficit and curb the ever-growing national debt. This, Musk insisted, was a mistake they’d come to regret.
“The bond markets do not currently reflect the savings that I’m confident we can achieve,” he said during a freewheeling, hour-long discussion he led on his social media platform, X. “If you’re shorting bonds, I think you’re on the wrong side of the bet.”
Trump has famously obsessed with the stock market as a real-time referendum on his presidency. But now, with Musk and Treasury Secretary Scott Bessent in his ear at the start of his second term, much of the attention has shifted to another benchmark — the 10-year Treasury bond yield.
With good reason. As powerful as the Federal Reserve is, with its control of short-term rates, and as much sway as it has on stock market sentiment, it’s the 10-year Treasury rate that largely determines the cost of money for homebuyers and the biggest US companies. Bring that rate down and it’ll pave the way for millions of Americans to buy the house they’ve wanted for years and, in the process, stoke faster economic growth and curb the alarming surge in the government’s annual interest tab.
-Bloomberg
No Elon, the bond market does not reflect those savings. Not yet, in my opinion. You are correct about the direction of Treasury bonds, but not correct as to the current reason. Part of our plan is for the longer-term “build back” phase, to be long asset markets and the economy after the cleaning (assuming Musk and his DOGE attack doggie have a “build back” plan).
But the view of declining Treasury yields (rising bonds) has been in play all along (I have been long my share of short-term Treasury bonds since 2023).
Says me? No.
Says the 2yr Treasury yield’s historical relationship with the Fed Funds rate and the stock market. The 2yr Treasury yield has been negatively diverging the T-bill yield and the Fed since early 2023. That was nearly two years before Musk was even a twinkle in the bond market’s eye.
If our view is correct then the bond market will do Trump/Musk’s job for them, to the tune of an interim deflationary liquidation of the macro. If I am wrong, various indicators will tell me so and I/NFTRH will adjust. But as yet there is no proof that the ongoing analysis is wrong.
Politicians (and Trump and now Musk are ultimately that) will of course tout current policy as the reason for a perceived positive outcome; at least initially. But before any “build back”, I expect something along the lines of 2000 and 2007 to play out. It’s been my wider view playbook since 2023 and I don’t see Musk’s assertion as much more than self-aggrandizing noise.

Says me? No.
Say the 10yr-2yr and 10yr-3mo Yield Curves and their historical relationships to the stock market (and economy). A steepening yield curve generally runs with an economic bust.
This is a primary lesson about why the mainstream media can and often will lead you astray. They touted a coming recession in 2023 because yield curves were inverted and then called the “all clear” on the economy when they un-inverted in 2024. Ha ha ha… it’s the post-inversion steepening that brings the pain, as this chart implies.
We are on a curve steepener and that steepening is increasingly coming with a deflationary engine (yield curves can steepen under inflationary or deflationary pressure), as nominal yields weaken, but long-term yields remain elevated relative to short-term yields.

A shorter view of the 10yr-2yr Yield Curve is still in in a consolidation flag, but also still well on an un-inverted steepening trend. One possible implication is that the bond market is playing nice to Musk’s assertion. But also that when the next upward steepening leg takes hold there could be some unpleasant economic “discovery” in the bond market.
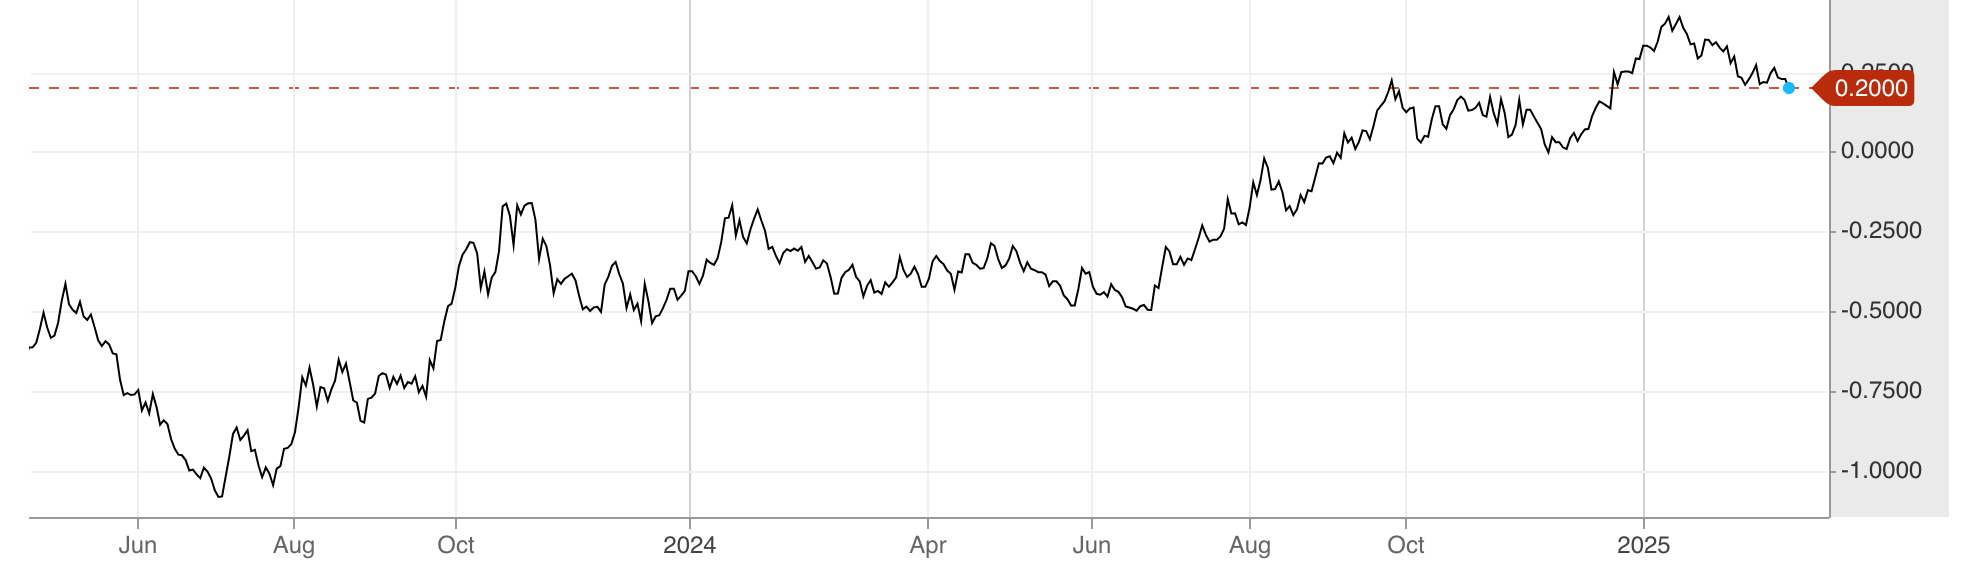
DOGE Dog gone it, why not insert a segment from NFTRH 850 on the bond market? Okay, here it is. It’s a snapshot of the Treasury market from the standpoint of commercial hedgers’ positioning…
A Closer Look at the US Treasury Bond Market
Here is an interesting situation regarding commercial hedgers, which would theoretically be positioned bullish at/near lows and bearish at/near highs. As we move along the duration curve, from short to long, we see a progression where the longer the duration, the worse the prospects for the bonds in question, on a contrarian basis.
If that plays out logically, it also implies that our steepening yield curve view is right on, as commercial players are also expecting short-term bonds to perform better than long-term bonds (another way of saying long-term yields will decline less than short-term yields, or rise relative to short-term yields, which itself is a way of saying “steepening yield curves”). Let’s view the bonds from short to long-term.
The 2yr Note is at an apparent price low with commercial hedgers briskly net long.

The 5yr Note is a-okay, maybe even asking me to expand my positive bond view from 0 to 3 years up to 5, for a little extra income. All theoretical, folks. But it’s informative.

The 10yr degrades a bit but is still biased contrary bullish.

It is way out on the curve, in the 30yr that things get flat out bad. That is just a terrible alignment, contrary-wise.

The message appears to be that we are and have been right to be long some short-term bonds, favoring them over long-term bonds, and also right in first anticipating and now managing steepening yield curves.
Extrapolating further, I expect steepening curves, which tend to come with counter-cycles and economic busts, to prove out as well. Hence gold stocks, the counter-cyclical sector. See how it all plays together?
[edit] Lest anyone sees the above as a gold stock tout, we have anticipated an overbought pullback/correction scenario beginning over two weeks ago, beginning with the sector video presented publicly on February 10. But the bond market is playing to the proper macro fundamentals for gold stocks on a bigger picture.
I love this stuff. Some people like Super Bowl parties and betting squares. Some people like March Madness. Some people like bowling. I like nerding out on macro indications.
For “best of breed” top down analysis of all major markets, subscribe to NFTRH Premium, which includes an in-depth weekly market report, detailed market updates and NFTRH+ dynamic updates and chart/trade setup ideas. You can easily subscribe by Credit Card or PayPal (see all info and options).
Keep up to date with actionable public content at NFTRH.com by using the email form on the right sidebar, or take it to another (intermediate) level with our free eLetter. Follow via X @NFTRHgt. Also, a new tier of service is coming soon, as NFTRH++ will offer technical trading signals. More info on NFTRH++ here.
