30-year yield threatens to rise anew
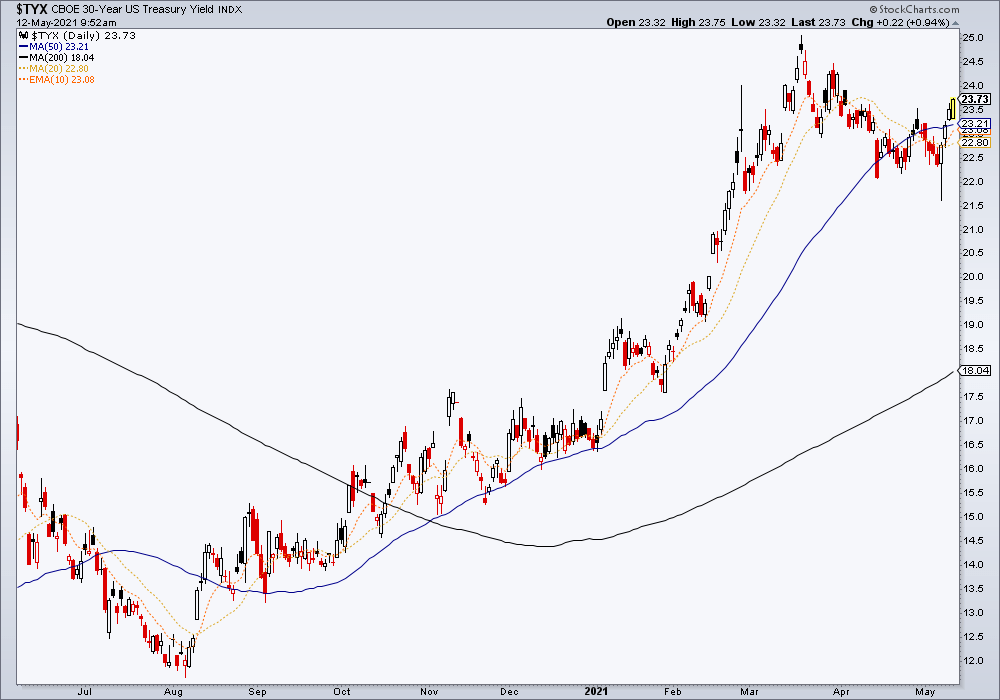
Here is the daily chart of the 30yr yield. Looks like a flag breaking out to me.
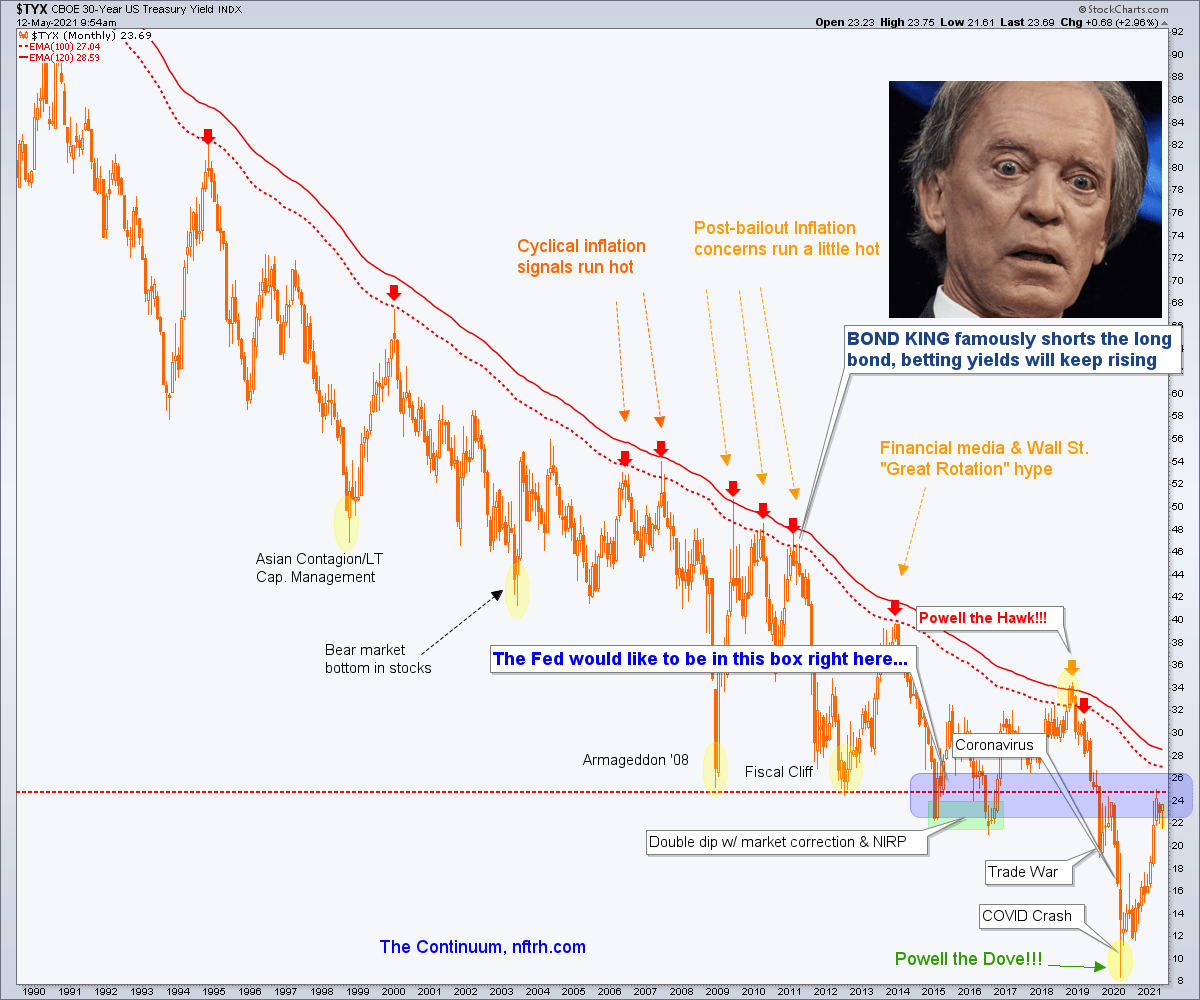
By converting the above to a monthly view, we have our trusty Continuum chart. If this little hesitation (if you will) in yields and associated stock market pullback play out to the extent that the Continuum allows, there will be another thrust upward in inflationary concerns, if not the economy and asset markets (although those two would more likely than not be firm pending the EMA 100 & 120 red-lined limiters).
It was a good bet that the yield was going to pause at this area, and we anticipated that fully in NFTRH. Now I wonder if the thing is making a right side inverted shoulder in preparation for a push to or through the limiters. One thing’s for sure; the balance of 2021 is going to be interesting.
For “best of breed” top down analysis of all major markets, subscribe to NFTRH Premium, which includes an in-depth weekly market report, detailed interim market updates and NFTRH+ dynamic updates and chart/trade setup ideas. You can also keep up to date with actionable public content at NFTRH.com by using the email form on the right sidebar. Follow via Twitter @NFTRHgt.