TSX-V/TSX ratio continues to negatively diverge the reflation trades
Back on June 21 we compared inflation expectations with the fading CDNX/TSX Ratio using this chart (updated here). Nearly 3 months later, while inflation expectations look poised to turn back up TSX-V/TSX continues to robo-trend down.
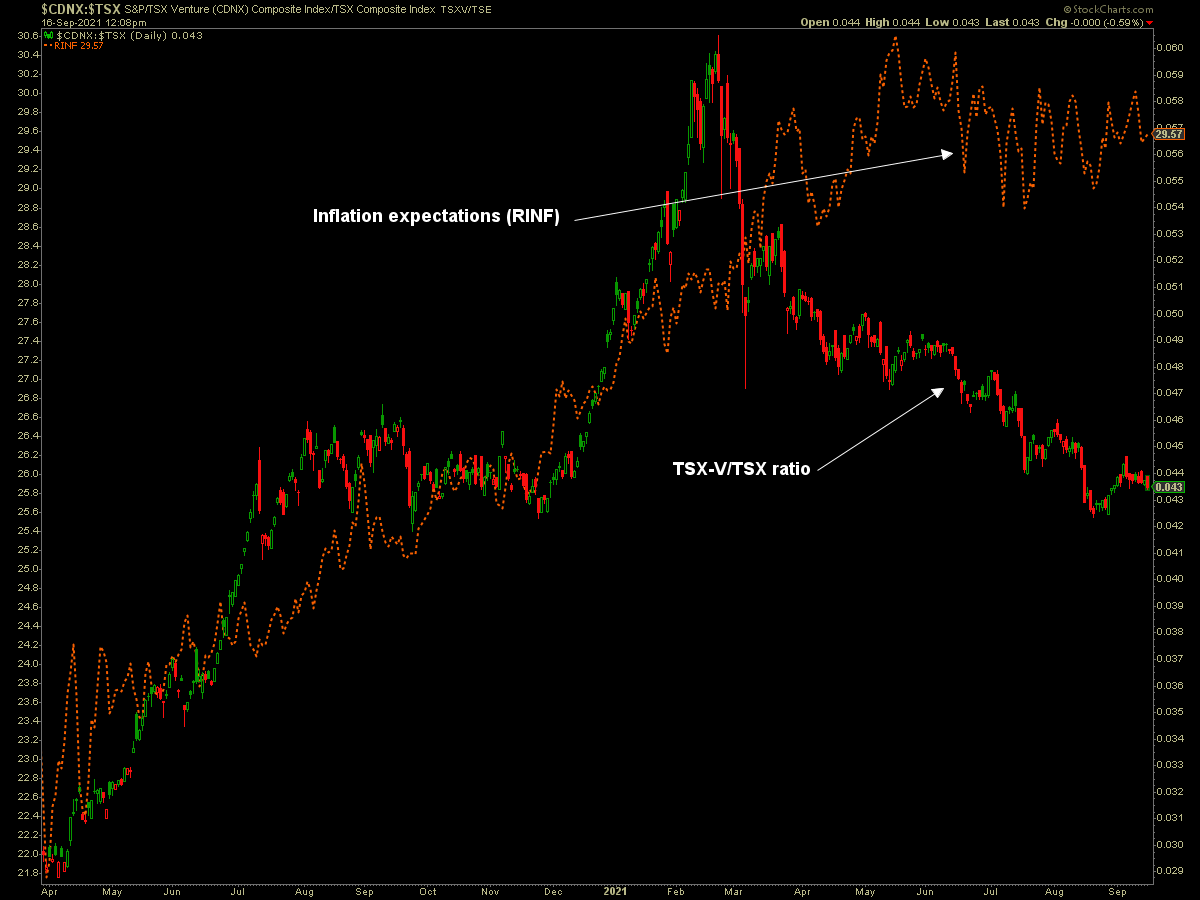
Da ‘V’ is not an indicator in a vacuum, but its relationship to the senior Canadian TSX index has been in correlation with inflation and speculative inflation trades over the years. It peaked and turned down in February leading the summer cool down in inflation expectations and many inflation/reflation trades, and a flattening in the broad commodity indexes/ETFs, as oil and gas kept them aloft.
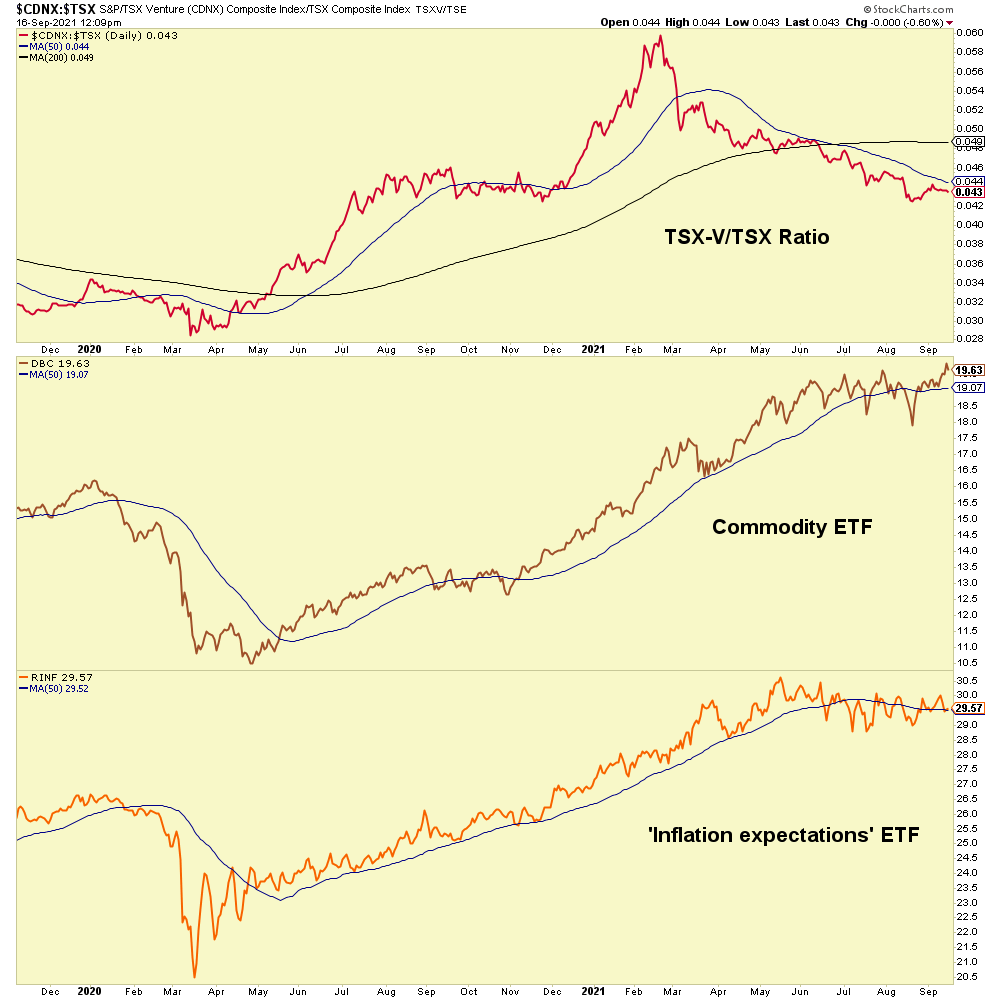
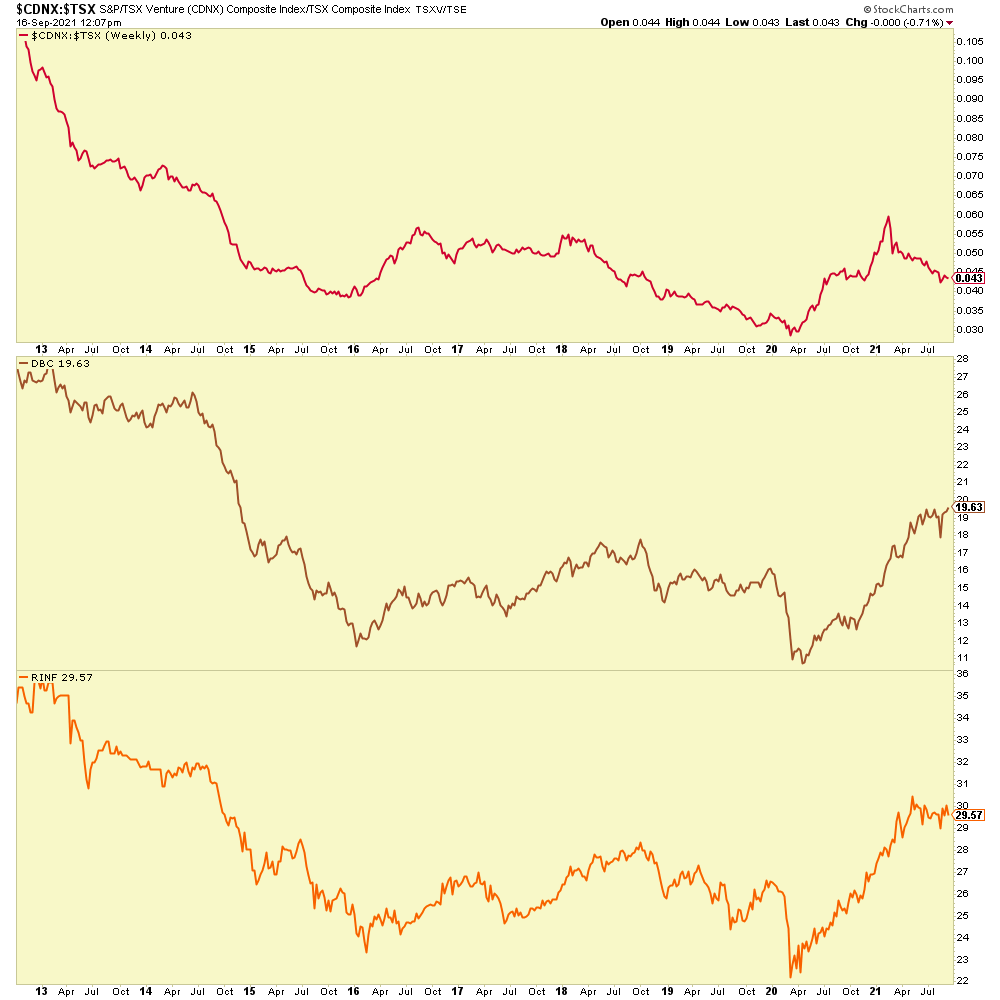
But at some point da ‘V’ should either begin to out-perform the TSX or the other stuff should fold up its tent for a while and drop. The weekly view shows the longer-term correlation between the ratio and commodities and inflation expectations. I’d watch the ratio to either confirm the others by breaking the handle upward or hopefully, if you want want to buy the next round of inflation at a discount, deny them.
For “best of breed” top down analysis of all major markets, subscribe to NFTRH Premium, which includes an in-depth weekly market report, detailed market updates and NFTRH+ dynamic updates and chart/trade setup ideas. Subscribe by PayPal or credit card using a button on the right sidebar (if using a mobile device you may need to scroll down). Keep up to date with actionable public content at NFTRH.com by using the email form on the right sidebar. Follow via Twitter @NFTRHgt.