Sometimes I look at individual stocks and ask myself something like this, using Intel as the current example: ‘how, if the market is going to go bearish [in Q4] can Intel be targeting 40 (and 44, on a longer-term chart)?’
The answer is of course that ‘there are no absolutes sir, so your Q4 market projections could be wrong’. These are the financial markets with millions of stimuli that we attempt to quantify into best guesses otherwise known as probabilities. But another answer is that in hindsight, Intel had plenty of time to reach its targets within the projected time frame. This is after all a speculative frenzy and it’s not the only thing going vertical.
Given the SOX breakout and the NDX threat to break out, maybe it’s a non-issue now. Intel has after all, in essence come to the daily chart’s pattern target of 40, which the SOX break to new highs (although it is conspicuously a rare index that is NOT at all-time highs) has obviously supported.

The question I have personally, is whether to sell this unremarkable old fashioned technology company or not. The chart says 44 after all, and SOX is at new highs and NDX is in an Ascending Triangle. So I am inclined to keep INTC (and add other tech items with prospective charts that could play catch up into the blow off; and they are out there) while the market view remains bullish, which it is and has been. That’s a thing called the trend.

Dialing out to the big view, this chart of Intel and SOX illustrates why I feel like a river boat gambler with the markets. It is obvious that we have a speculative atmosphere going on and it is my job to call it what it is but also manage it as best as possible, personally. One valid ending scenario – regardless of whether it occurs in 2017 or 2018 – is after all, the upside blow off scenario. 750 and a ‘best’ target of 930 are left on the SOX chart for their humor value.

SOX still has a 150 points or so before it does what NDX did nearly a year ago; hit all-time highs. In this context Intel’s 44 would look like a shoe-in.

I guess the bottom line of this exercise is that we are all casino patrons now (those of us participating, anyway). I believe Treasury bonds will be seen as not only not a safe haven, but even dangerous in the coming months and what have T bonds traditionally been to conventional casino patrons? Beuller? They have been seen as “the alternative” to stocks in risky times. If they go bearish – and that’s obviously still an ‘if’, then where are people going to go? We can talk about gold and risk ‘off’ (and we will), but I think the thing that is motion first and foremost would need to finish blowing off first; and what is in motion is the stock market.
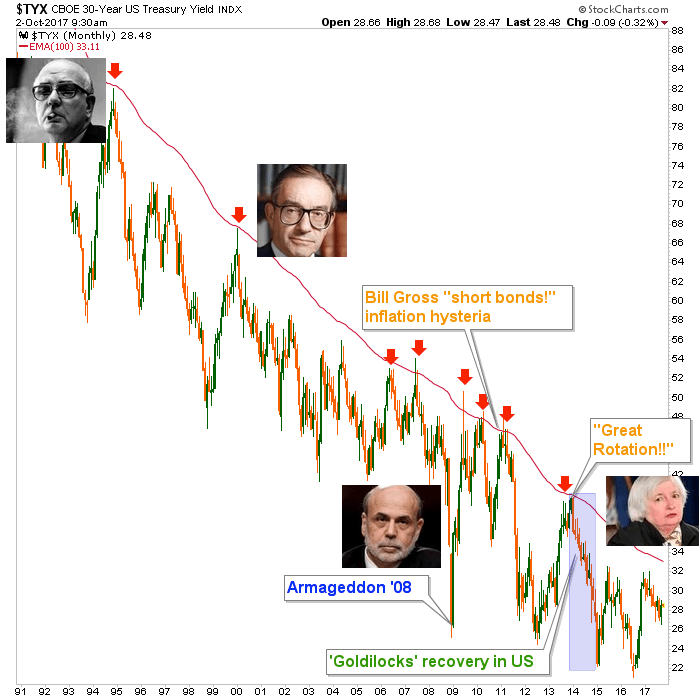
Just because I want to find all sorts of excuses to include this hilarious cartoon I want you to look at the Continuum below and ponder with me what could be if the macro backbone breaks and the 100 month EMA is exceeded one day in Treasury yields (it’s an unfocused post, I realize; but sometimes they go that way) and a secular bond bear were to begin.
Something is in motion in the financial markets and it’s a good bet that the long-term Treasury bond market, at the dawn of the Fed’s QT, will be at the center of it.
Subscribe to NFTRH Premium for your 40-55 page weekly report, interim updates and NFTRH+ chart and trade ideas or the free eLetter for an introduction to our work. Or simply keep up to date with plenty of public content at NFTRH.com and Biiwii.com. Also, you can follow via Twitter @BiiwiiNFTRH, StockTwits, RSS or sign up to receive posts directly by email (right sidebar).