With all due caveats about seasonal averages (these cover 30 years) and the variations from them in any given year, below are the facts of what these commodities have done, on average over those years.
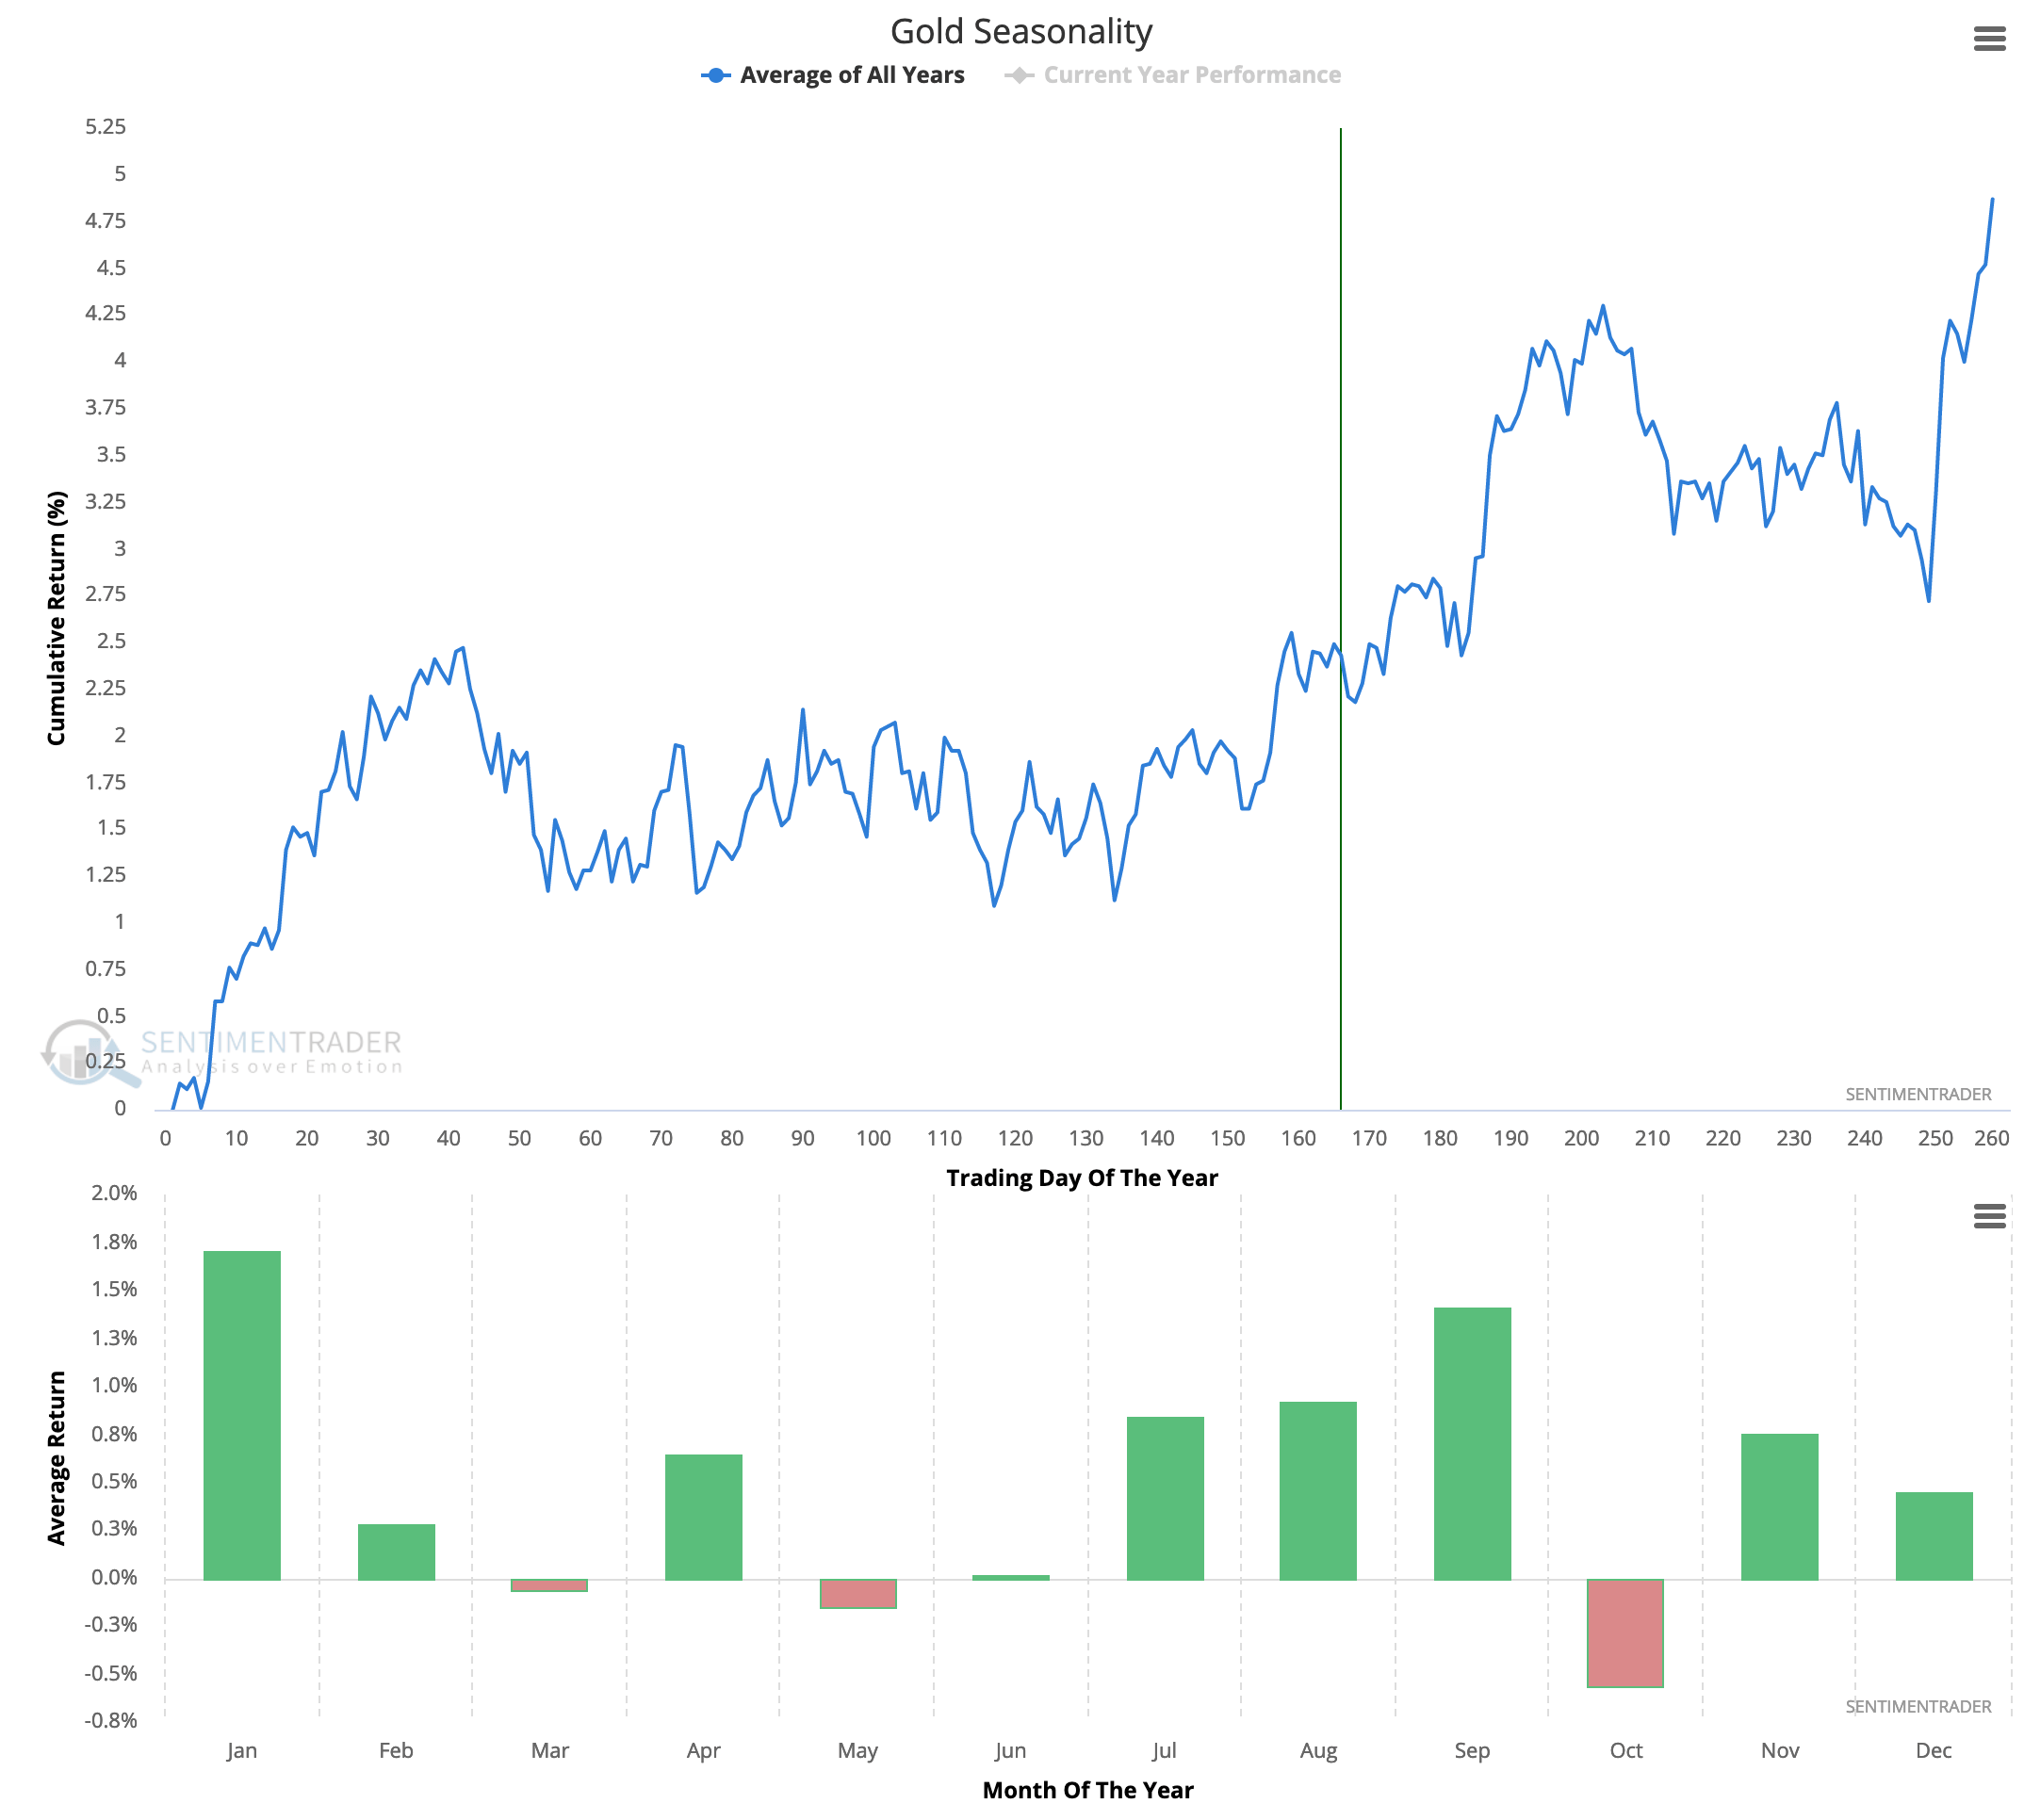
Gold’s current bounce is matching a sweet spot on the average, where an interim top comes in October and a secondary low in December before a hard bottom and upturn. If nothing else, this keeps my open minded attitude open. Gold still has downtrending short-term technicals as it bounces but also a technically bullish big picture (Cup & Handle).
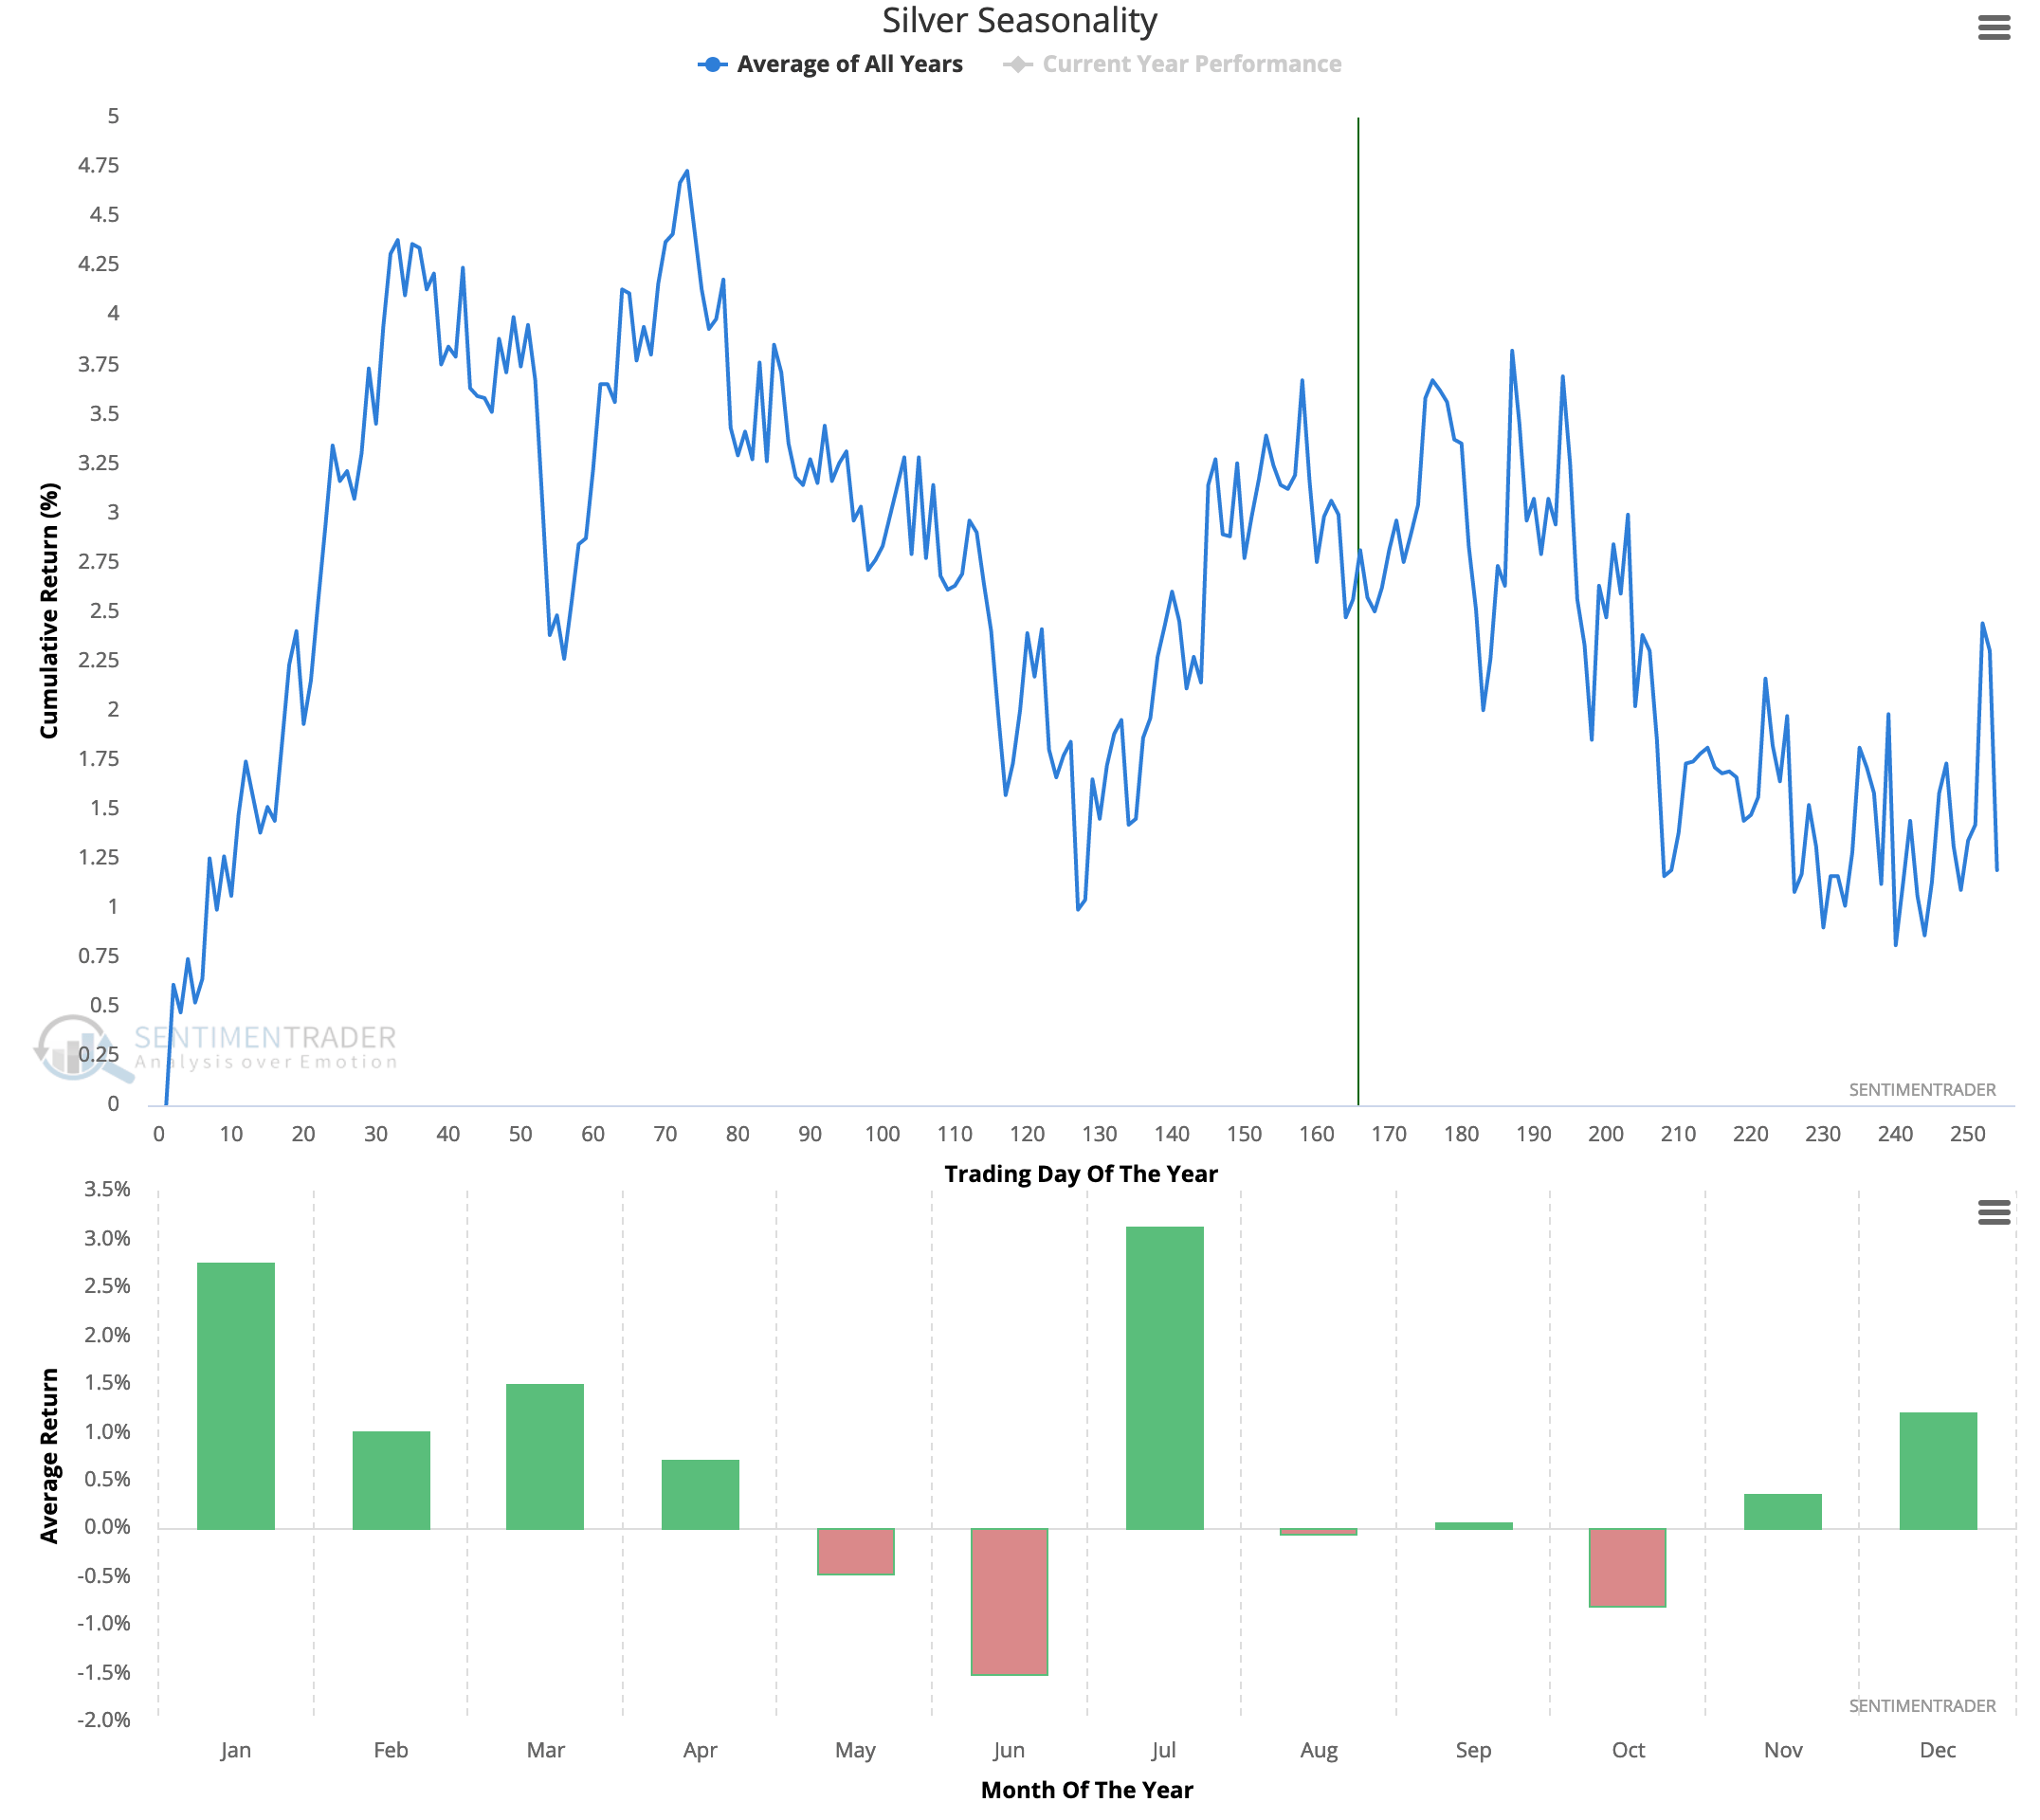
Silver is on a bounce (such as it is, having only begun yesterday) that would also top in September or October before declining the rest of the year prior to a big rally in January.
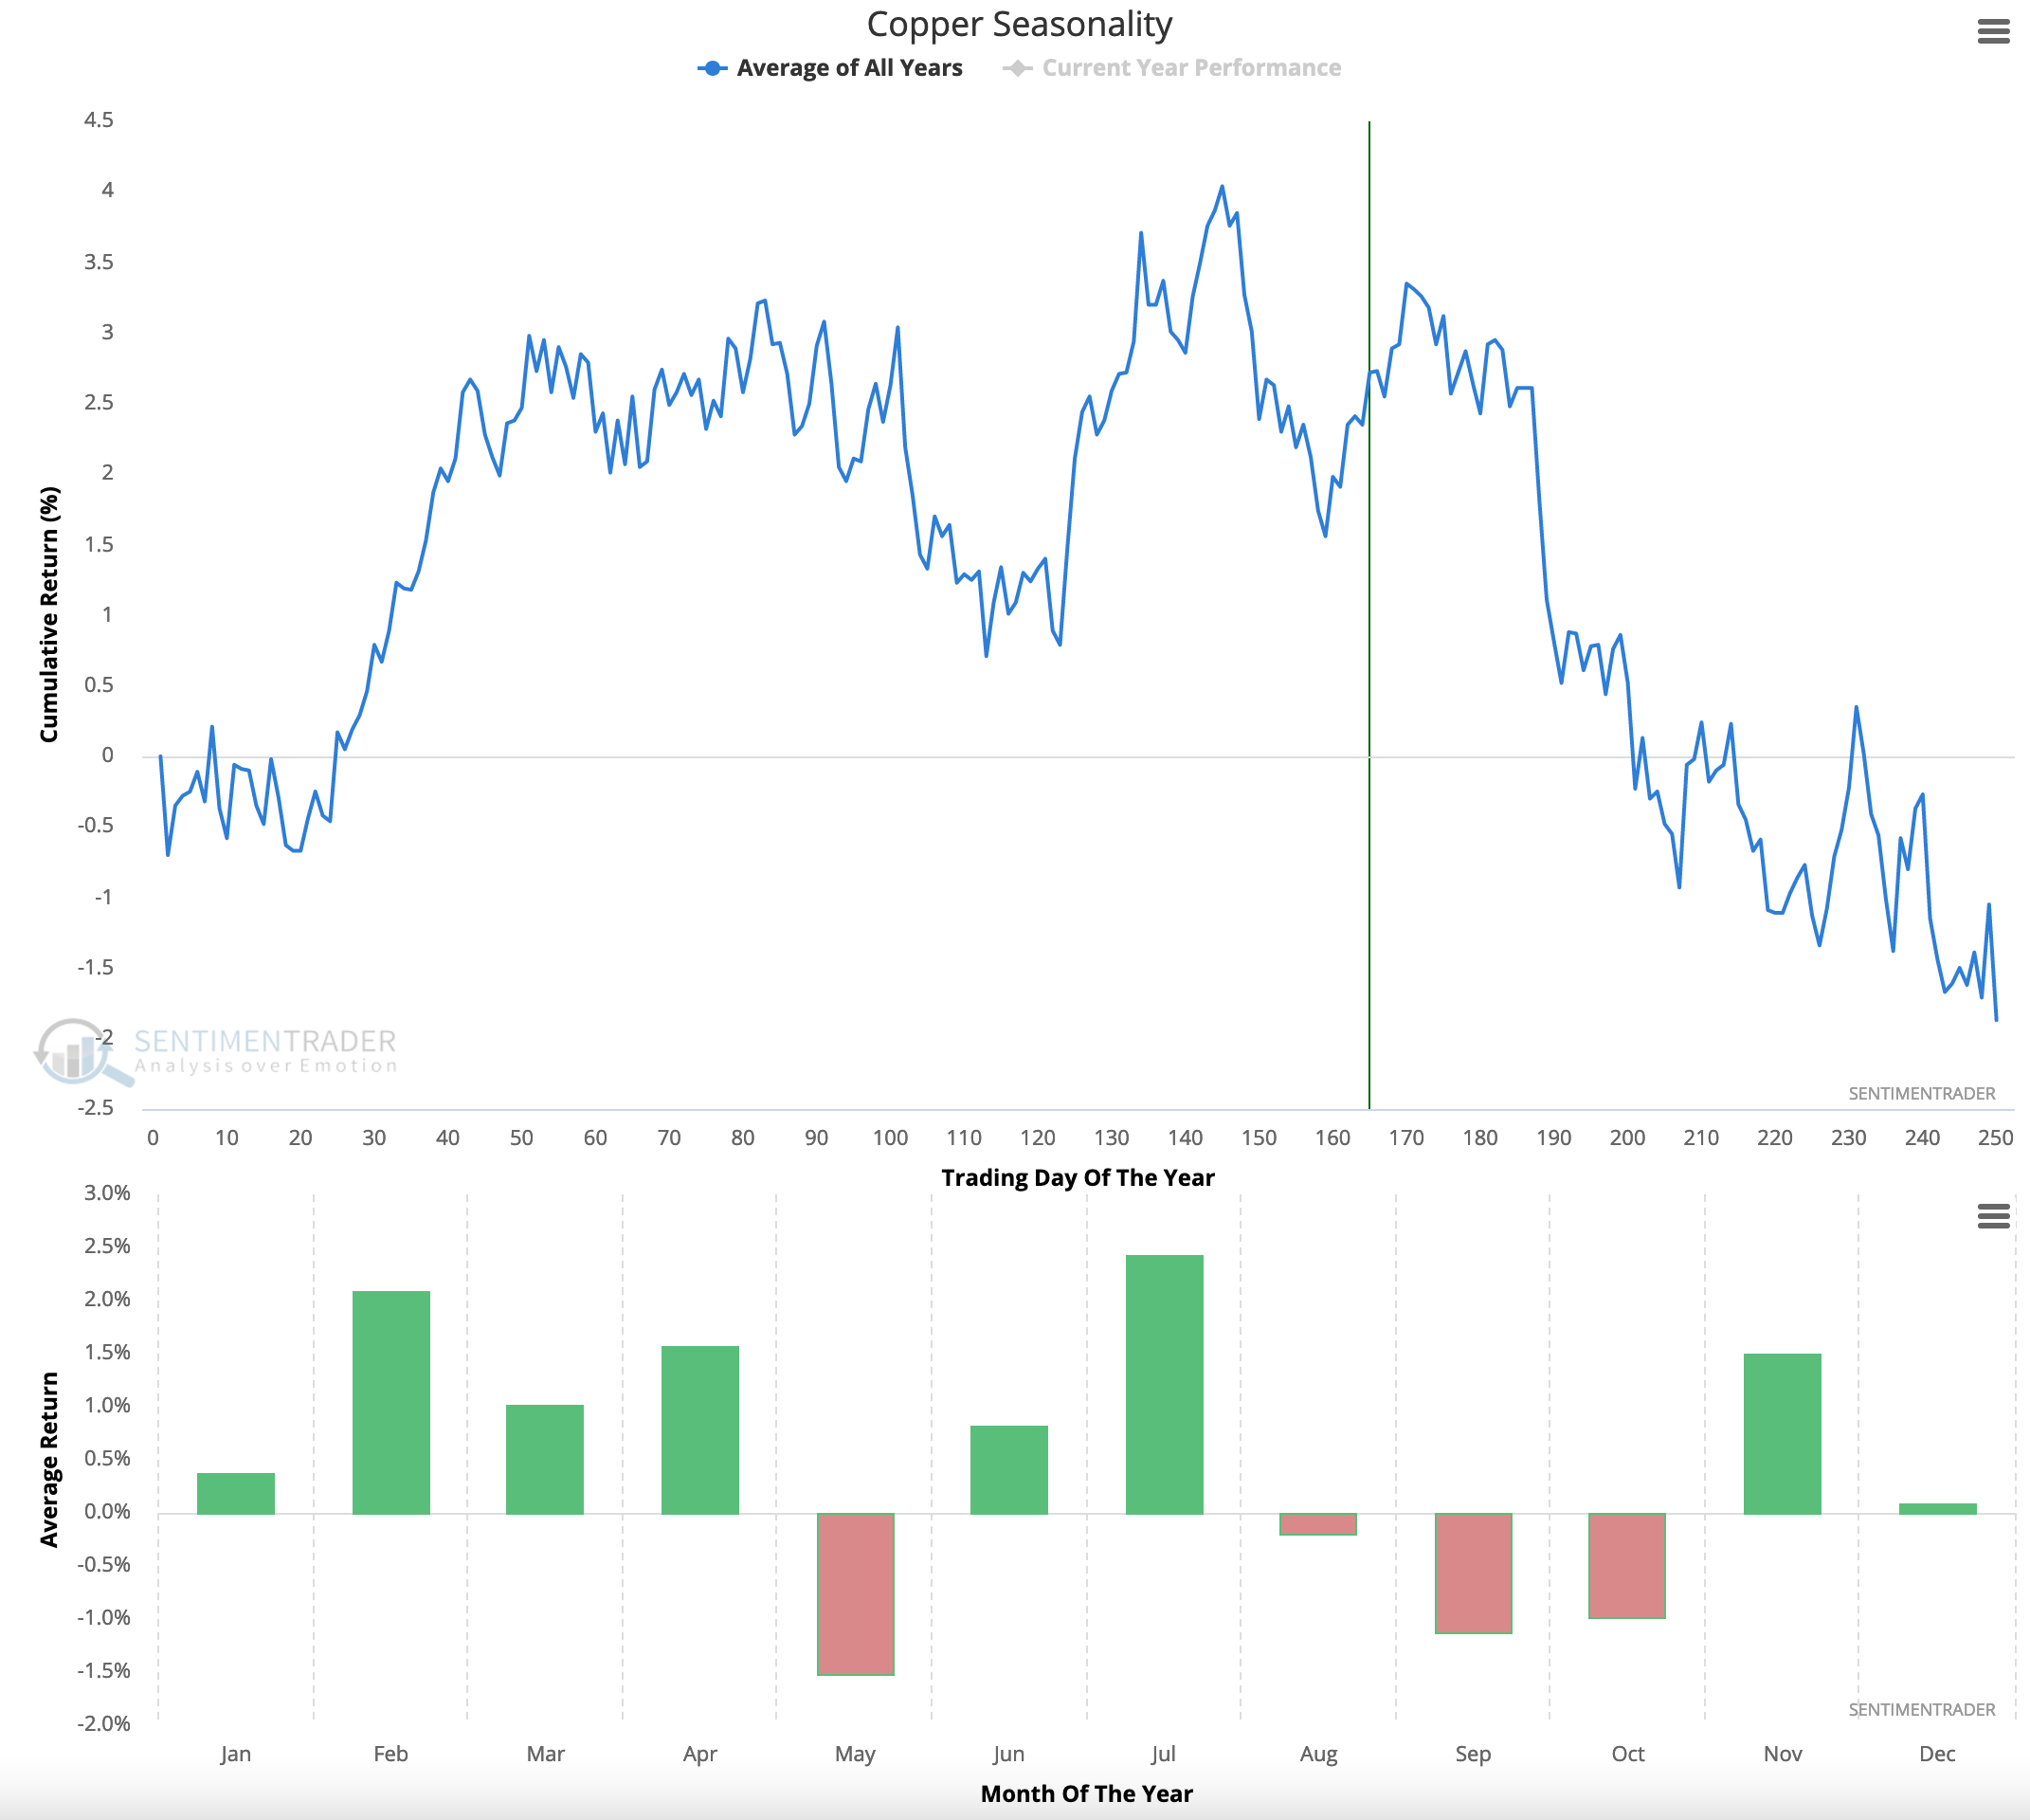
Copper has made its August dump and on average would bounce and fail into year end.
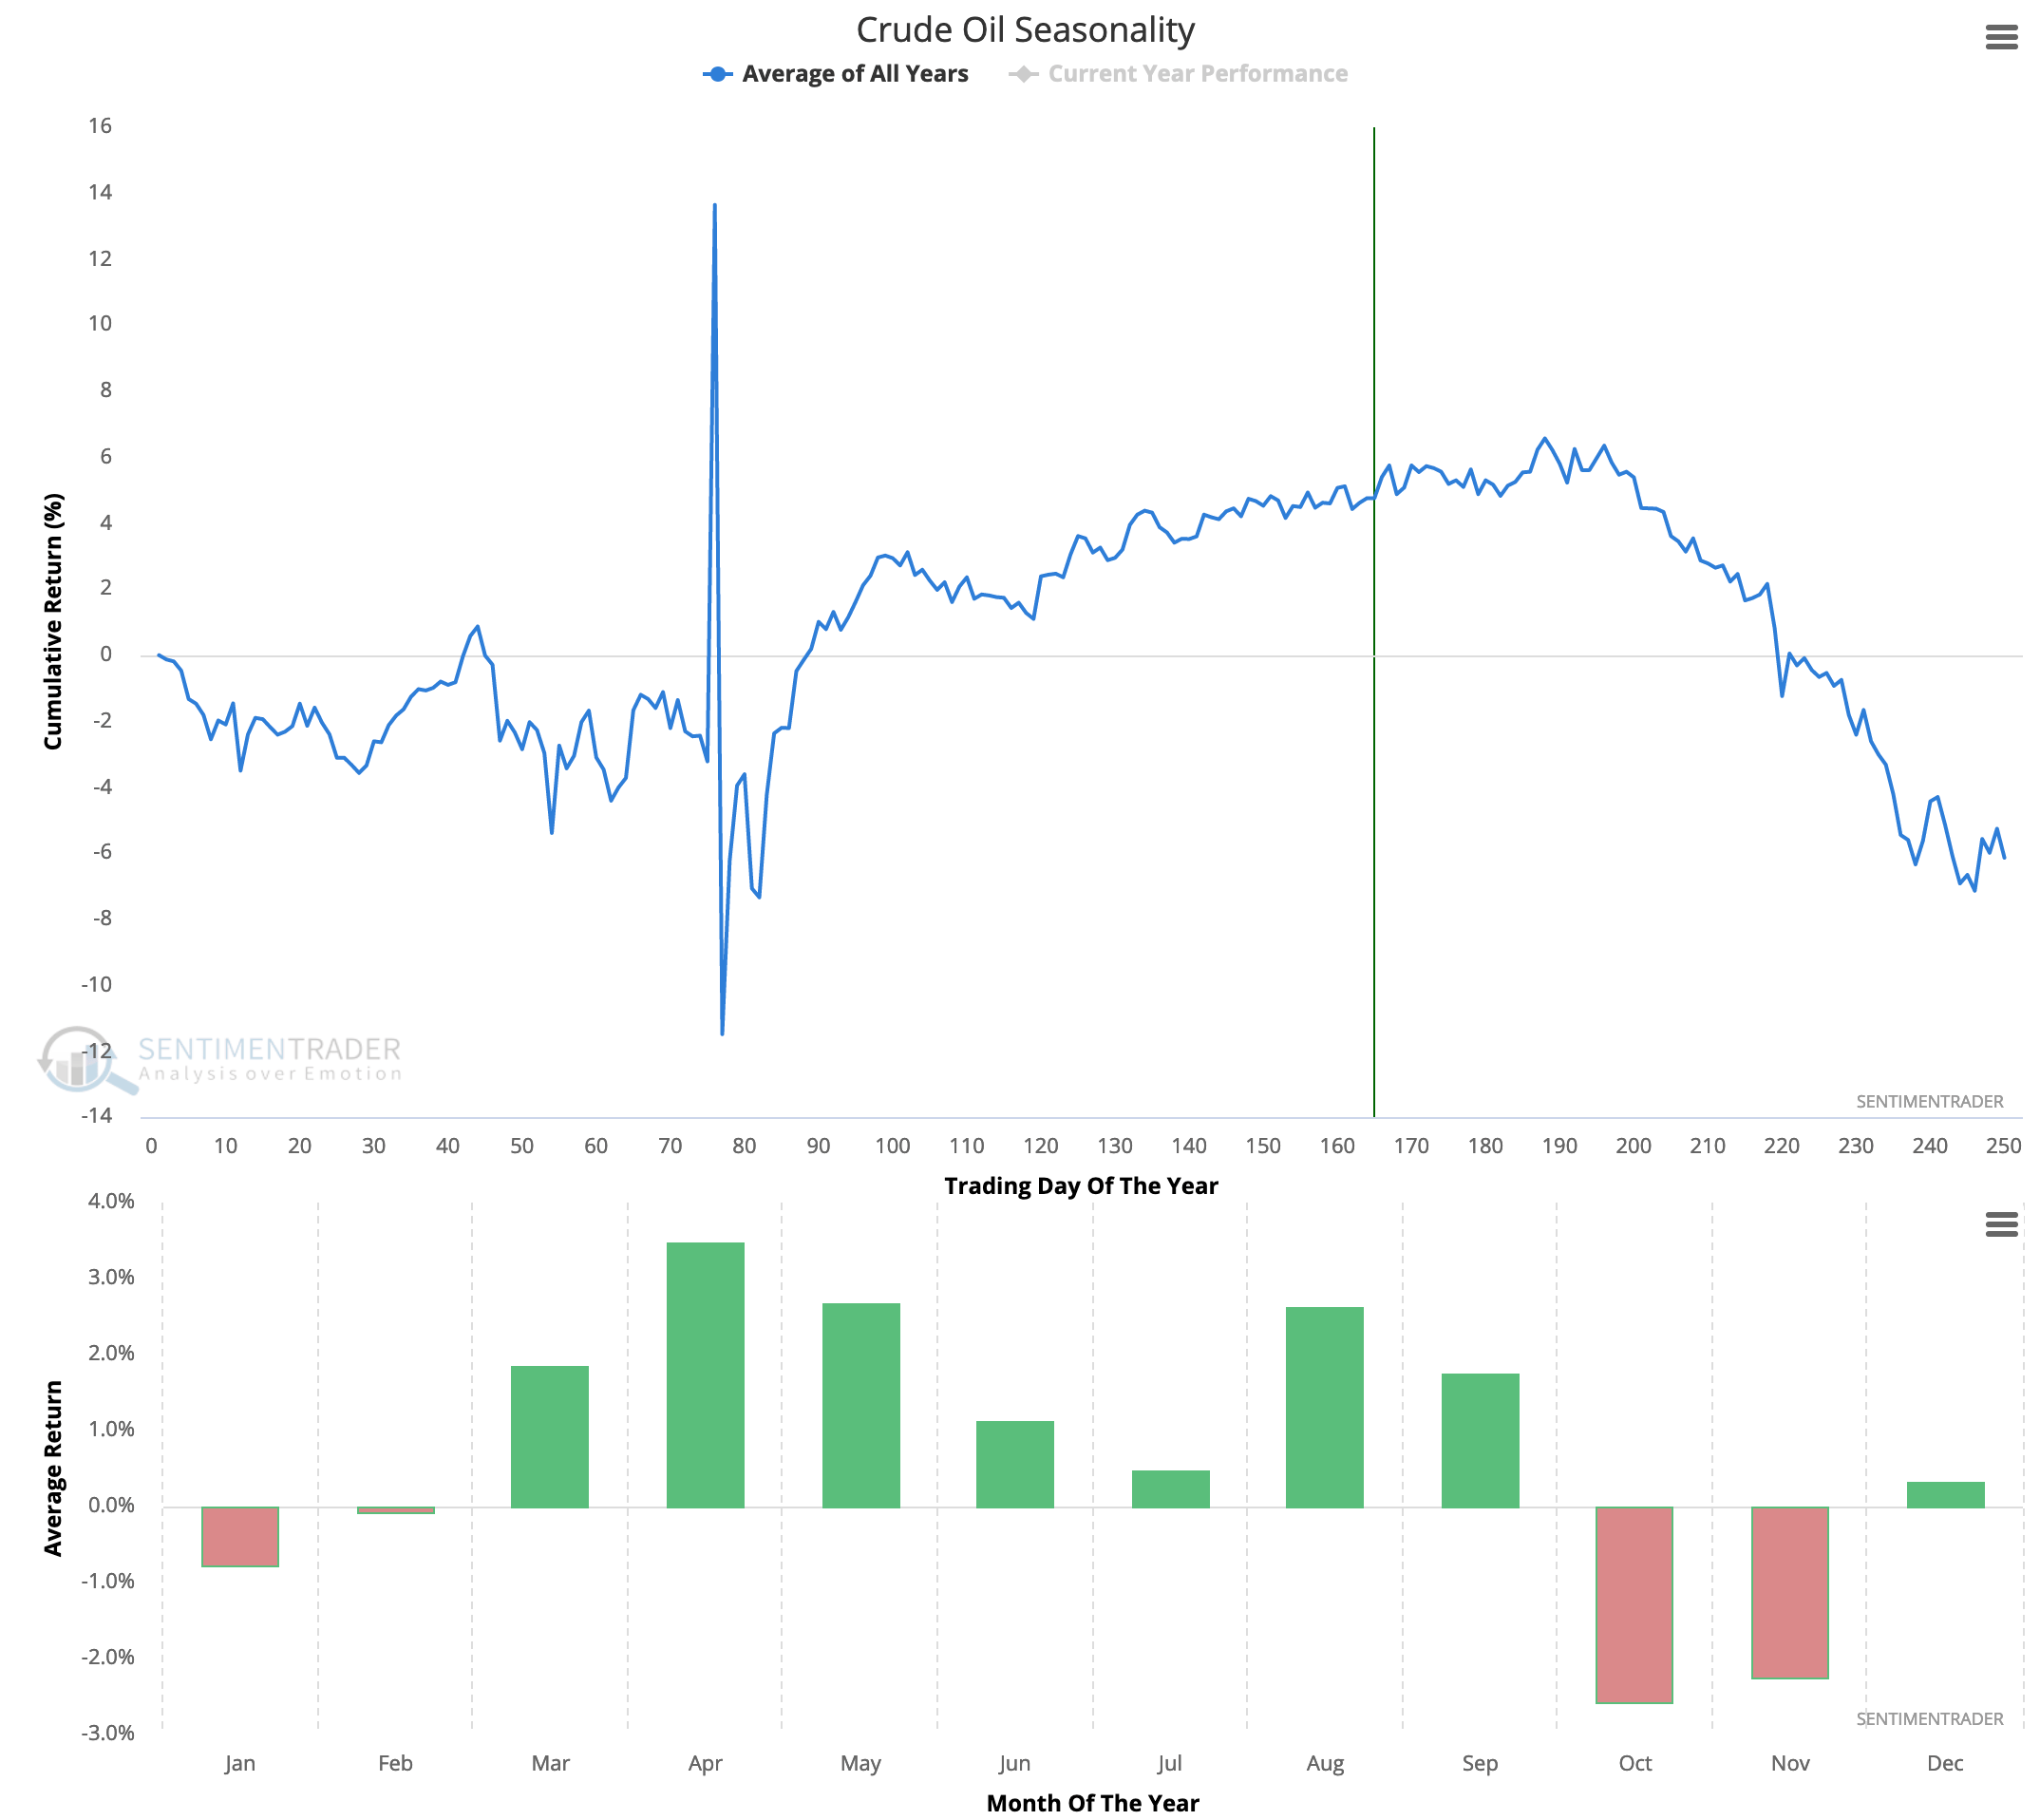
Crude oil began its rollover a couple months early, in July this year. Still, the average’s prospects do not look great for the rest of the year.
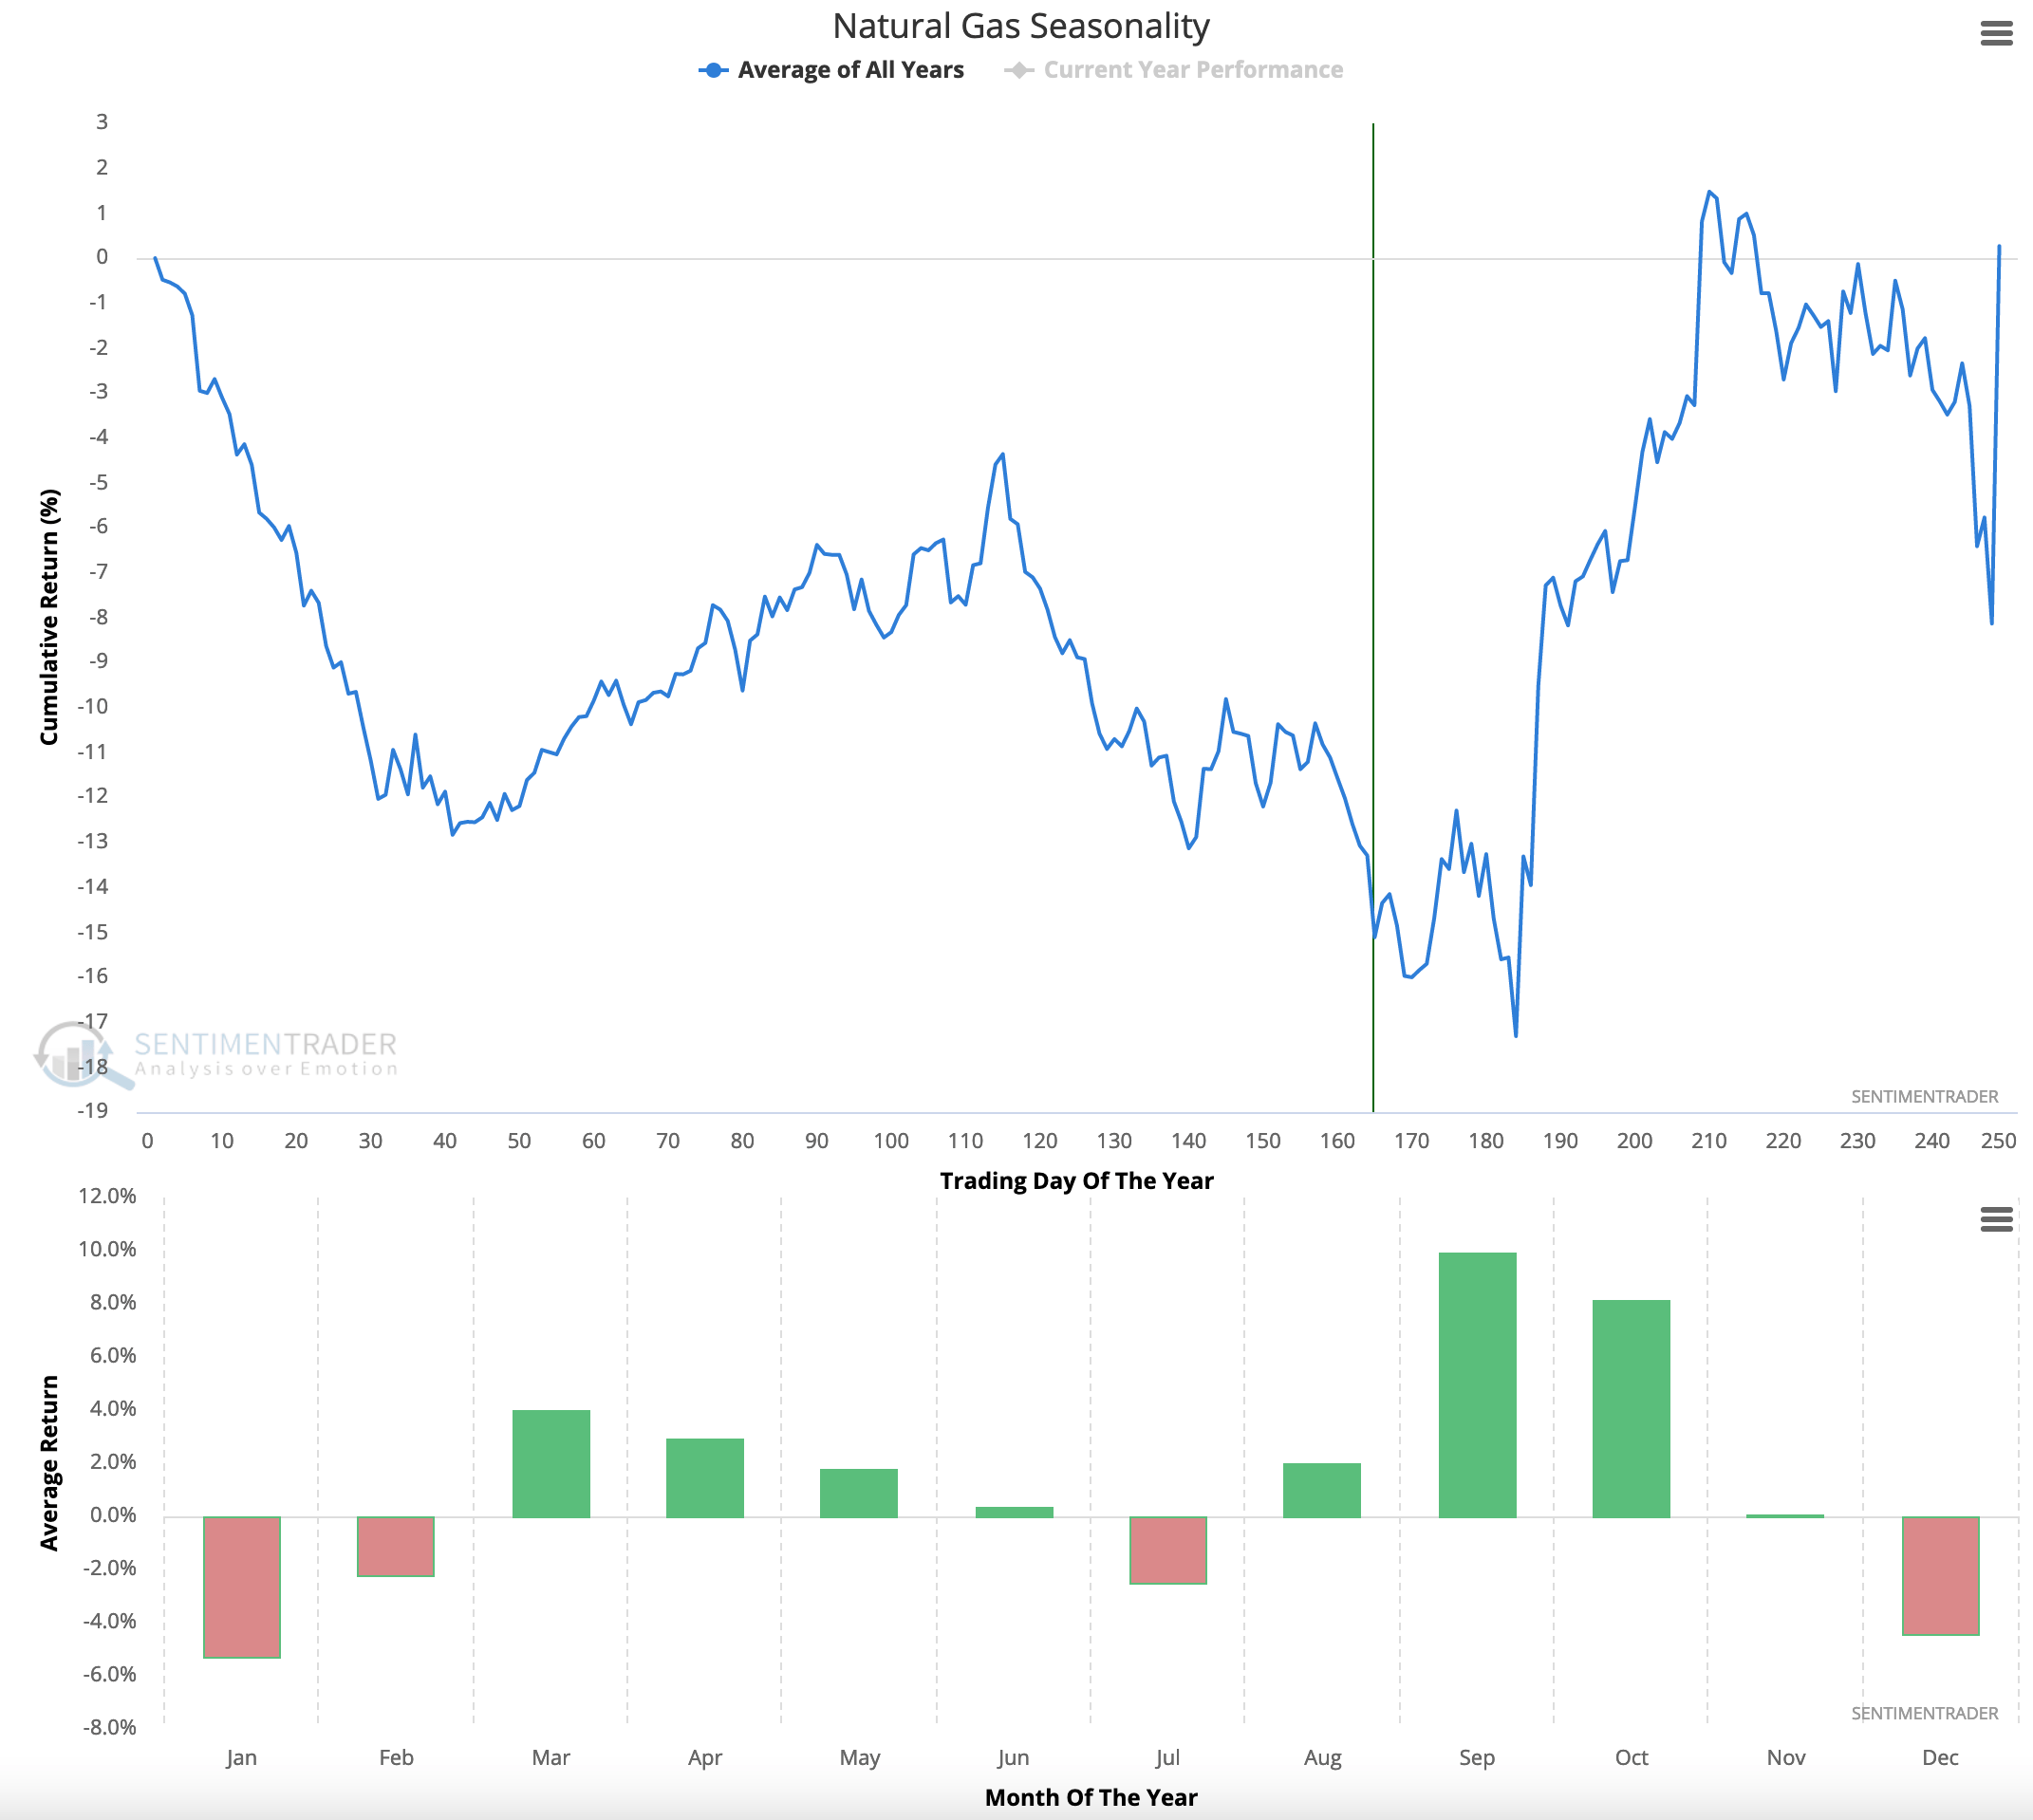
Natural Gas has been bullish and not at all in line with its average, which increases the odds that it’ll stay out of whack with it moving forward. However, the fact of Gas’s average is a low in September and a good Q4 rally.
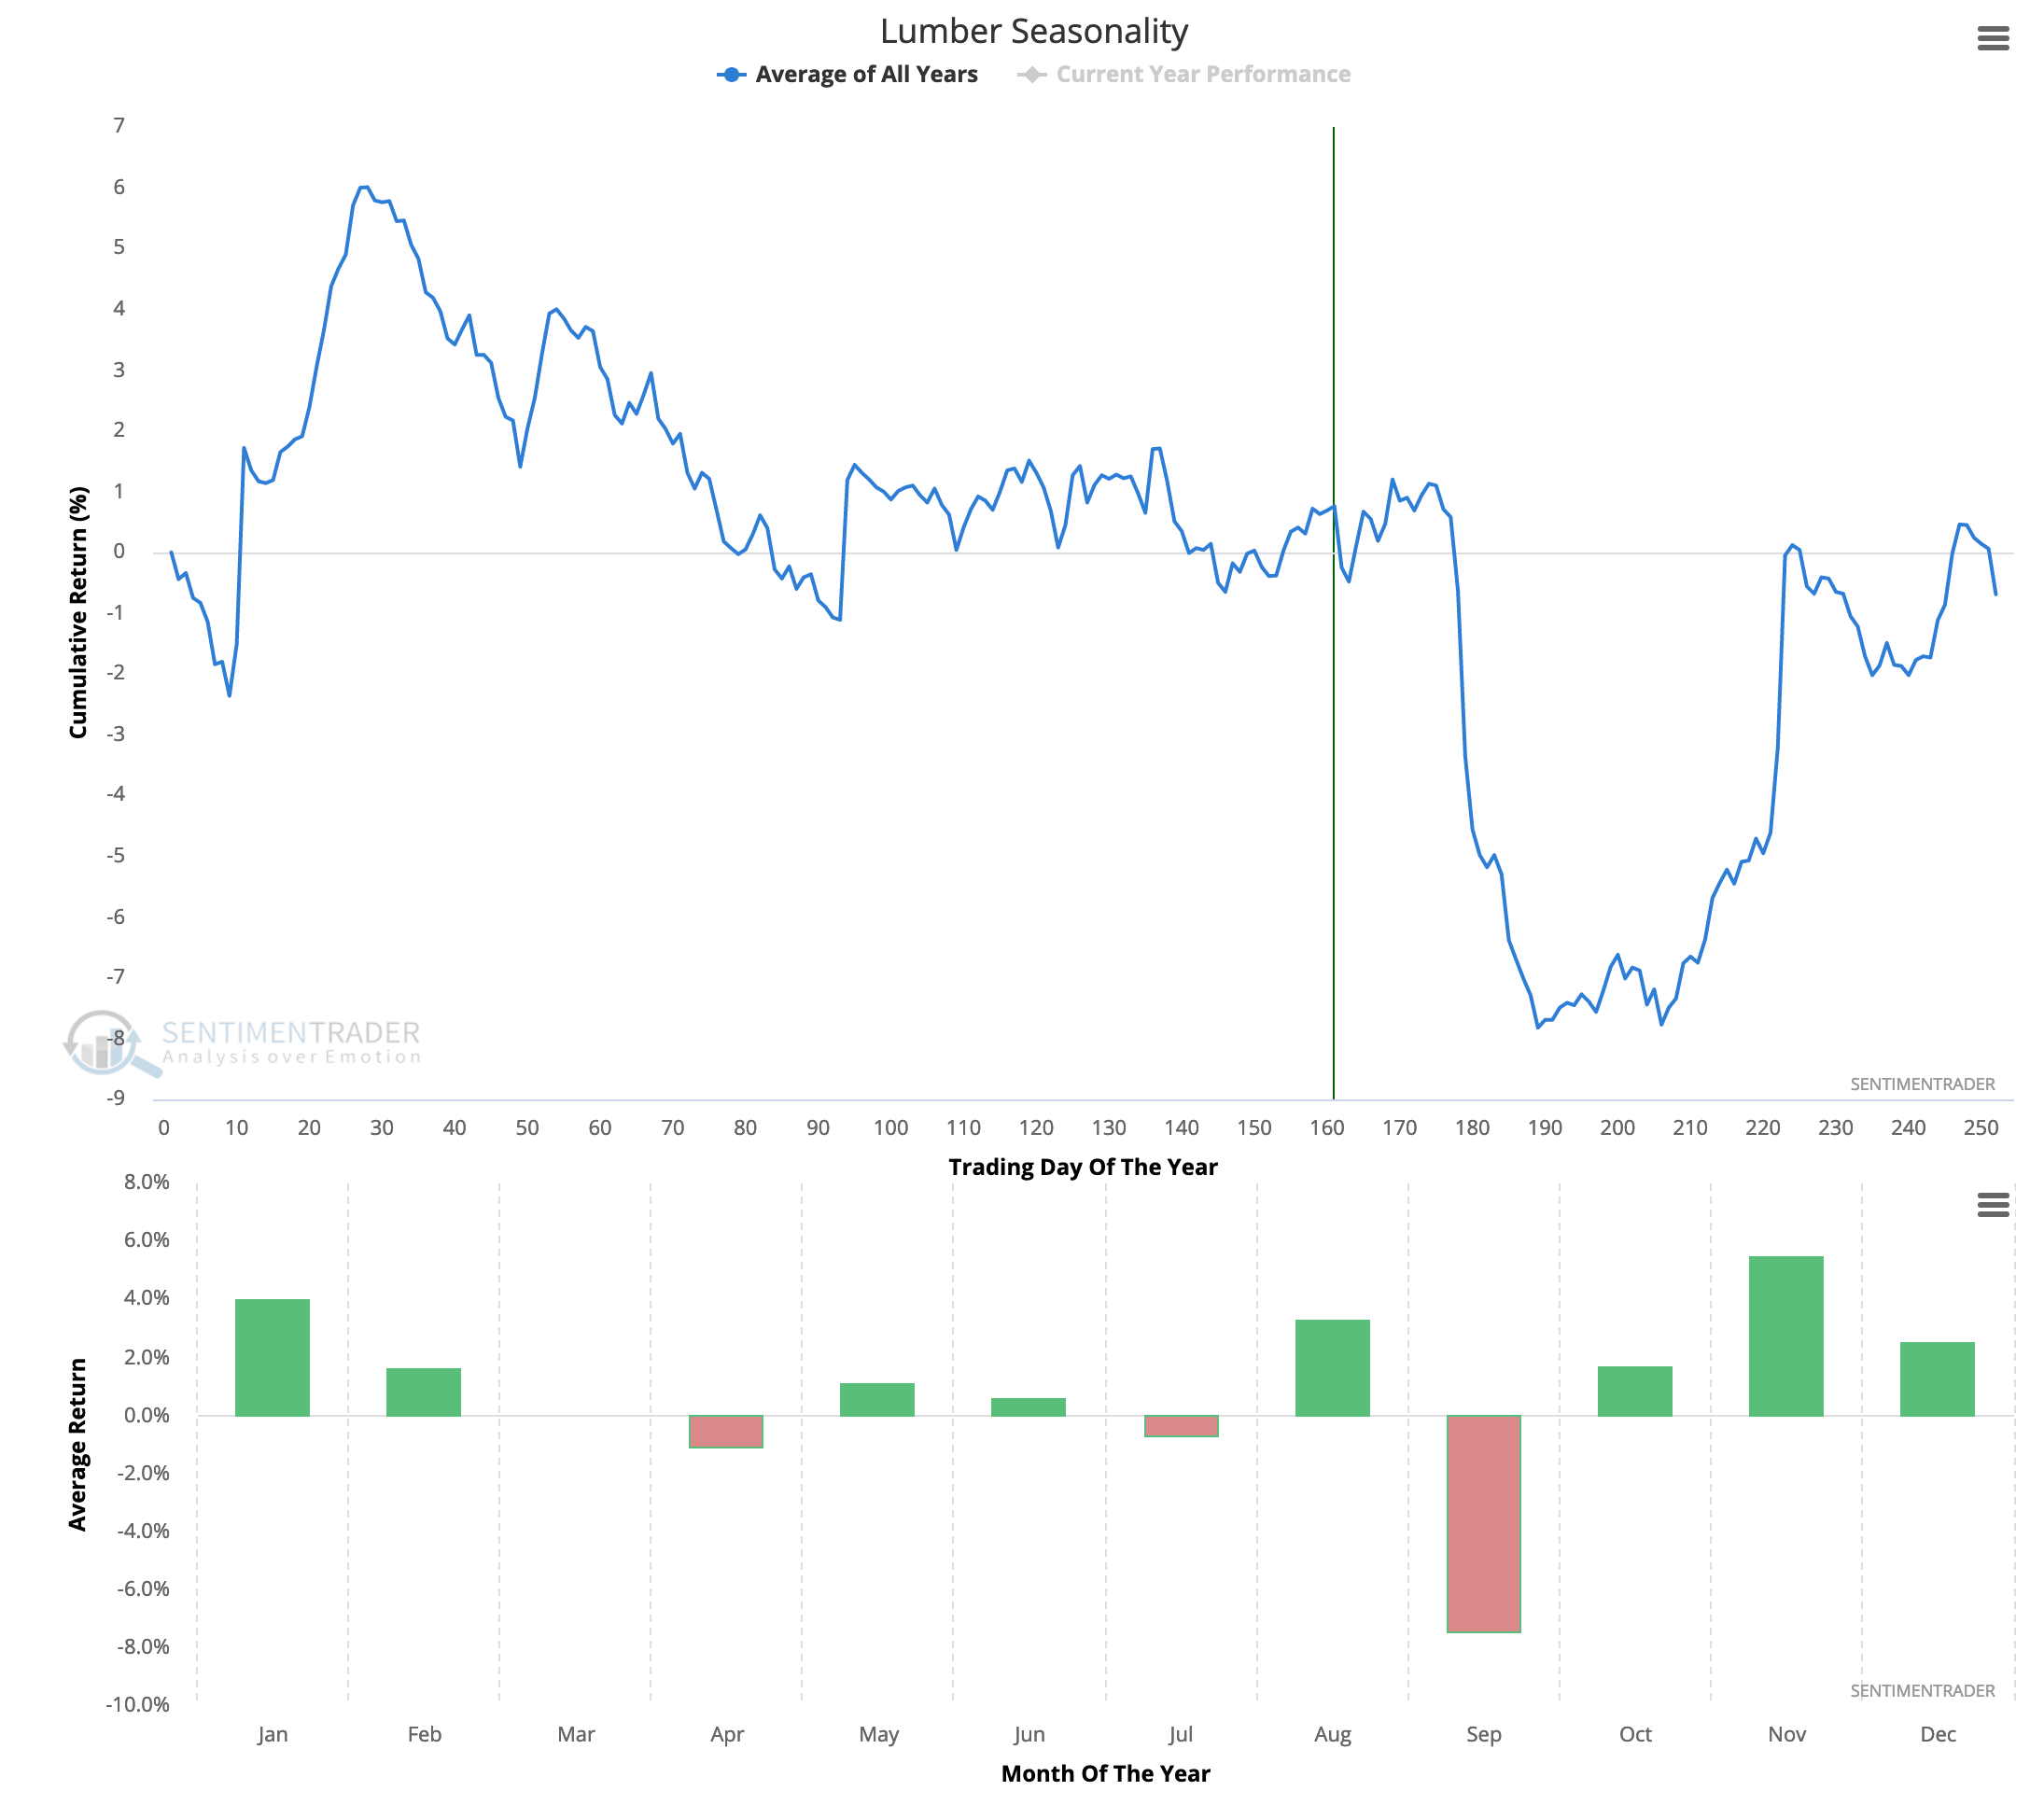
Lumber has already taken its crash scheduled for September. But just FYI…