Copper price nullifies daily chart breakdown
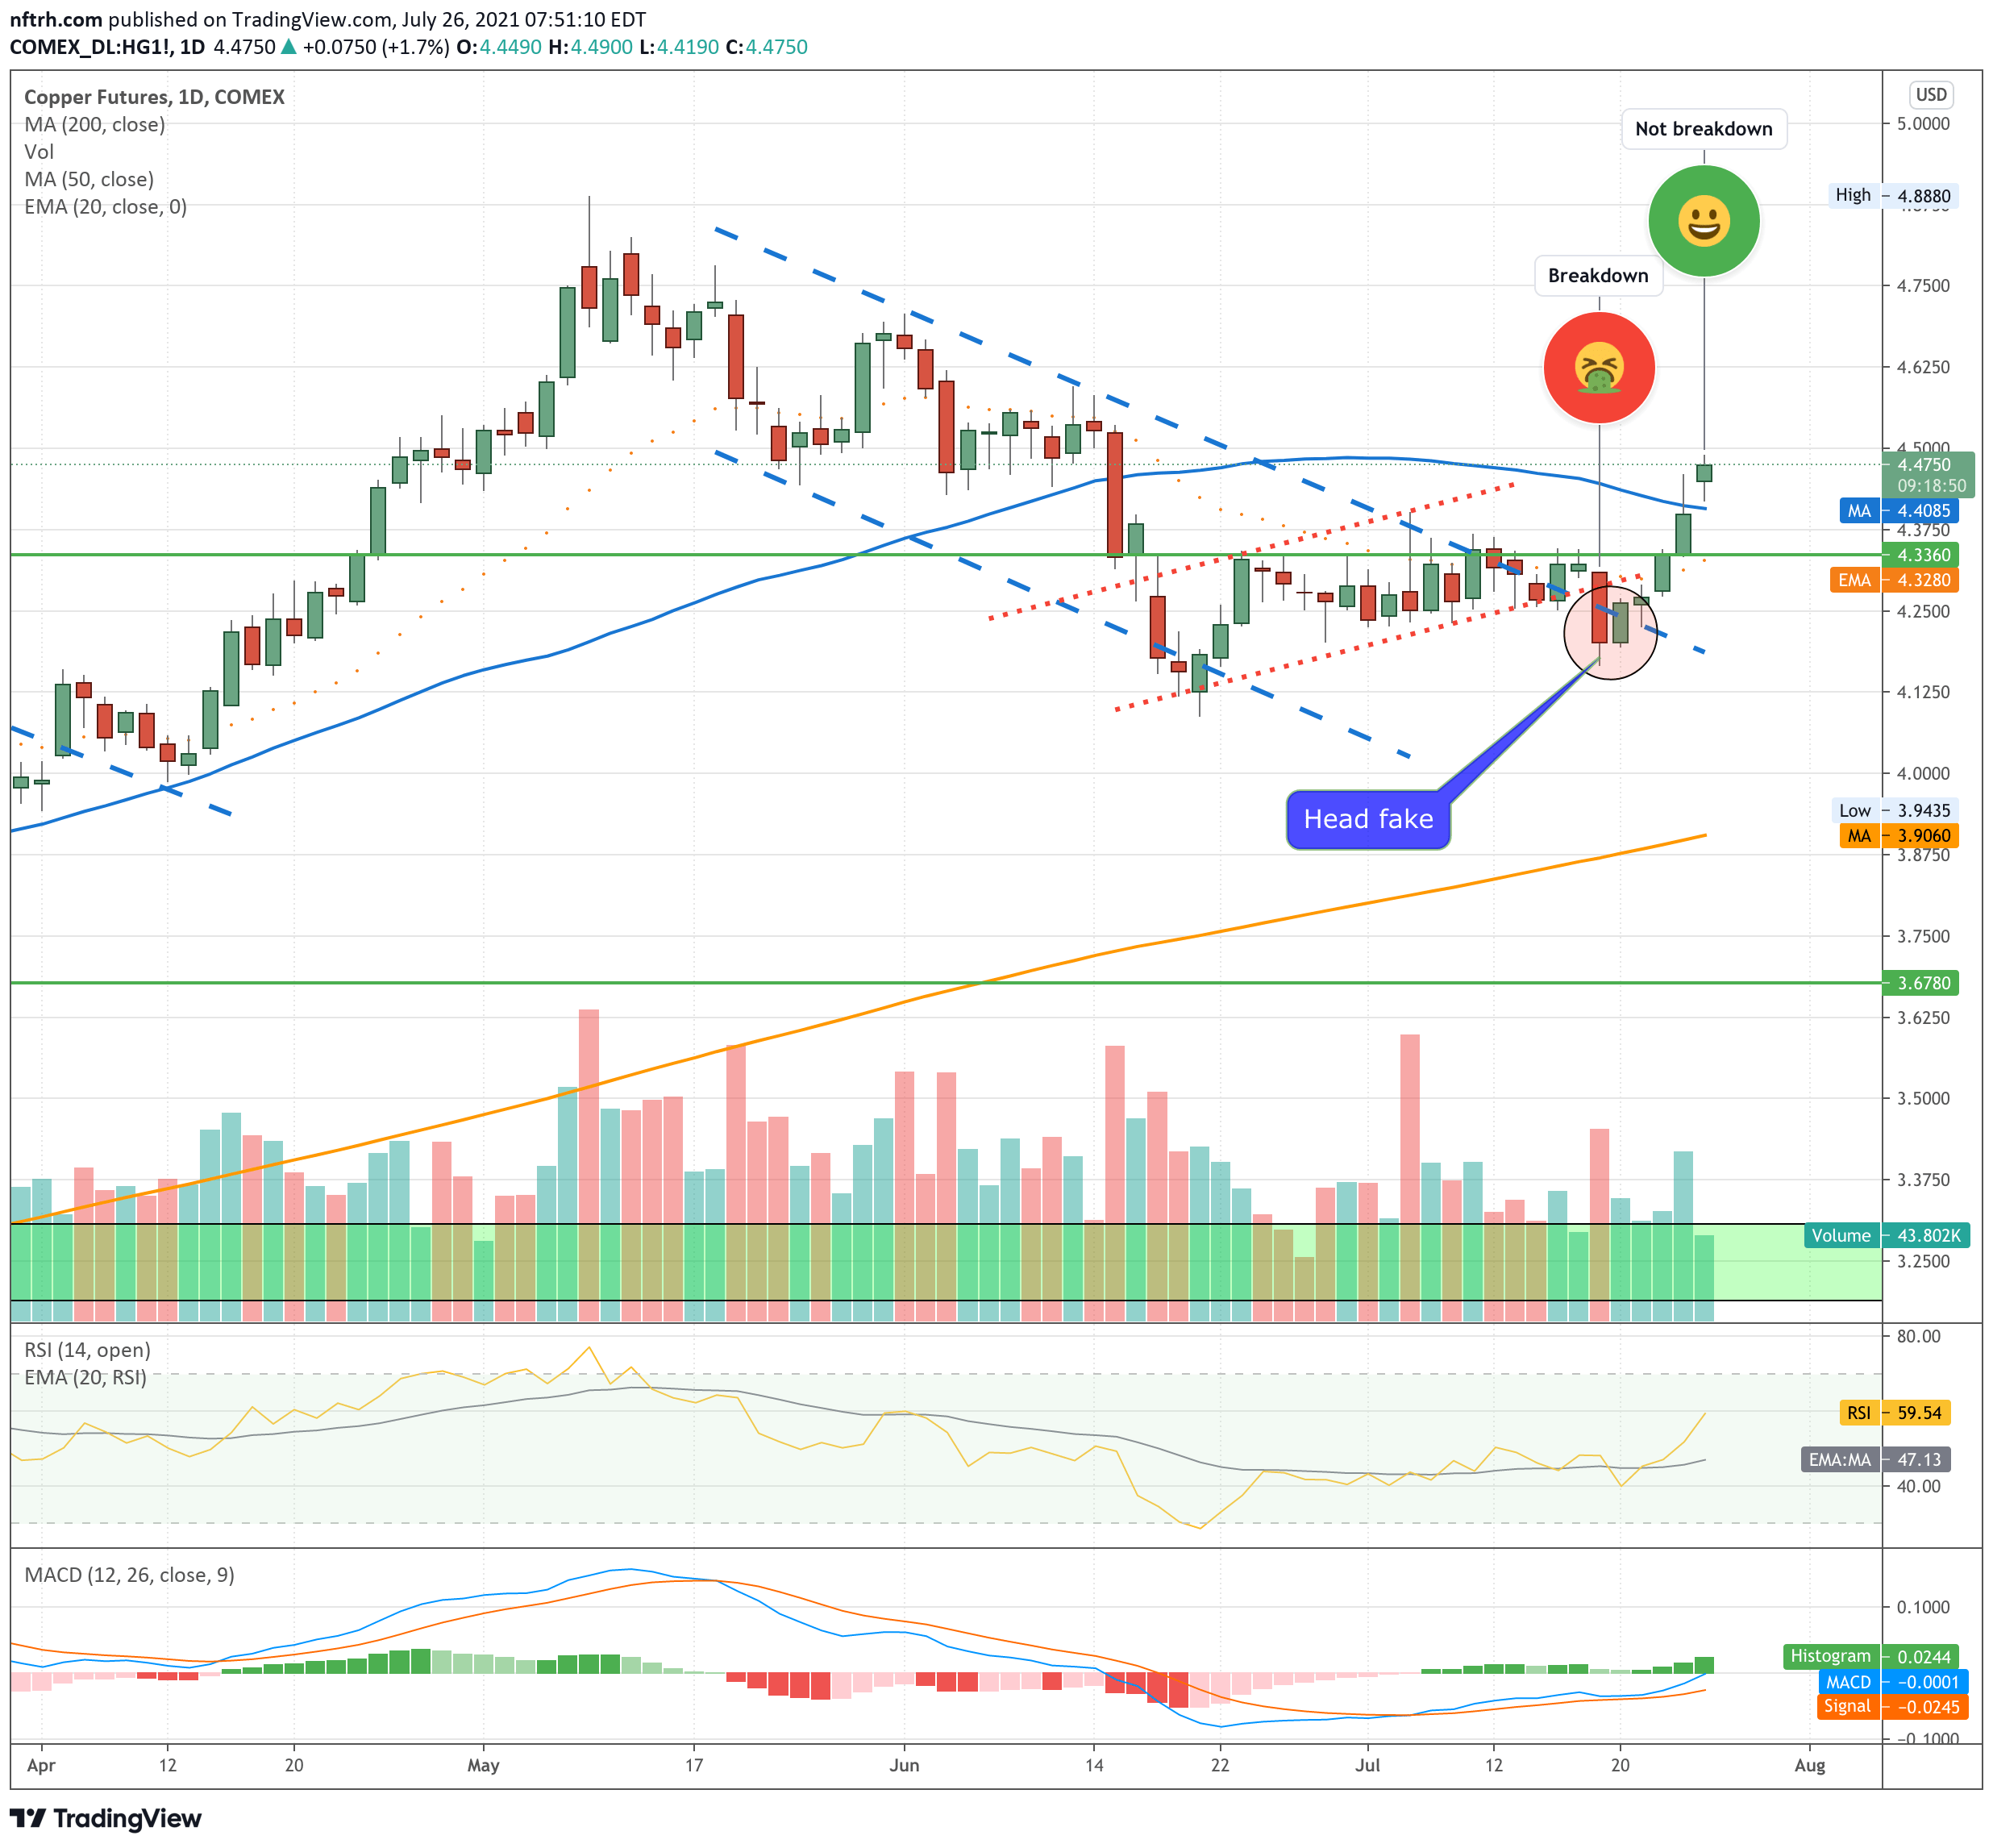
Last Monday we noted that copper was intact on the bigger picture but breaking down on the daily chart. Then on Tuesday we asked whether the turnaround in long-term yields might have signaled an end to the summer reflationary cool down and resumption of the reflation trades, of which copper is a headline play.
This morning the copper price has popped above the SMA 50, the US dollar is down (but not technically out) and other anti-USD trades (e.g. BTC) are getting big bids.
Interesting to say the least. My favored plan was for stage 2 of the inflation per the message of the 30yr yield Continuum. But I also have an eye on the USD and the Gold/Silver ratio, each of which are logically pulling back this morning but neither of which has broken down.
For “best of breed” top down analysis of all major markets, subscribe to NFTRH Premium, which includes an in-depth weekly market report, detailed market updates and NFTRH+ dynamic updates and chart/trade setup ideas. Subscribe by PayPal or credit card using a button on the right sidebar (if using a mobile device you may need to scroll down). Keep up to date with actionable public content at NFTRH.com by using the email form on the right sidebar. Follow via Twitter @NFTRHgt.