I preface this post about bearish indicators with a note that I am currently long only, in the form of SPY and IWM (while looking for short opp’s in individual stocks) and what ‘little crapper’ precious metals stocks I decided to hang on to through tax selling season (dividend paying cash equiv. are by a country mile the largest positions). But in my opinion the biggest stock market opportunity will be from the bear side in 2019. That’s how it’s shaping up as of now, anyway. Not being a swami I reserve the right to be wrong. I’d like to see the market bounce resume in order to re-short into it or see the symmetrical pattern on SPX fail in order to strap in for the 2100-2200 Express either in cash or short. But for now I am a man who stares at a (symmetrical) chart pattern and sits on his hands.
My plodding but happy-go-lucky 3 Amigos shtick was a prelude to the alarming and scary 2 Horsemen shtick. I have these shticks because writing about financial markets – and especially the indicators therein – can be boring when you do it every day. It annoys some people and maybe entertains others. But I see things in pictures and stories, so there you go. Writing for the public is a lot different than the more business-like writing in NFTRH.

The Amigos would ride with the good times, but when they stop riding (well, when 1 & 3 stop riding; Amigo 2 can be associated with market damage either way) it would be time for macro changes in the direction of obvious stress on US and global markets. As of now…
- SPX/Gold Ratio: Cracked but not broken down.
- 30yr Treasury Yields: Broke the monthly EMA 100, but are pulling back of late.
- Yield Curve: Still flattening on the long-term views.
It is no coincidence that the 2 Horsemen are both firm as market stress plays out across the globe.

The US Dollar broke out yesterday and markets cracked.
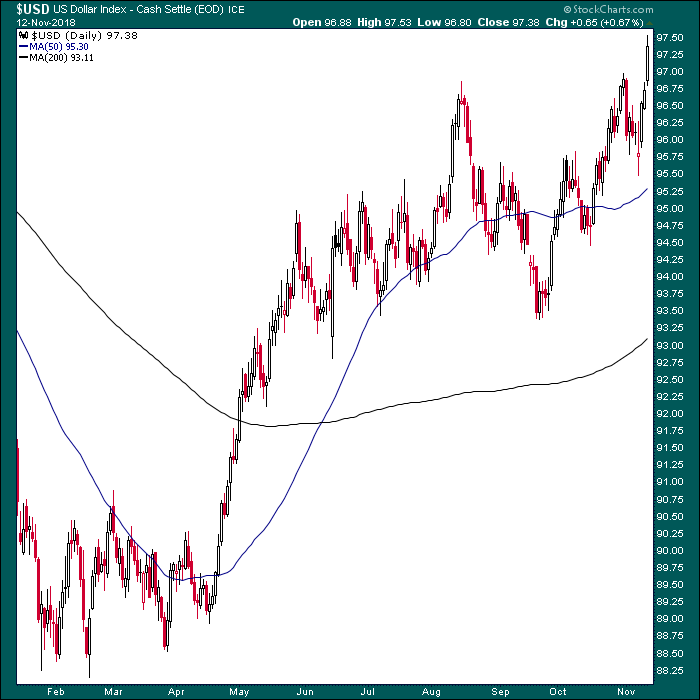
The fact that it happened in tandem with the Gold/Silver Ratio (GSR) is what gave it the bearish oomph. Note the similarity of the patterns since August.

Bob Hoye said it best when he described gold/silver as a metallic credit spread. When rising it exerts pressure on precious metals, commodities, the cyclical global inflation trade and certain US sectors. The sound theory being that silver has more industrial uses and thus, more commodity-like characteristics than gold.
So the 2 Horsemen popped but the stock market is looking to get a little pop this morning as well, by the look of the futures. We’ll need lots more indicators than just the ones above. For example, a more traditional credit spread is in junk bonds vs. higher quality bonds. Nominal Junk has broken down, much like the stock market. But its trends vs. higher quality bonds are still up.

Maybe we can add this and one other key indicator and get the Armageddon riders up to a more traditional 4 Horsemen going forward.

Subscribe to NFTRH Premium (monthly at USD $33.50 or a 14% discounted yearly at USD $345.00) for an in-depth weekly market report, interim market updates and NFTRH+ chart and trade setup ideas, all archived/posted at the site and delivered to your inbox.
You can also keep up to date with plenty of actionable public content at NFTRH.com by using the email form on the right sidebar and get even more by joining our free eLetter. Or follow via Twitter @BiiwiiNFTRH, StockTwits or RSS. Also check out the quality market writers at Biiwii.com.