With all the hype and noise built in to daily and weekly market management, sometimes it is worthwhile to dial out, calm things down and touch base with markets on the big picture. Here are views on various markets (with limited commentary) by way of some NFTRH monthly charts.
Let’s start with currencies, since they are a reflection upon global policy making, which has been unprecedented in its direct market interference over the last few years.
Nominal Charts – Currency
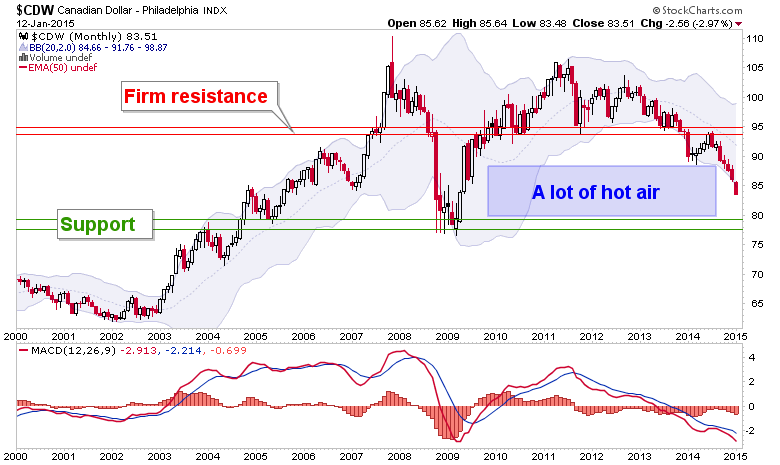
We noted the hot air patch in the Canada dollar last year. I had thought CDW might stop and find support at 85, which is a measurement from the topping pattern; but so far, no dice.
Fellow commodity currency Aussie is at what should be a strong support zone.

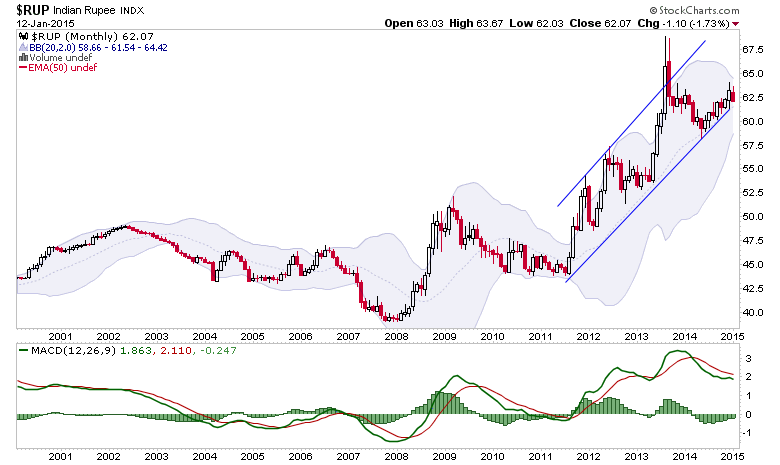
[edit] evidently my uninformed use of stockcharts.com’s symbol for the Rupee is incorrect. I have had input that this chart is an inverted view of Rupee-USD. Looking into this.
Meanwhile, the Swiss just rejected gold as a currency stabilization tool. Swissy responds by breaking a trend line and turning monthly MACD red for the first time in over a decade. Not smart.

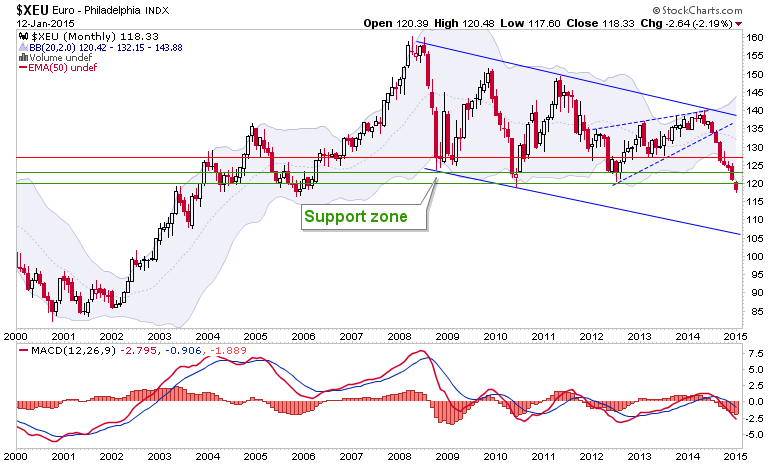
Euro appears to be in deep trouble, both by the inflationary noises emanating from the ECB and by this break down from critical support. This needs to reverse in-month or the button is pushed on an express elevator to 105.
The Yen is at another support area.

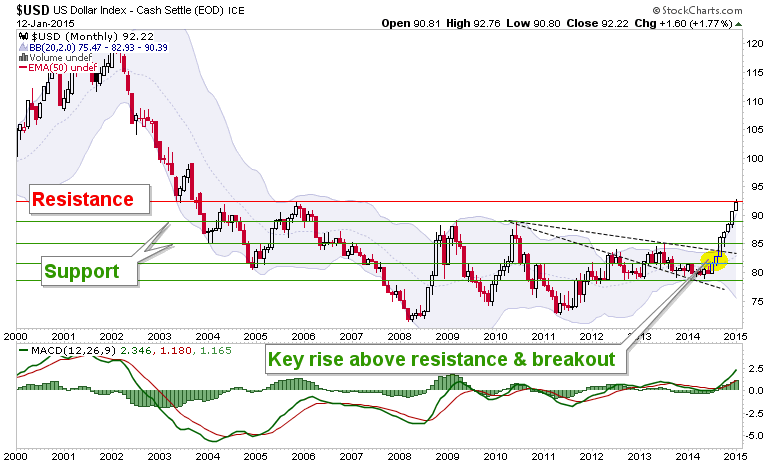
The US dollar made a little nudge above resistance that we identified last summer. Yes, way back in the summer when everyone still hated Uncle Buck. Since then we have followed its progress from constructive to bullish to over bought to impulsive. It’s at resistance… again.
Is the Yen at orange arrow #3 per the USD comparative? If so a hard bounce is imminent.

Precious Metals
On to the precious metals, let’s dig up the old chart of gold with several different options. Thus far, the lesser of the big Symmetrical Triangles is holding. Everybody hates gold now because they have been conditioned as such.

Another view for reference, as gold thus far productively deals with lateral resistance.

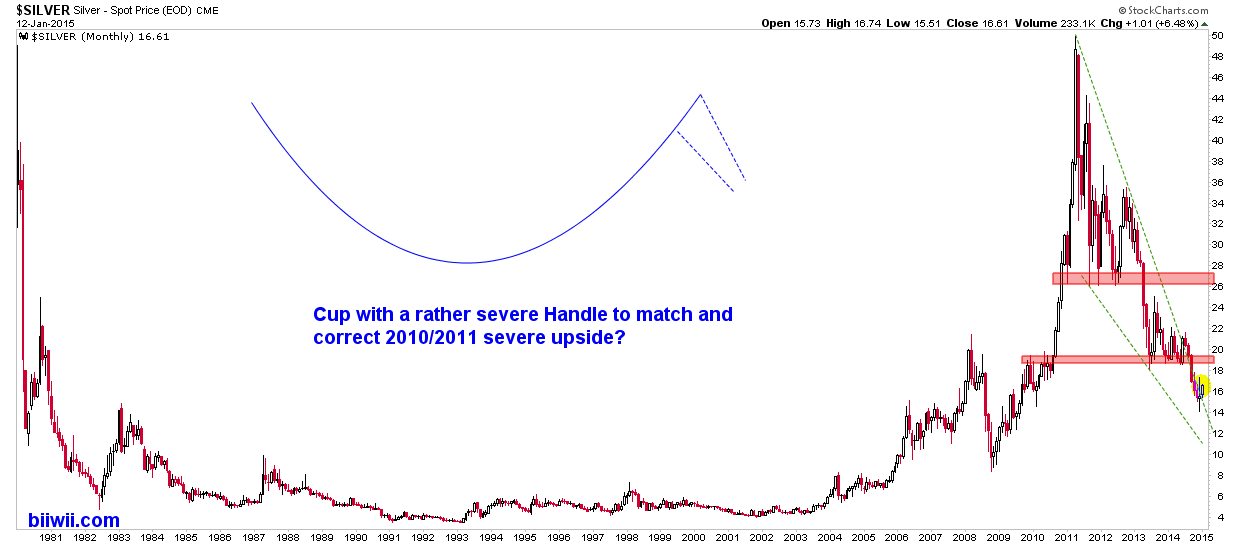
Silver is in a massive Falling Wedge/Handle. Our downside objective was 14, and so far gold’s wild little brother is holding it and trying to get up and out of the wedge. Notable resistance is at around 19 and massive resistance is around 26.
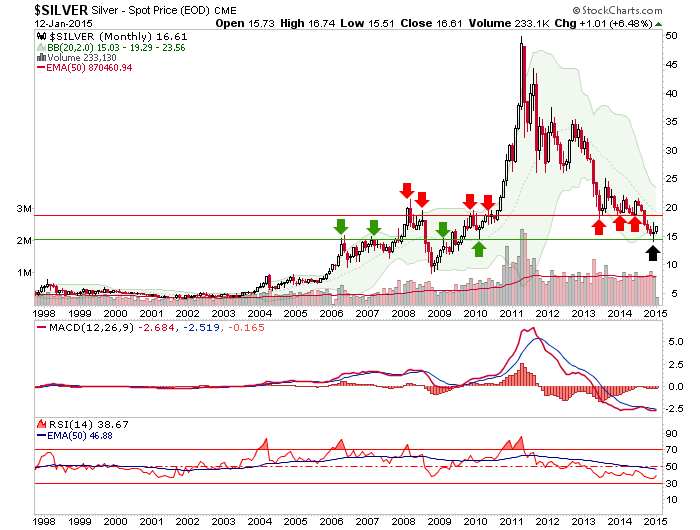
Silver, alternate view. Let’s deal with 19 before thinking about 26.
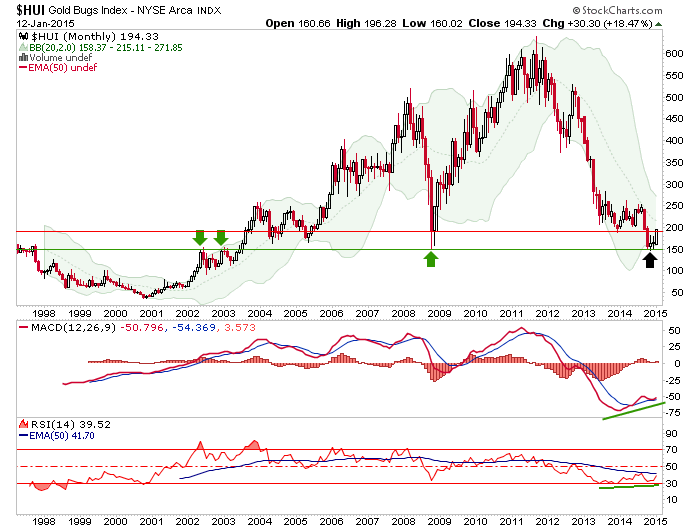
HUI Gold Bugs pops to a key resistance point.
HUI vs. SPX shows a great risk vs. reward in gold stocks to the US stock market, all other things being equal.

Oil is at the trend line.

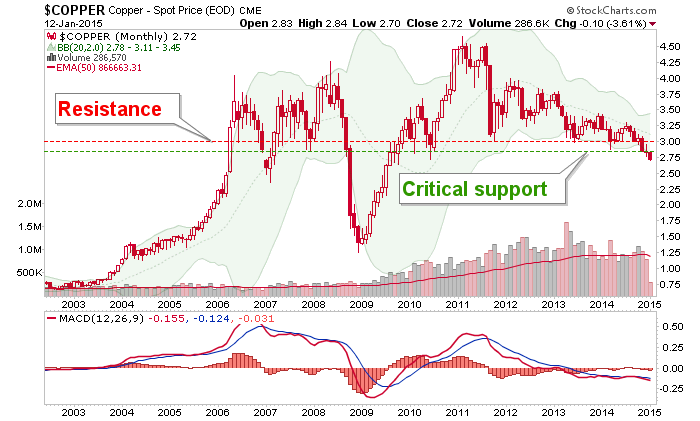
We have used this chart of Copper for years now, to stay the heck away from anything related to it. Nobody should have been messing with copper since at least the breakdown of 2 years ago.
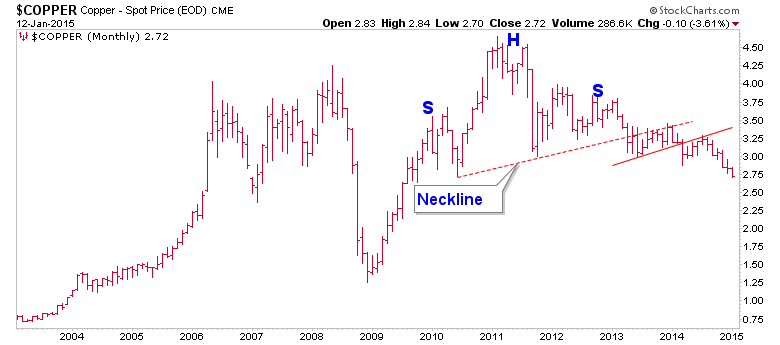
Alternate view. It’s another ‘in-month reversal or else’ situation.
CRB is precarious as well. A lower low to 2008 would finish this index.

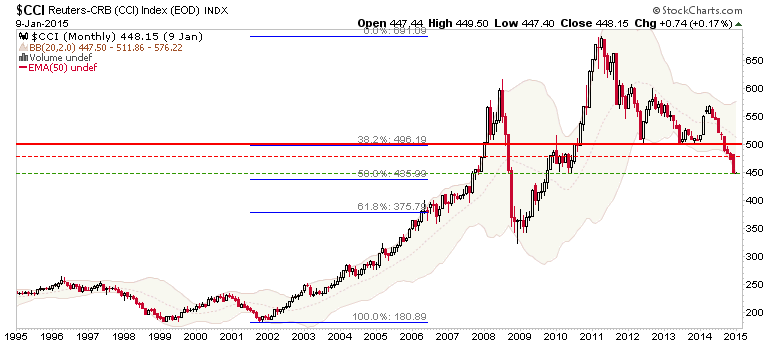
CCI is more evenly weighted. It is at a tentative support point.
Gold vs. CCI shows our long-standing view of a secular global economic contraction not only held up last year, but it bottomed and resumed. This is IMO the most negative chart on the macro, unless you are an advocate of quality gold mining operations. Those are counter-cyclical in their best investment case.

Stock Markets
We targeted this crazy stuff for the S&P 500 long ago.

SPY however, has already gotten to target. Distortions between the two probably have to do with dividends and total return.

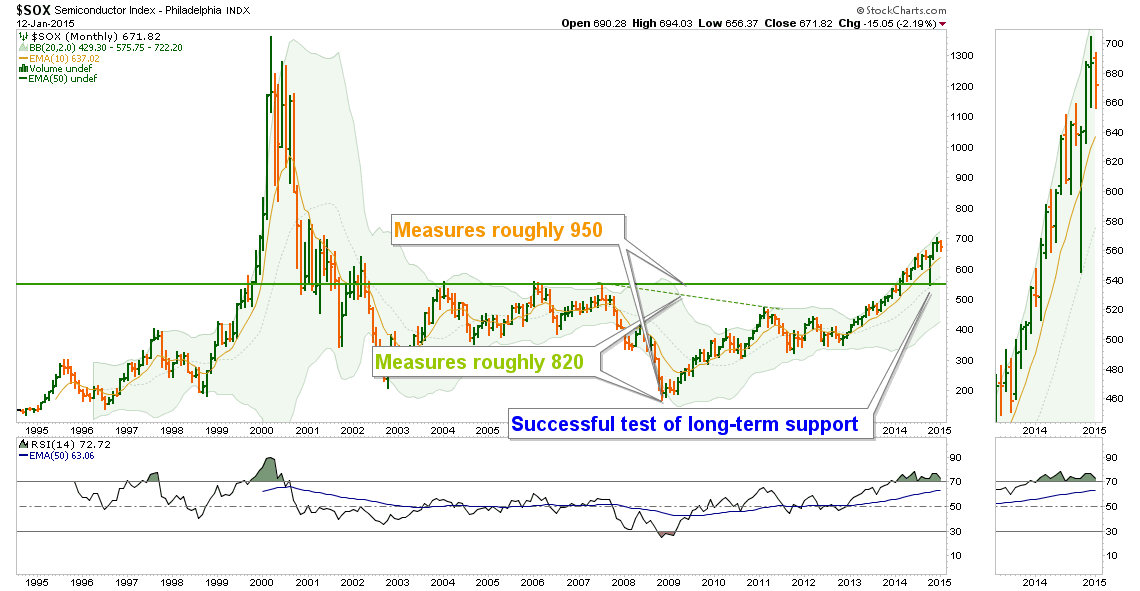
SOX has been of great interest ever since it broke above decade-old resistance.
SOX vs. the Nasdaq 100 continues to look like it has bottomed.

Europe’s 50 are at very important support at around 3000.

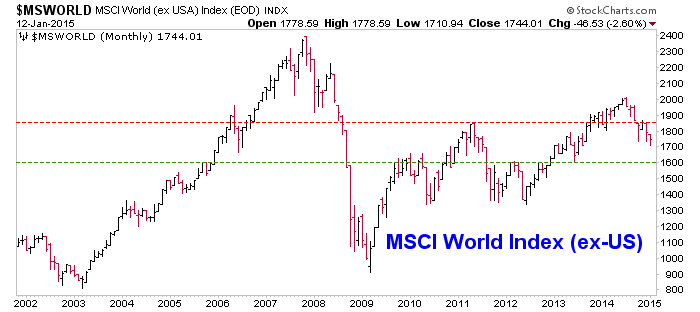
The World (ex-US) looks headed for key support at 1600.
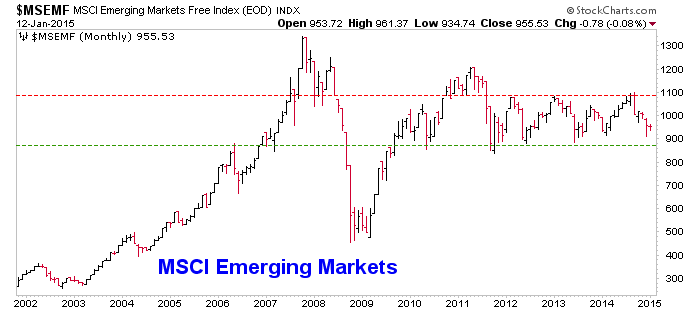
The Emerging Markets have gone nowhere since 2011.
More Ratios & Indicators
Gold vs. S&P 500… fear gap filled. 2008 never happened. Move along, nothing to see here. Pay no attention to that man…

Gold vs. Euro is breaking through resistance and MACD triggered up.

Gold vs. Yen is breaking above resistance as well.

Gold-Canada is at resistance but constructive.

Gold-Aussie is very constructive.

Gold-Swissy may one day remind the Swiss voters of a fateful mistake.

Suddenly everyone’s bullish on long-term bonds (bearish on yields), unlike 1 year ago.

And 5 year yields are starting to get the memo. What, no rate hikes in 2015?

10’s & 2’s…

Folks, despite all the wishful thinking in the gold “community” since 2011, a declining 10 vs. 2 yield spread has been bearish for gold. If short-term rates get a memo that the Fed intends to maintain ZIRP indefinitely and short-term yields play downside catch-up, the curve will rise and that would be bullish for gold.

I hope you enjoyed this little stroll along the vista by which we can take a reading on the big picture view.
Subscribe to NFTRH Premium for your 25-35 page weekly report, interim updates (including Key ETF charts) and NFTRH+ chart and trade ideas or the free eLetter for an introduction to our work. Or simply keep up to date with plenty of public content at NFTRH.com and Biiwii.com.