

Summary
A brief summary of the work done in this week’s report and in the updates and reports leading up to this point. Please read the detailed report for the complete picture. There are many granular details that cannot be summarized so briefly.
[new comments in italics]
Precious Metals (bull market)
Anticipating one final decline to a good low if/as current bounce fails. That would be a possibly epic buying opportunity. [bounce failed, but still in play IMO, seasonal low in gold is now]
US Stock Market (bull market)
Anticipating perhaps more short-term bounce, but analytical storm clouds gathering for a significant correction. [bounce continued, but new Fed/Treasury-related analysis hits these pages, see below]
Global Stocks (bull market)
Not a refuge if US stocks correct. Indeed, if USD firms, it could weaken global relative to US. [new macro analysis may feature weak USD, which could prompt global outperformance]
L/T US Treasury Bonds (bear market)
Bonds need to hold here as TLT tests its pattern top. If L/T Treasuries break down, it could force reevaluation of our near-term themes. [unchanged]
Commodities/Resources (bull market)
Not time yet to position with any conviction, in my opinion, as the Fed plays hawk and market liquidity is constrained. [unchanged]
US Dollar (cyclical bear market, L/T still a technical bull market)
[A bearish USD was a feature of 2003-2007, which is an emerging blueprint. The bear cycle needs to break that bull for a real anti-USD inflation trade. A small echo of 2003-2007 could happen if USD slips its channel and drops to 90, while not losing the post-2008 bull.]
#923 will hammer the macro and leave stock talk for next week because, while I am starting the report early (Friday afternoon into Saturday morning), I will be away for much of the weekend. I want to get the important stuff down before I go. The “top-down” macro stuff.
Getting to Know the Warsh Fed
This chart from MacroMicro, a service I subscribe to for a wide pallet of global macro data and analysis, shows a graph of Fed Hawkish/Dovish policy stance over time. This is done by an AI robot scanning for key words in Fed statements over time. As you can see, the Fed has been firm into recessions and then flipped dovish like the “too late” reactionary bunch of eggheads they are, or were.
It was particularly frustrating when you’d hear one egghead in the media making a dovish speech followed up by another making a hawkish pronouncement. With the market reacting based on these ruminations. They managed expectations way too often, and created needless volatility in the markets.
You can picture the chart as having brought us to the current moment. But with Warsh stating that the Fed will be less of a blabber mouth about every little concern or message its members may have (a change that I agree with), this is not your grandpa’s Fed. It’s the Warsh Fed. It will apparently not feature the all too annoying and constant jawboning of the past.
Warsh’s Fed will apparently be a little more shadowy, and that is a good thing, because it will allow us to manage by using our tools and assume the Fed sees some version of what we see, without dissonance emanating from its orifice every week.

It will be important to get to know the “Warsh Fed” as quickly as possible for how it will operate.
So I looked closer at the Fed last week in order to back up or refute my claim that the Fed is “pretending” to be hawkish and will find a way to bring liquidity to markets and the economy this contentious election year. Because of course they will try. I expect Warsh to work with Bessent much as we chronicled Powell working with Yellen in 2024 in a failed attempt to keep the Biden/Harris admin in power.
But how will they do it? In 2024 it was fiscal spending/stimulus and a dovish Fed cutting the Funds Rate. This after Yellen’s robo-messaging about “transitory inflation” to anyone who would listen in 2021-2022. Unfortunately, “too late” Powell listened until it was… too late (to effectively fight the inflation). My point is that Fed and Treasury work together because, of course they do.
Had a Republican been in office, had Yellen been Fed chief, and had the inflation been in play to the degree it was in 2021, she’d have been Hawking to beat the band.
But today we have entirely different animals. Warsh is no Powell (nor anyone who came before). Bessent is certainly no Yellen. It’s a different macro now and from what I can dig up, things are indeed going to be different at Fed and Treasury.
But one thing will likely be the same; the bottom line goal is to support the administration in power. “The Fed does not play politics”… that’s a laugh. The Treasury sure does. It is part of the administration, and it operates in a seamless relationship with the Fed.
My oft-noted assertion is that inflation has not driven prices higher lately, but instead human action (war) has. Either way, prices went higher and the Fed is talking about how it will combat “inflation” while at the same time supporting the economy. Hmmm, tough act by the Fed’s historical standards.
However, Warsh is a different cat. He is throwing the old ways of doing business, based on old metrics – and frankly the “old macro” – in the garbage and building his framework for today’s macro, his macro. Not Greenspan’s. Not Bernanke’s, Yellen’s or Powell’s. His. On the face of it, I respect this.
What I don’t respect is the $39T (and growing) in public debt and the fact that this debt needs to be manipulated, managed, increased and sold to the public as something normal. Like, the way normal business is done. So let’s tap the breaks on the Warsh adoration and simply note that he’s a different sort. In unison with Bessent, I think they are more deep thinking sorts. Conniving, even. But they’ll jigger that same pile of debt one way or another to desired ends.
They are not here to do the theoretical right thing, which would be to set us back on a righteous path of productivity and prudence. Ha ha, Gary, good one. No, they will rig the macro in a favorable way to their political persuasion. And that means inflation as the result, over time.
Meanwhile, we need to figure out how this Fed will operate, and I’d like to begin that task this weekend. It’ll obviously be important to our market management in the coming weeks, months and years.
Some Mechanics
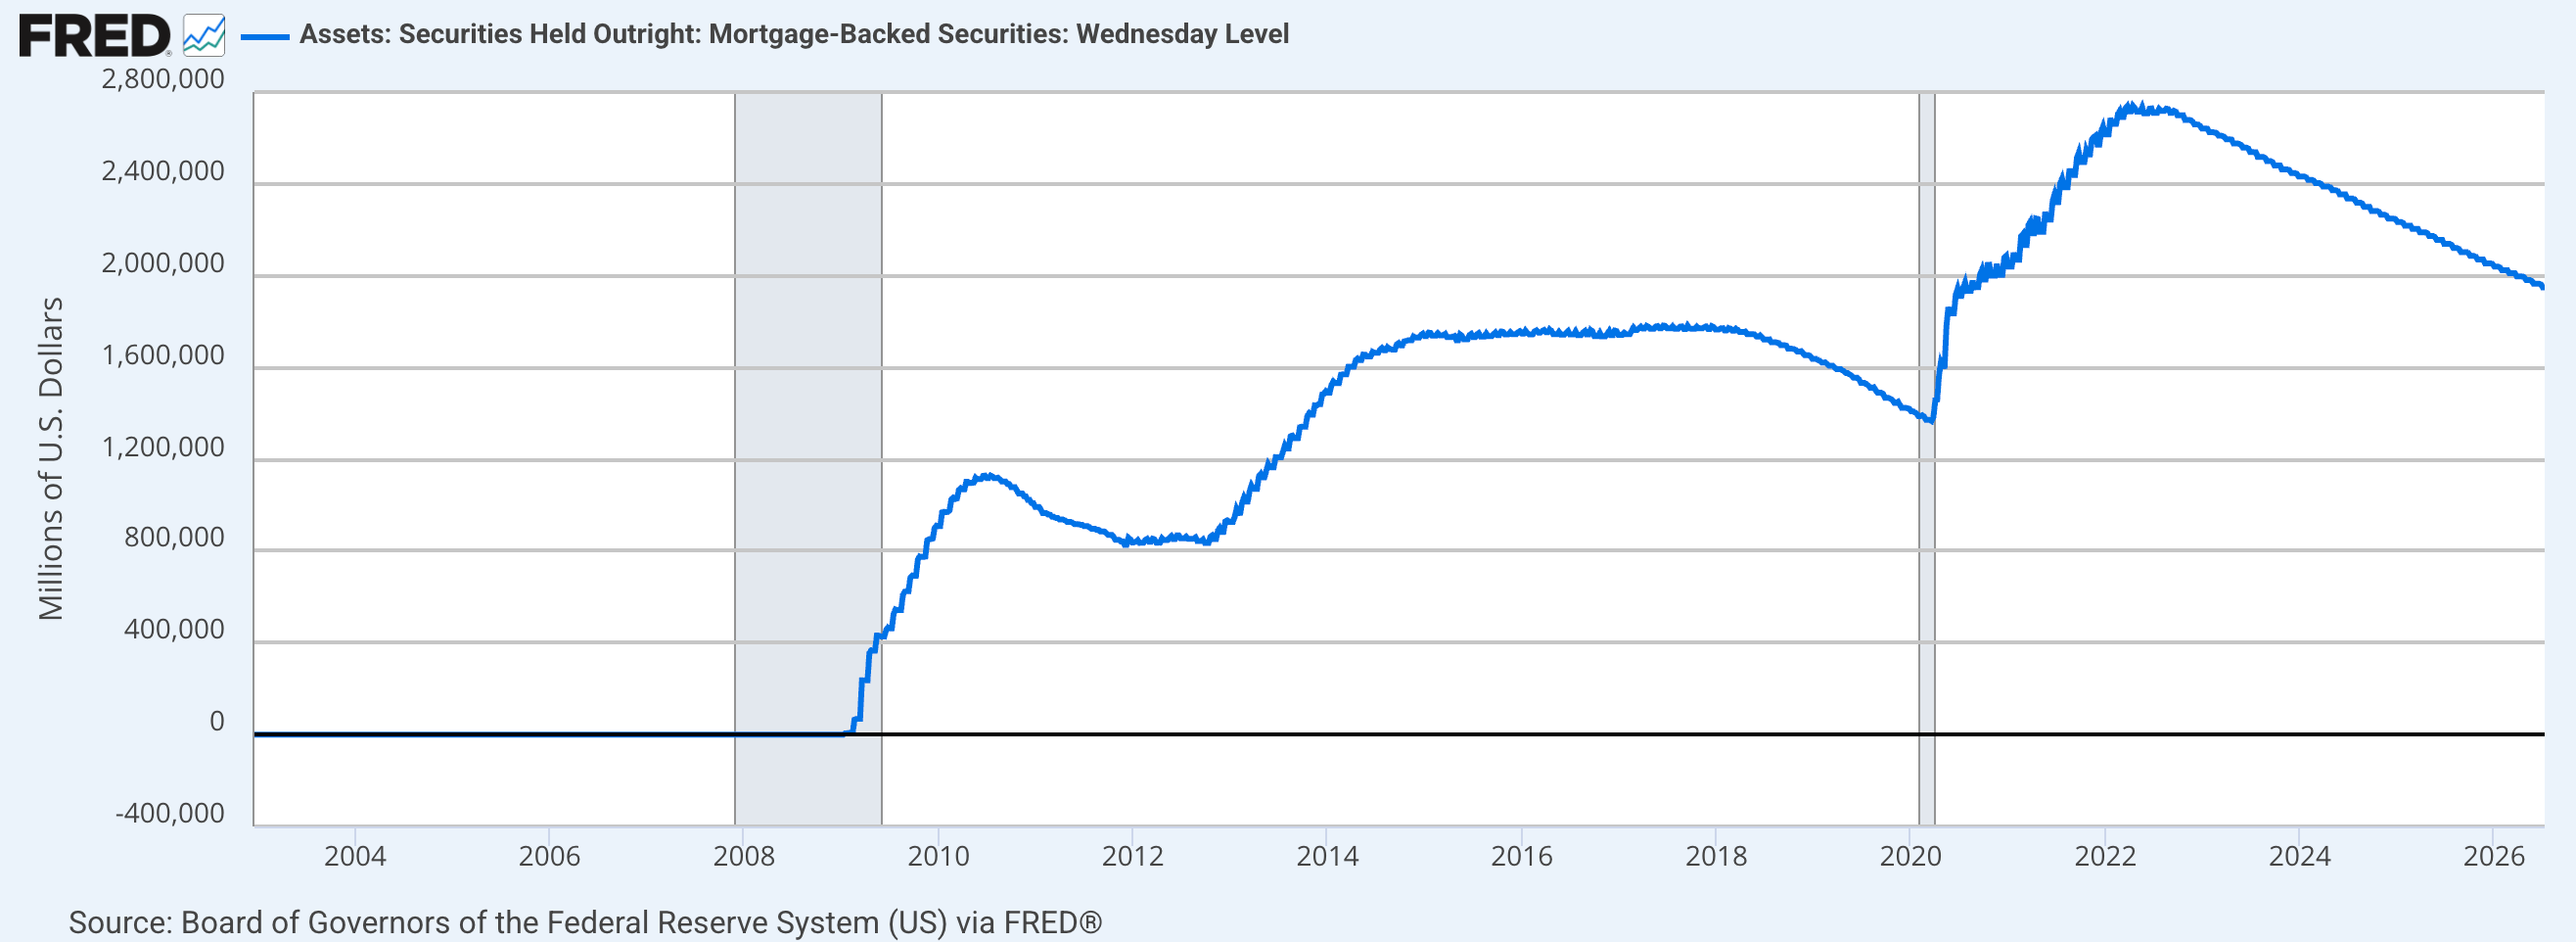
First off, as announced in December, the Fed was and still is letting Mortgage backed securities run off the balance sheet. No surprise here.
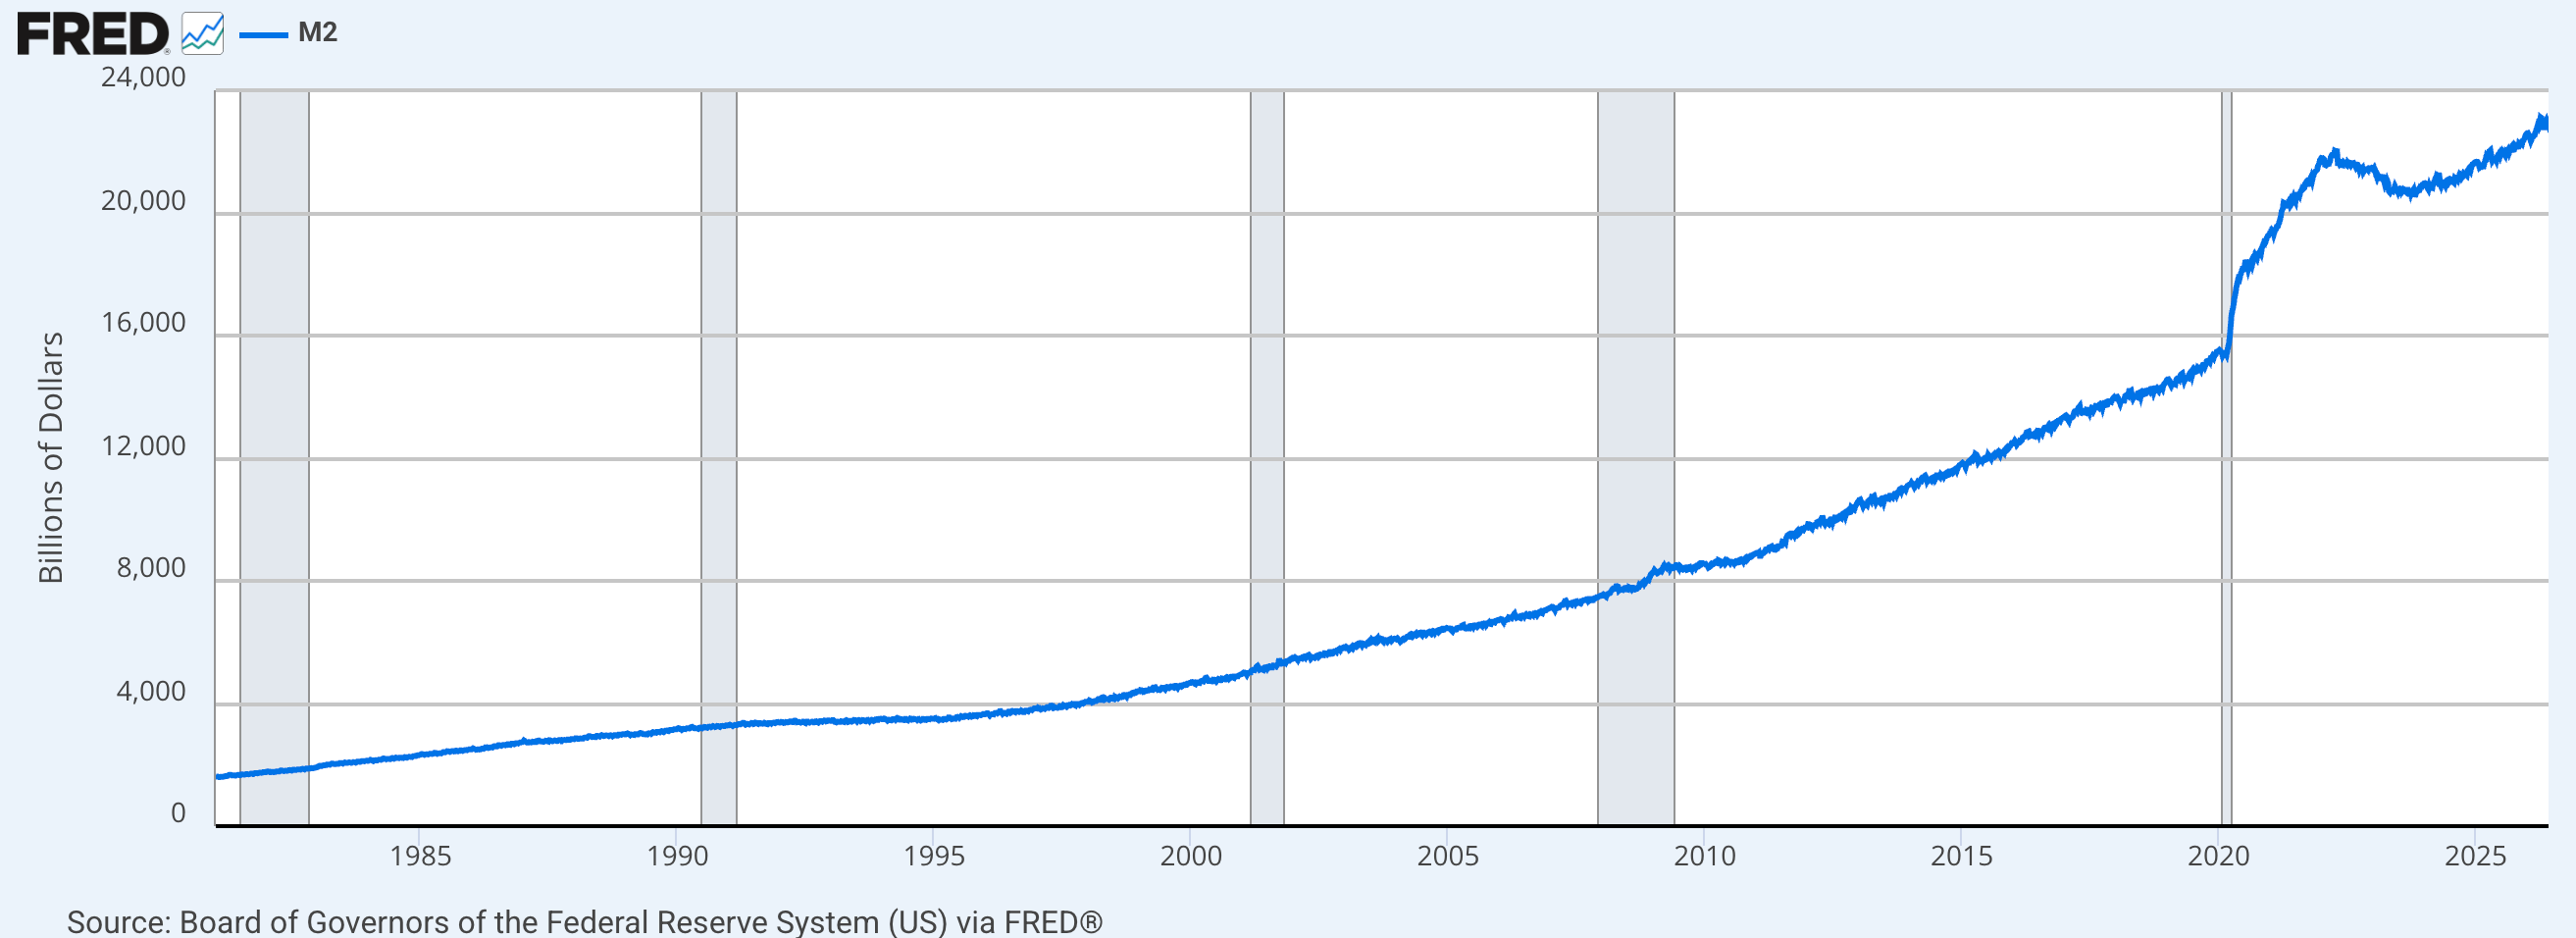
Money supply is rising, as always in the current system.
It’s where that money and the liquidity it implies come from and how it is engineered that we need to figure out. The Fed is not reducing its Treasury holdings, however. Indeed, these holdings are increasing. That’s a hint of traditional QE, when only looking at Treasuries.

And they can continue to increase T bond holdings since percentage-based readings like this show levels to be low relative to the debt-rigged GDP. If it’s confusing to you, you are not alone. But work with me here. We’re in Wonderland, remember. I believe that the visuals need to be made to look good, primarily. This chart says that while the debt is at nose-bleed levels, the Fed stands ready to hold more of it on its balance sheet. Why, look at all that headroom in percentages they have to play with!

In my opinion neither government nor Fed worry about the total debt of $39T. As long as sound proportions (like the above) are maintained. If you suspend disbelief that a nation can extrapolate nominal debt forever into the future, it works in Wonderland.
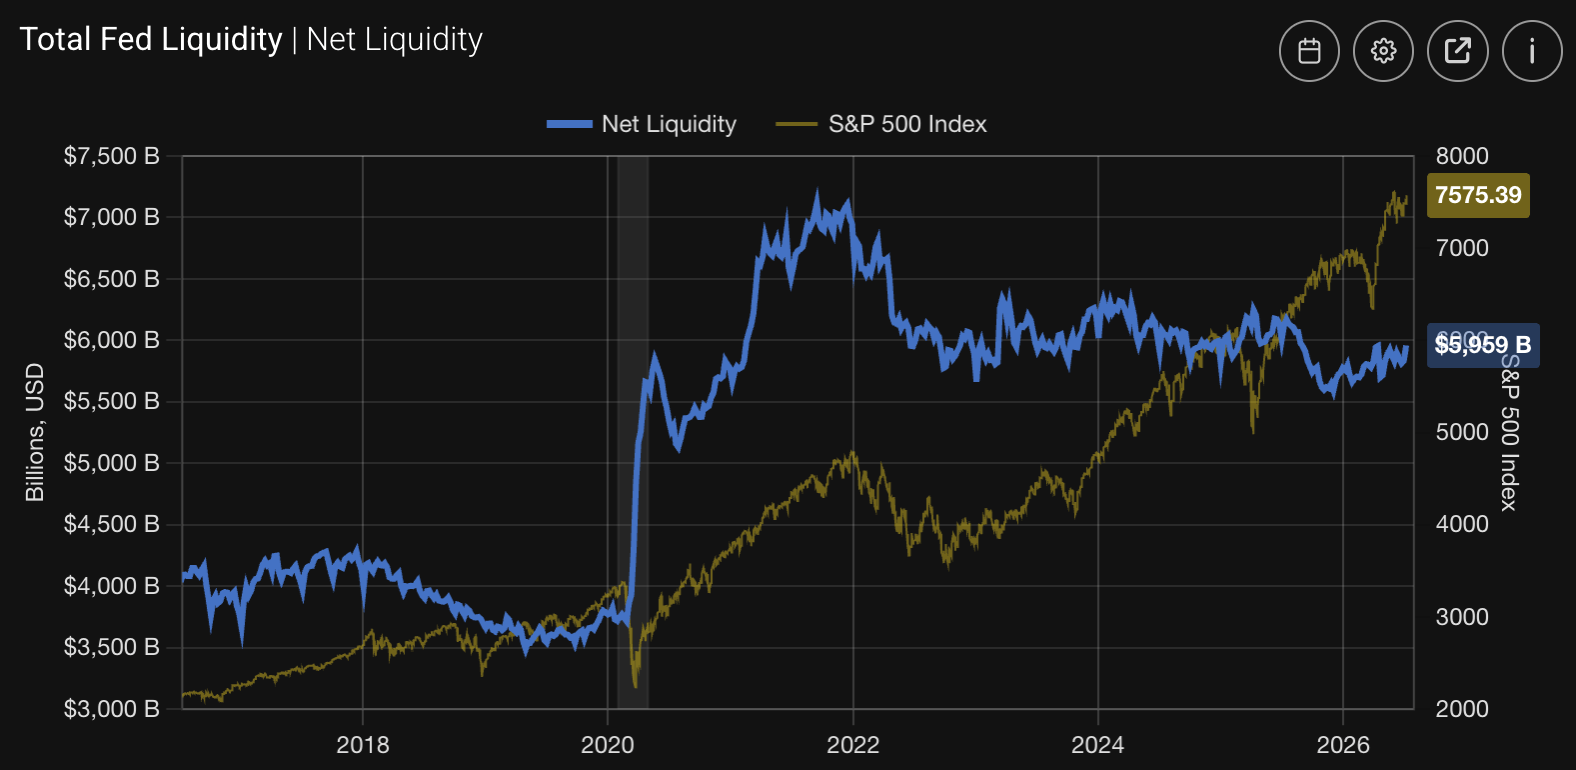
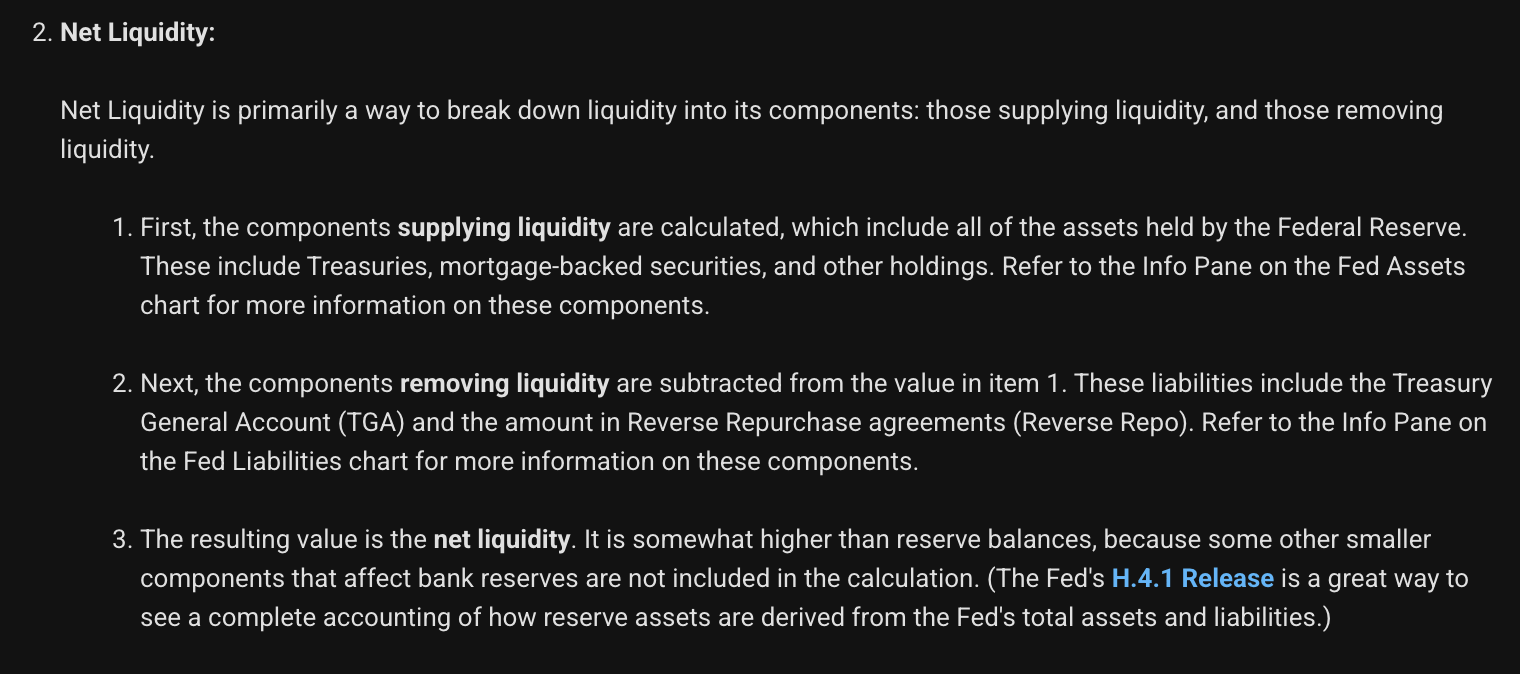
Finally, a look at Fed Net Liquidity. The drain of MBS shown above is obviously at work here, among other things. Whatever its total components (see info below the chart), it is currently not a high liquidity situation right now. QE is not in effect.
The Solution? De-reg, Baby!
Another primary tool that could come in very handy for the new Fed in the new macro is bank deregulation. Here, Northern Trust discusses just that, after a speech by Fed vice-chair Michelle Bowman.
A new generation of Federal Reserve leadership is open to easing some of the regulatory burden. Vice Chair for Supervision Michelle Bowman has laid out a plan to modify the “four pillars” of bank capital: stress testing, leverage ratios, risk-based capital requirements, and the surcharge for systemically important banks. In recent comments directly addressing the rise of private lending, Governor Bowman proposed a reduction in capital requirements for lower-risk corporate loans.
Advocacy is most prominent from the Federal Reserve, as private credit has grown far more in the U.S. than in any other market. Banks have better retained their lending market share in other developed markets. Regulators abroad have presented more obstacles for non-bank financial intermediaries, and banks have been more willing to work with higher-risk borrowers; in the U.S., banks are less capable of taking larger credit risks.
Reforms will extend beyond credit. Under Bowman’s direction, bank examiners will apply a higher standard for formal notifications of bank shortcomings. Significant regulatory findings will only be raised where they present clear risk to a bank’s financial condition. She is also advocating to reform the accounting standards to calculate reserves for loan losses. Pressure from the Fed may clear the way to ease these rules, which have been most burdensome for smaller banks.
In other words, bye bye Dodd-Frank. Through the unfettered excesses that built up in the banking system, lax regulation brought us the disaster of Armageddon ’08, my term for the “great financial crisis” of the time. But before that it underpinned a whole hell of a lot of market and economic liquidity (and excessive, misallocation of resources and well, grift).
Gold led, silver caught on, oil, uranium, copper, China, EM, etc… the “inflation trades” of the time, against the developing credit bubble in the US. This was the result of banks not only free to create MBS, but to create them and other suspect “financial vehicles” to sell to the public, booking the gains ASAP and kicking the Black Swan disaster can down the road. Finally, in 2007-2008 something broke, and the whole mess imploded.
But if you actively fought the system as a bear from 2003 to 2007 when the mess liquidated you were not around to enjoy the crash. If you played it, and got out in time, you made a lot of money.
This is the door the Fed is hinting to step through. Will they be able to relieve the pressure just enough so that sound commerce does not devolve into the wild west of excess that resolved in 2008? Maybe. But human nature being what it is, once the door is cracked open and all that money is at stake, might we not envision some time down the road another disaster? I might.
It’s genius, really. Deregulate, and do it before the mid-terms, I assume the deregulationists would aim for. Time is of the essence. This policy could also sustain or enhance the bull into the next presidential election as well. If the blueprint is indeed 2003-2007 (here let’s remember I am just presenting theories for consideration and refinement), the theoretical fallout to the theoretical plan may not come until after the presidential election.
Longer-term, I don’t see much to dissuade from a high risk view, with human nature and greed being what they are (and were in 2003-2008). Agree with Dodd-Frank or not, it was put in place for a reason. Removing it could echo that previous phase. It’s been [edit: 16 years] of Dodd-Frank. That’s enough time for enough people to have forgotten the lessons of why it was enacted to begin with.
As a side note, whom do you suppose could pick up the slack in the mortgage market as the Fed unloads MBS? A deregulated banking industry, perhaps? This time promising not to repeat the excesses of the past. On their honor! <sarcasm>
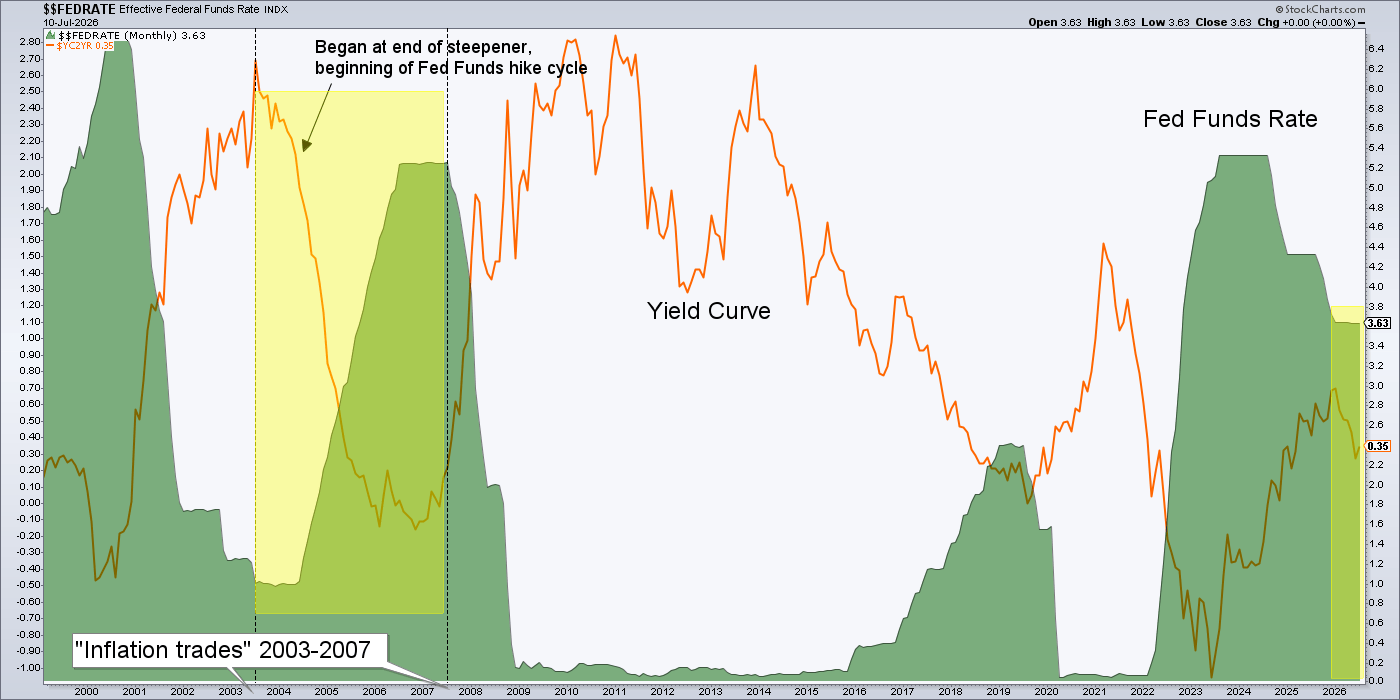
So we can look at our squiggly graphs, see the Fed adding Treasury bonds, selling MBS, holding the Funds rate, etc. But you’d better believe the goal is to find liquidity, if not real growth in a new way of doing things. The state of the yield curve continues a move toward flattening, which implies long-term Treasury bonds are being bought more/sold less than short-term bonds lately. It implies a policy-firm Fed. This began in February before the coming of Warsh and has extended with him.
The curve is well above inversion (which is below 0), but in the near-term it is gently flattening, Goldilocks style. That is disinflationary signaling. When the curve steepens again it will do so under either inflationary pressure or deflationary pressure. Or both at varying times.
If they are engineering some kind of Operation Twist, they could hammer the curve into flattening, showing a “just right” atmosphere with respect to inflation signals from the official sector. In the post-Dodd/Frank macro that would be a death sentence for the gold price.
However, during pre-Dodd period from 2003 to 2006, who again was doing the inflationary heavy lifting? Why, it was the banks, perpetrators of the credit bubble. Back then they were much freer to lend at lower standards for short-term economic and market gains. Not to mention inflationary gains.

I am not a bond market or Fed expert by any means, so I cannot say with any authority exactly how the flattening is being managed (nor do I have the time or inclination to go looking). But the yield curve implies an ongoing targeting of inflation signals. The USD would likely continue to firm, a negative for precious metals and commodities.
A flattening yield curve is a sign of disinflationary signaling. It’s as we’ve been discussing all along, before the war got in there and messed with many inflation signals. Yet the curve has been consistent for all of 2026. An interim disinflationary flattening, as anticipated.
If it goes on a “Twist”-like mega flattener we may prepare to abandon the inflation trades and amp up US stock/sector selection. However, using the 2003-2007 analog, not so fast!
Currently, CME Group sees an 85% chance of the Fed Funds Rate increasing by at least .25% by year end. Of those traders, nearly 50% see hikes of .5%.
So, work with me here. If we see the green area below start to increase from this trough, while the yield curve flattens, while a ‘de’ or less regulated banking sector does the heavy inflationary lifting, might we have an echo of 2003-2007? We might.
Given that it would not be starting from the depths of a cyclical bear market and the yield curve would flatten from a much lower level, let’s prepare for an “echo”, not a full-on wild west style inflation trade like that long-ago phase. But maybe it could take root into the mid-terms and just maybe extend to the presidential?
Bottom Line
I am trying to get to know two people, Warsh & Bessent, through the bond market and Fed policy. Something about them strikes me as highly intelligent, and diabolical. I believe they’ve politely told Trump to “STFU about the Fed Funds Rate and let us do our thing”.
Much of the above is theory and I want it to be open to criticism. Frankly, it looks all too logical to me and if you’ve got some refutable input, please do share.
We are developing a theme where they will hide the cheese. But it will not be hidden on the Fed’s balance sheet. It’s…

…to a time when the Fed was not the central figure of the inflated economy. The commercial banks were.
There is headroom for the Fed to buy Treasury bonds. That is supportive of markets and the economy. If done the right way, it reduces inflation signals. While at the same time they reduce MBS holdings. As a cherry on top, a massive banking industry will likely be set free of Dodd-Frank and while this will probably ultimately fuel the next inflation problem (ref. the 2003-2008), it will also sow the seeds of the next real deflationary market/economic crash (ref. 2008).
Meanwhile, and it could be a measured in months to a couple years… boys?

I feel I am well off the beaten path of our usual analysis. Does the above make sense? It sure does to me. It’s a “new macro” as we’ve been noting since 2022’s bond market rebellion. Now we have a new Fed chief with new operating plans. I look forward to fleshing this out in the coming months and years.
Theoretically, the plan could include excellent profit-making opportunity, and as in 2008, eventually epic liquidation and crash opportunity when someone goes too far and tips the debt-leveraged edifice into the next recession/depression.
US Dollar Index (DXY)
So what could go wrong with the plan noted above? The 2003-2007 phase featured a bull-ending decline by the US dollar. If that does not occur this time, much of the work above could be altered or scrapped. Especially the precious metals and inflation trades.
This will be a very important item to watch going forward. USD will need to lose the channel at least, in order to spring an echo of 2003-2007. Silver would also need to eventually wrangle leadership from gold. But the Fed, if it holds firm on the Funds Rate, would be pretending to defend the dollar.
USD remains in a bull market from 2008. It would have to break down from that bull market channel and make a lower low at 90 to break the bull. As you can see, Uncle Buck looks like a buy, not a sell. Of course charts are made to be broken. But this one is not broken.
So it gets tricky, folks. Week-to-week is the way I plan to analyze it. A narrative will emerge.
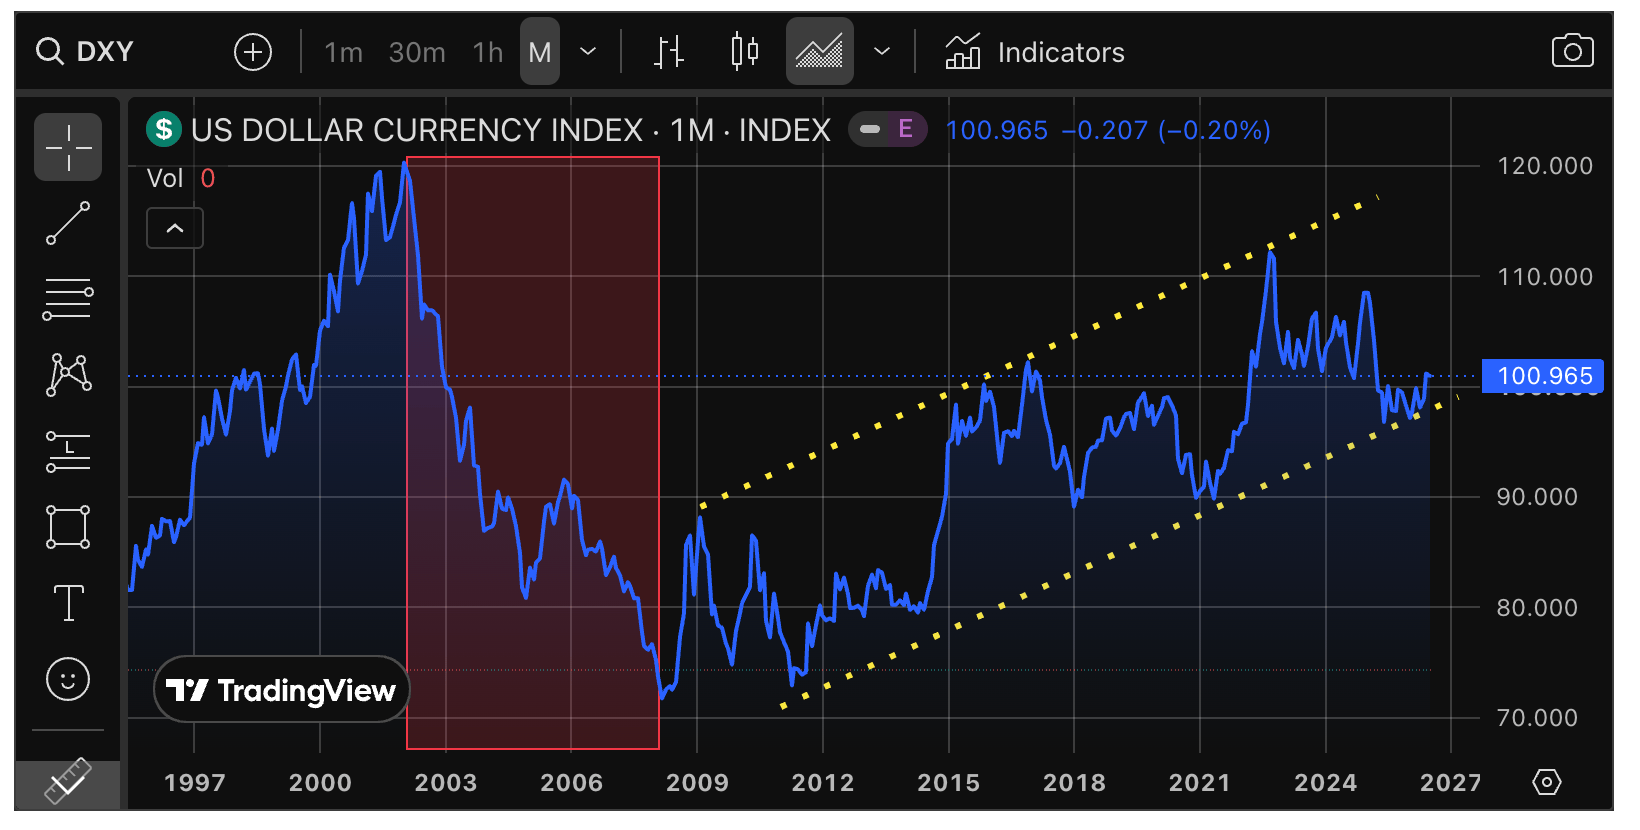
An echo of 2003-2007, which would likely be more compact and maybe less pronounced, could theoretically play out with a drop to 90. Maybe that’s all we’d be looking for. But first, the trend channel. Eh? That is a would-be trigger to a widespread bull/inflation trade and reflation, 2003-2007 style.
Markets
The above is a long way of saying that summer correction or not, our original theme of a Fed-engineered bullish environment into/through the November elections remains in main play.
I still want to be careful about getting precious metals-centric, despite what looks like a low potentially being hammered out in the Gold/SPX ratio. Looks like, not yet “is”. That is simply because the Fed is at the controls of the Treasury bond market and thus, is at the controls of macro liquidity machinery and the signals produced by whatever bond market manipulation may be in play.
An Operation Twist style Goldilocks? Not theoretically gold-bullish. In other words, a flattening yield curve is not usually positive for gold or the precious metals. Or commodities, for that matter. But the curve is still above inversion levels, and above we have presented a historical view of gold followed by the inflation trades going bullish during a curve flattener. This is where the commercial banking system would come into play, if freed from its shackles.
If we’re on a perhaps more compact version of the 2003-2008 blueprint (and I’m only spitballin’ as yet) gold did rise with the inflation stuff. But as then, we’d expect silver and many commodities to rise even better. But first, we’re in that interim disinflationary time pocket.
So personally, it is going to continue to be a plan of diversity until particular indications and timing become clearer. I’ve got healthy cash levels now. But I’ll put more of it in the market if/when we clear the summer correction view.
Here is SPX (daily) looking bullish but in need of volume.

The SOX>NDX>SPX leadership chain, while intact, also looks somewhat suspect, potentially bear flagging.

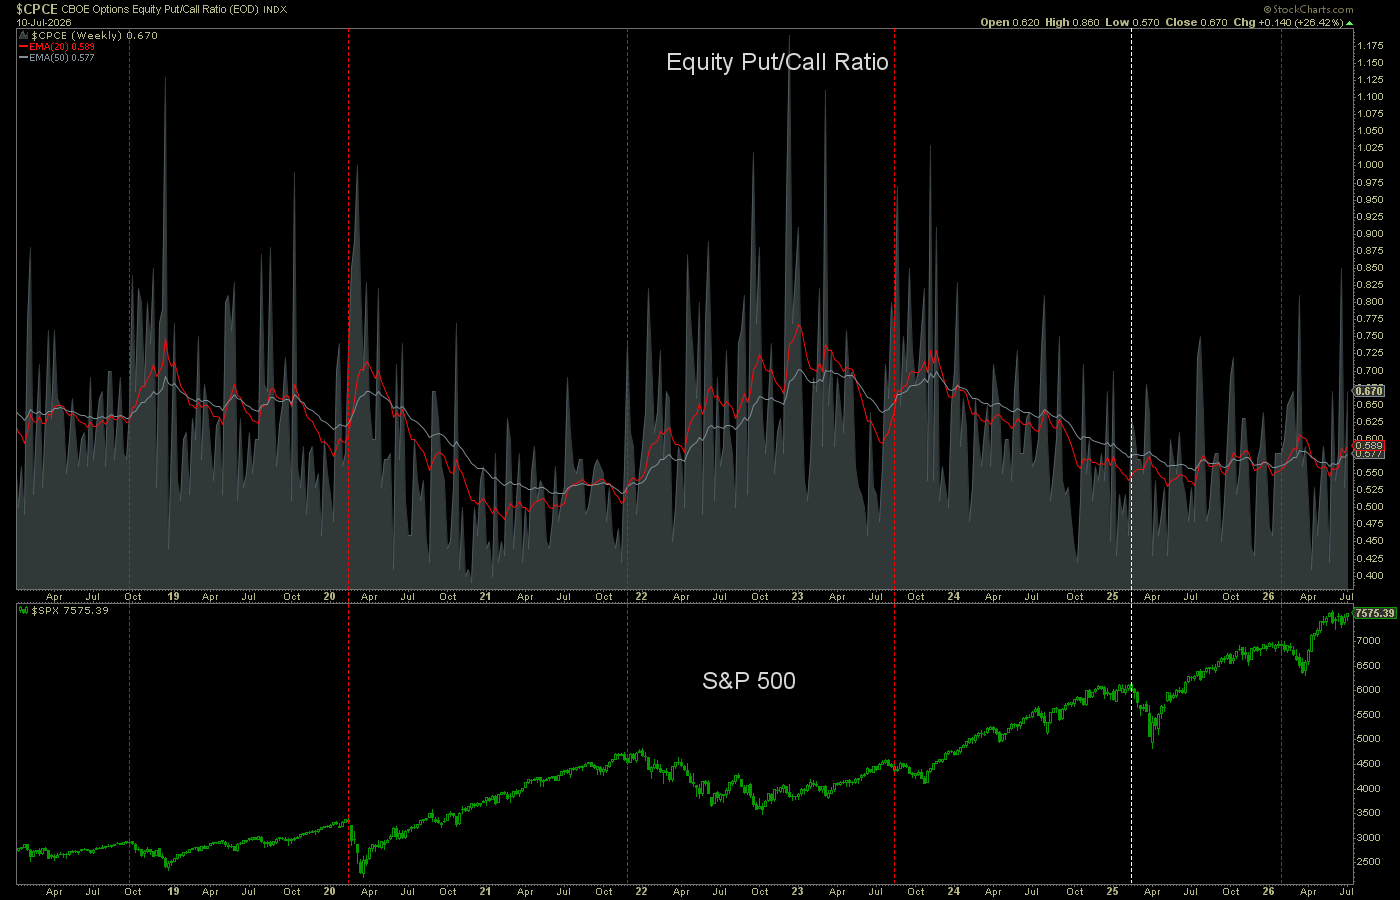
Worse yet, the Equity Put/Call ratio continues to flash the warning we noted last week with the red EMA 20 above the grey EMA 50. Based on the history of this chart all but one market correction quickly followed such a signal.
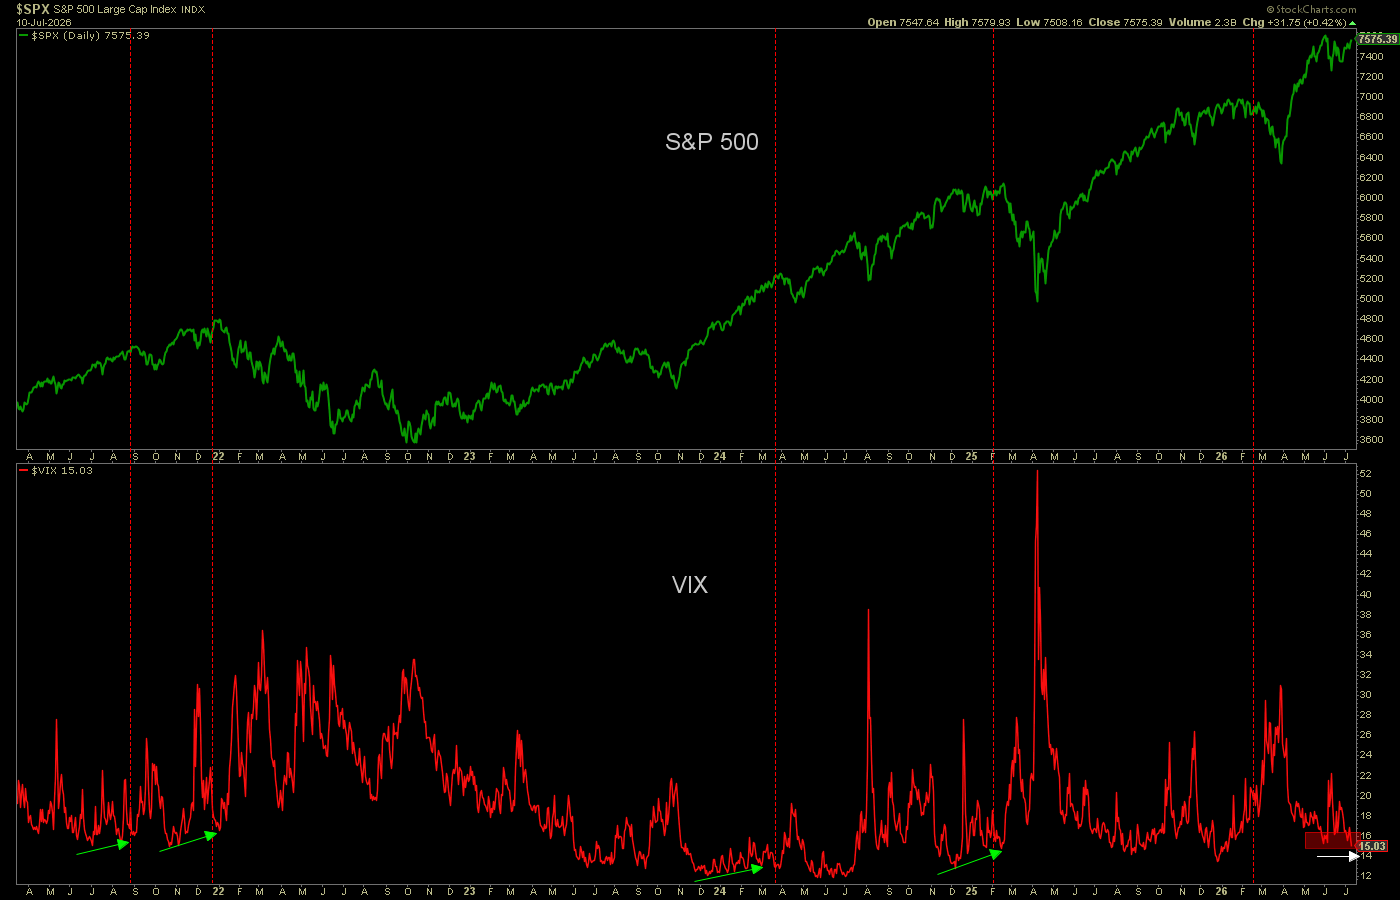
Yet the bulls will counter with ‘yeah, but what happened to your VIX divergence smart guy?’ to which I’d answer simply, it went away.
SPX A/D line, at new highs, is a bullish divergence to the index.

Sentiment
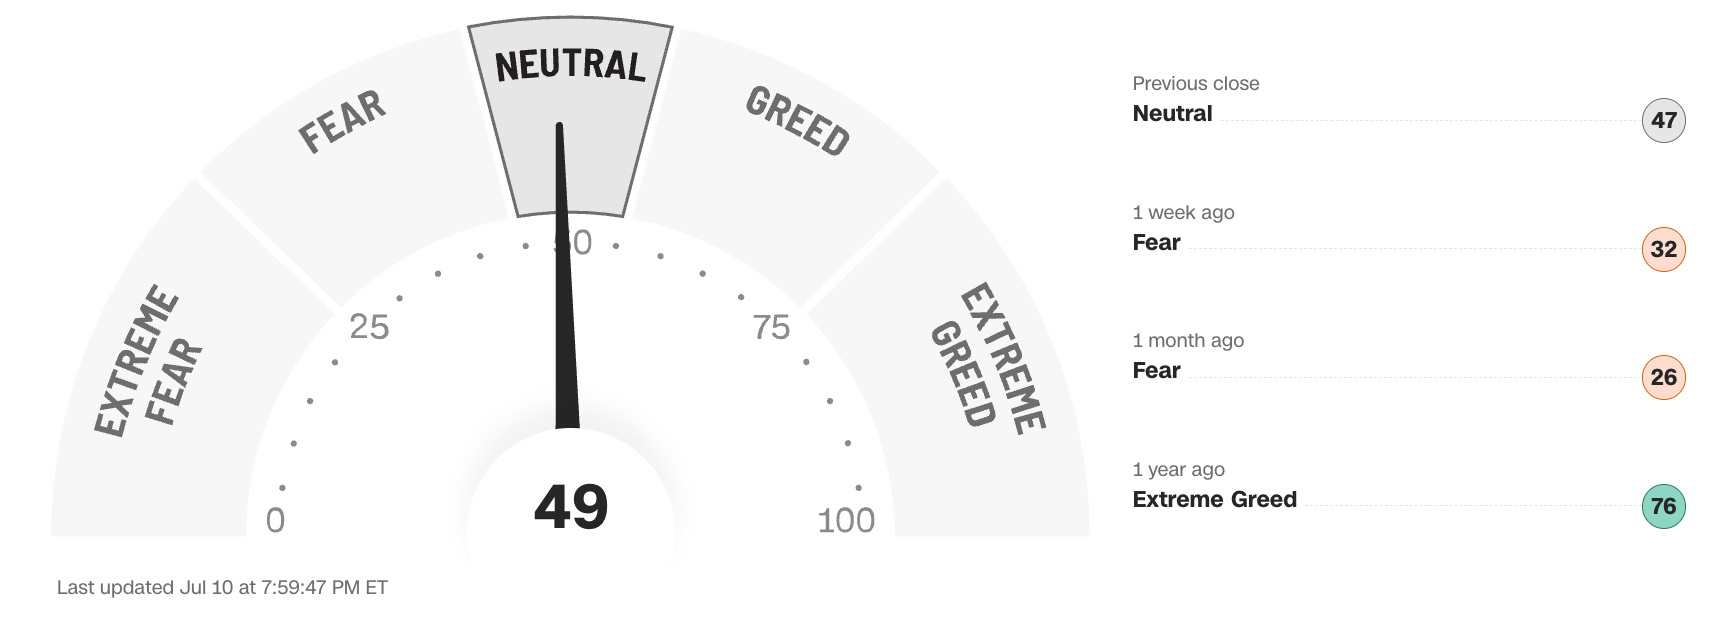
The Fear/Greed index is vanilla as it can get. Its components are a mishmash of inconclusive signaling.
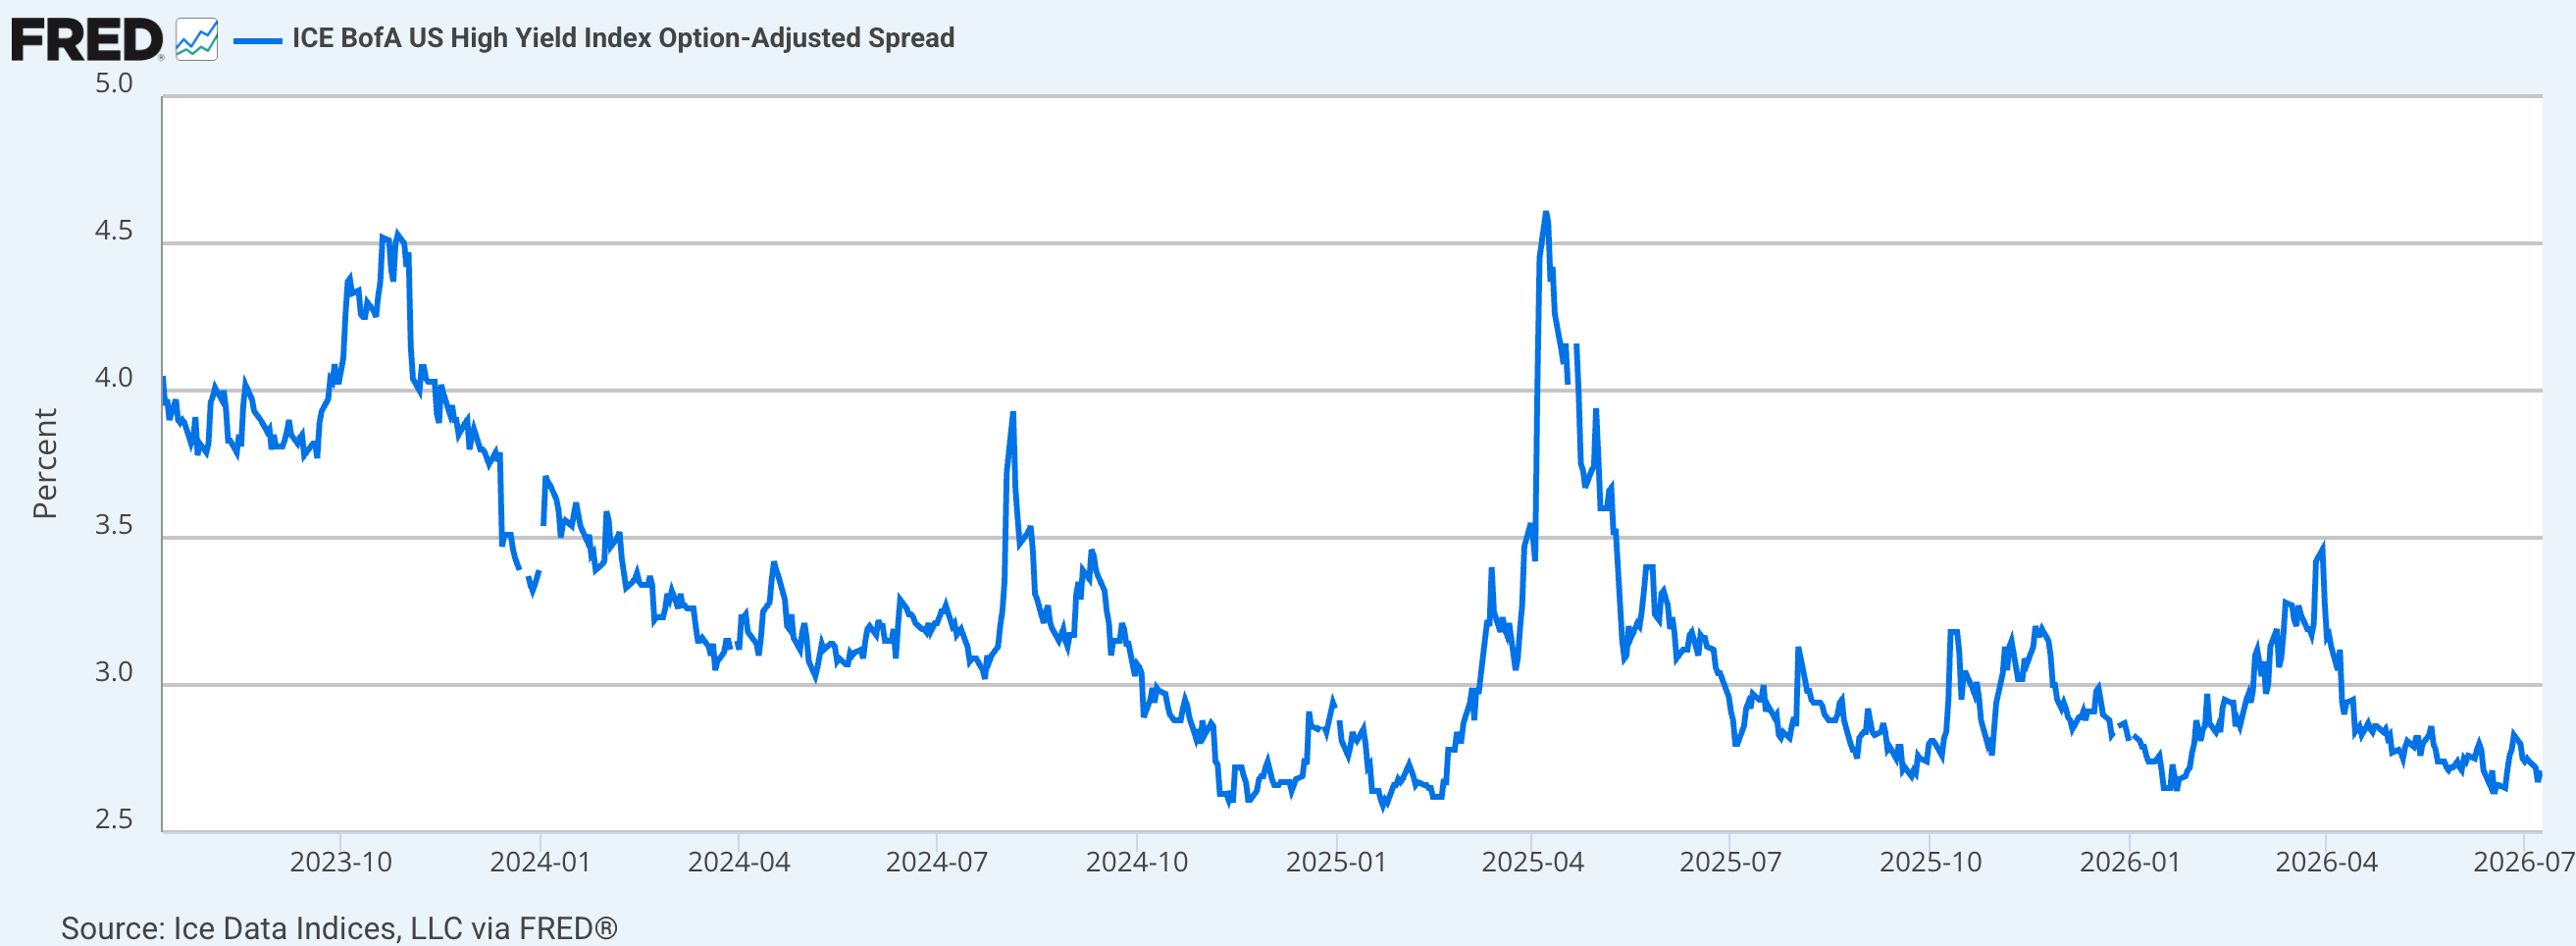
However, Junk Bond spreads are even more sedate and risk-on than they were last week. So there is no negative divergence developing here. Indeed, with projected banking regulation easing, I believe they will attempt to build in a permanent anti-risk safety net through relaxed regs. Of course, nothing is permanent. But they will try, and probably succeed for some period.
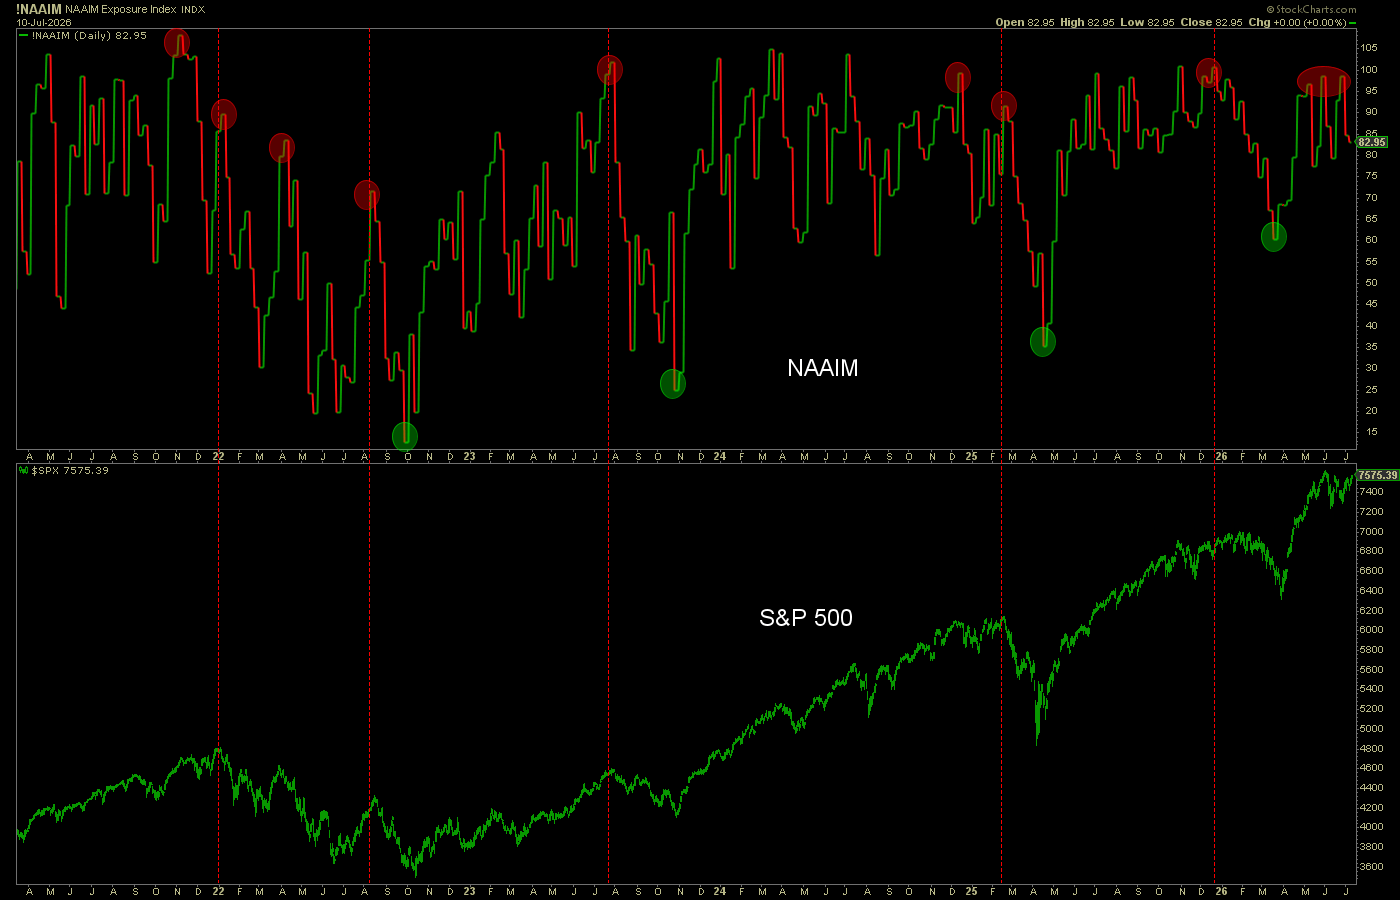
NAAIM (investment managers) got spooked again last week. This is the kind of twitchy behavior that the market inches upward against. As per the Fear/Greed reading, it’s a mushy middle ground at 83% bullish.
AAII (individual investors) is also in the mud with signaling that does not need a chart. It’s meh, not bullish, not bearish at 36% bulls, 37% bears and the rest in the mushy middle.
Bottom Line
When taking into account the the SOX>NDX>SPX leadership chain, the Equity Put/Call ratio, the face-planted VIX and the charts in this segment, the picture is of risk aplenty. But risk rides with a bull market. That’s just the way it is. Sometimes interim negative eruptions (what I call sentiment twitches) pull the bull back to refresh it. But price is price and risk has nothing to do with that… until one day it does.
It is a good idea to resist watching the YouTube videos harvesting frightened eyeballs about how big the imminent crash is going to be. The biggest yet! Well, typically these people, well meaning and promotional alike, are wrong. For the bear/crash promoters, that is their industry in the internet age. They are the guys you go to when you want to utterly shit your pants about the doom that is just around the corner.
The market is at risk. The market is bullish. What’s more, as the work done in the opening segment indicates, there are initiatives in play to keep it that way. I believe that is little more than kicking the can down the road. But the last time we had a deregulated banking system the can got kicked from 2003 to 2008. If today is 2003, then there’ll be a lot of bull before the crash, though I doubt anywhere near 4 years worth.
Precious Metals
Let’s start with MacroMicro’s graph of the gold price vs. gold fundamentals.


Funda down, gold price down. As it should be.
But we are at a potential pivot point in the Gold/SPX ratio. That’s a lot of de-risking that’s gone on in the precious metals.

And as a low priority consideration, the seasonal is right as well. Both nominal and SPX-adjusted gold bottom now, on average.

Gold (daily) is trying to turn up from a minor support area after becoming sufficiently oversold by RSI, which is now also on a positive divergence to the most recent short-term low. We are anticipating a bounce. To make it more than a bounce gold will need to clear the death-crossed moving averages (which of course add to the bounce prospect).

Silver would probably make a hard, table-pounding ‘buy’ low if it would just let go and hammer the 50 +/- (preferably sub-50) area. But if gold is going to bounce, silver probably would too. I still expect the ultimate low to come with such a test. But a bounce is possible, if not likely first. Any such time that takes out thick resistance and the moving averages, we’d want to be strapped on board the silver bullet.

HUI holds the wedge and support. Still anticipating a bounce after last week’s volatility.

Monthly HUI has Fib-retraced nearly 50% of the entire rally from the low of the last correction. Can it go lower into the major support zone? Yes. Will it? Eventually, I think so (subject to revision on incoming info). Is risk/reward a million times better than January? Oh yes.

Final Thought
It’s a busy weekend for me, and by hogging the space above, Fed-focused macro work is the main theme this week. I wanted to really start to tune in on the top-down macro so we can better invest, trade, divest, short and/or avoid certain areas accordingly.
It struck me that I needed to look closer at this new Fed. Finding the potential roll-back of Dodd Frank was the thing that hit me over the head and guided me to the 2003-2007 time frame for more clues.
I don’t have time this week for the Portfolios segment. But there are no great changes. Ample cash/Treasury bonds, a few Software stocks, Biotech stocks, Medical Device, Big Tech, an alternative Energy stock, a Gas stock, a couple Copper stocks, Weed stocks and of course Gold/Silver stocks. Everything in balance and moderation at this time. My eye always on Uranium and Rare Earth.
This weekend was my one important social engagement of the summer. The next snag will be around August 2nd when we finally move into our new, downsized home. I don’t expect much upset there, although that week’s report may be abbreviated to a degree.
Finally, I am flat out excited to manage what I think is unfolding now. It holds the potential to catch a lot of people by surprise. Of course, it could also catch me and some readers by surprise if I am flat out wrong in what I am seeing ahead. That’s why I’ve asked for your feedback.
I don’t think too many other rags out there are doing this kind of work. This is grinding stuff. It’s not me telling you why gold is going to $10k (which I think it eventually is) or why risk markets are going to crash (not yet, I don’t think). This is not work that titillates or harvests eyeballs. It just needs to be done and then it needs to be enhanced, firmed up or even refuted as needed. Onward…
Cash & income-generating Treasury bonds are at levels that are right for me and my real-world situation. Your situation is different. Cash will be adjusted as needed.
Refer to the In-Week Notes under the NFTRH Premium menu at nftrh.com for market talk and occasional trading info, if interested. Also, you can follow on X @NFTRHgt for notice of updates.
NFTRH is not to be distributed to third parties without prior written consent
Notes From the Rabbit Hole (NFTRH) is a weekly market report in which we provide analysis on financial markets. We make every effort to provide accurate and high quality content, but this analysis ultimately represents our opinions and these opinions are provided without warranty or guarantee of any kind. See full terms & conditions of service under the ‘About’ heading in the main menu.

One of your best ones, Gary! Thanks!
Thanks, Jess. I just felt we needed to try to get a handle on the foundation before building more narrative.
I edited a mistake I made in my 4th grade math. It’s been about 16 years of Dodd-Frank.