

Summary
A brief summary of the work done in this week’s report and in the updates and reports leading up to this point. Please read the detailed report for the complete picture. There are many granular details that cannot be summarized so briefly.
Precious Metals (bull market)
Sector in bottoming mode. Correction still technically in force.
US Stock Market (bull market)
Market is fanning out to include more areas. In other words, breadth is broadening, which is bullish. Short-term sentiment is supportive of rally activity.
Global Stocks (bull market)
ACWX/SPY ratio is still at support. An end to this phase of the Iran conflict could ease the Gold/Silver ratio and USD, which would be helpful in allowing global to hold serve and turn back up vs. US.
L/T US Treasury Bonds (bear market)
No sign of an interim bond rally yet. Indeed, strong Payrolls drove yields up and other markets down on Friday. An interim bond rally is not off the table, however, if markets correct, inflation expectations ease and Treasury bonds revert temporarily to “safe” haven status. [unchanged, but an end to the Iran conflict would be helpful and the long-term Treasury fund is in a bullish looking short-term pattern]

Commodities/Resources (bull market)
Watching USD and Gold/Silver ratio as usual. If these weaken, this area of the market could perform quite well.
US Dollar (cyclical bear market, L/T still a technical bull market)
USD has not broken upward from its base. Gold/Silver ratio is still neutral. If these two weaken, a world of assets likely goes bullish. If not, it likely will not.
My daughter is in the hospital for something that is far from routine, but for which we hope for a favorable outcome. Friday and this weekend are consumed with that so that my wife and I can be present during every step of the diagnostic and care process. NFTRH 919 will get right down to business, and leave some of my side detours and opinions aside.
Bottoming
“Bottoming”, not “bottomed”. Frankly, my main concern for GDX and components like NEM, AEM, WPM, etc. is that we have not had an obvious capitulation event. A final puke on big time volume, that usually signifies a wash out in sentiment and weak players.
While the sector has declined to valid bottom areas, technically, it was without capitulation. Does a capitulation event necessarily need to happen? Not necessarily (see below). But it would be preferable to feel the drama and terror that hits investors right in the gut, making them fear for their very investment lives. It’s not there, at least that I can see as the sector makes some pretty significant lows.
The upshot is that a couple options could be in play if we assume that a capitulation event will be needed to make a real bottom:
- The sector will continue to bounce here, perhaps celebrating war news or just because the broader markets are rallying, with a final dispiriting bottom out ahead, after a perhaps tradeable rally.
- The sector is about to fail imminently, in this little bounce before getting back on its mission of finding a real bottom.
Of course, the assumption of a capitulation could be a bad one. I suppose there is a first time for everything. In my 25 years around the sector, never do I recall a major correction ending so gently as it would have last week. Again, I could be wrong. To that point…
When the sustained bullishness of 2025 finally cracked in late January – led by silver, and permeating the entire complex – the volume was simply MASSIVE. SLV, GLD, GDX… you name it. The sector crashed on massive volume. So let’s ask this question: Did the capitulation already happen? Are there really so few hangers-on left now to capitulate? Valid question, and one of the two possible answers is “yes”.
Bottom line, I held my JDST hedge and even added to it, as I slowly added long positions last week. We are down in the bottoming area, but not necessarily bottomed. I am a better buyer of a late stage correction when I have a little shock absorption (hedge) built in. But I am not going to get caught obsessing on and insisting on a capitulation that may never arrive.
If option 1 above plays out, I’d probably be compelled to get rid of the hedge (can always add it back). If option 2 plays out, the hedge would pay off and be sold into the bottoming process.
Of course, option 3 would be we’ve already bottomed and I am introducing noise that will prove useless to you in due time. It’s already been the “multi-month” correction that we set out to manage in January. Viewing the totality of the correction, risk vs. reward is a million times better now. That is also a consideration for bottom buyers. You’d rather be buying now than in January, eh?
I am buying. But still with the aid of a hedge. If the charts below start to take out noted resistance, the hedge will be eliminated.
Gold just made a third lower low. I may have made an error previously not counting the initial crash low. Why? Oh so human error. Be that as it may, the analysis is the same.
On Thursday gold tanked, tested the March 23rd low with a lower low and immediately reversed back above. In other words, it did what we anticipated. Gold may have bottomed (although GLD does not show capitulation volume).
The key resistance is noted at 4250-4300.

Silver did not make a third lower low and that to me looks like a technical vulnerability. We may not get the “no-brainer” that a 3rd low at clear long-term breakout support (low 50s) would represent. But taken at face value, it is still a possibility.
Silver has held a higher low to the crash low and the secondary low. Oh how it could capitulate if a bounce to resistance fails into a final leg down toward the blue arrow.
Silver’s key resistance is in the 71-74 range. Take that out and it’s probably gone. Don’t take it out and it remains vulnerable, technically.

HUI bonked the top of the projected bottoming zone and bounced from 627 to 683. The favored level would be 590 (+/-). But great corrective work has already been done. It has bounced to a minor resistance point defined by the March lows. So if the bounce is to be a quickie, this level could end it.
But the real resistance of note begins at the SMA 200 (orange) in the 720 to 760 range. Take that out successfully and we’re probably talking a new phase of the bull market.

The big picture chart again shows the full Fib grid measured from the very beginning of the 2025 mega rally (I’ve plotted it from the March, 2024 low). Huey has Fibbed (retraced) below 38% and that’s great. But if there is to be final gut-wrenching low, the 50% Fib around 590 would be a logical point to end the correction.
Either way, having declined from 986 to 627 with an ultimate low target of 590 implies what? Anyone? Bueller? Yes, it implies a massively reduced risk profile compared to a few months ago.

GDX A/D line is still trending negative, but it is also still orderly and looking like a counter-trend move. The major trend being positive.

As noted previously, the GLD/RINF (gold/inflation expectations gauge) ratio has been guiding HUI downward since February. This chart is dialed back to the start of the bull market in 2016. As you can see, HUI has greatly outperformed GLD/RINF over that time. That is because in a disinflationary backdrop, with gold out-performing inflation as well as more inflation-sensitive commodities, the miners are supposed to outperform. They leverage the disinflationary dynamic.
The other side of this dynamic is what we have now, which is an inflationary macro and the reason we note that on the big picture, gold stocks are no longer unique in the world of commodities and commodity producers. Indeed, over time they would be likely to under-perform if the 2003-2008 phase – which is our rough guide – is a good comp.

Finally, the GDX/Gold (GLD) ratio has resisted breaking down from a key level. As with the A/D line above, this is tentative stuff. But if the sector is bottoming imminently, these levels should hold.

A bottom line message on gold stocks is that they are going to bottom. They are going to rally. They are likely to continue the bull market. However…
Gold stocks are not nearly the unique play they were in 2025. This is unchanged from our analysis all year. The view is now to cast out to broader markets, especially commodity/resources markets over time.
US Stock Market
Let’s begin with the market’s situation as measured in gold. As you know, the objective for the Gold/SPX ratio is to make a higher low to the 2025 low at the shaded box. Let’s let herds of conventional players think happy days are here again because “AI!”, because “Semiconductors!”, because “Space-X IPO!” while we quietly manage what should be a coming reversal of recent fortunes, at least where market leadership is concerned.

Of course, our whole macro thesis could be wrong, but flipping the above over to SPX/Gold and ranging it far back in history, I see no reason not to be shifting risk/reward back toward gold over broad stocks. Remember, we anticipated a much-needed bounce in stocks/gold using this chart. That bounce is here and typical of markets, it appears to be pushing the limits.
The bottom of the resistance zone on this chart coincides with the anticipated support of the green box on the chart above. Those are our targets to what is a counter-trend move to an ultimately bearish big picture for stocks in relation to gold.

Let’s let casino patrons twirl their noise-makers, dance the Jig and ultimately be the herd they are. We anticipated this, and until the above-noted targets are disproven, it’s all just the noise of a much needed renewal of bubble-headed spirits. It will not last.
I can write that because I called it to begin with. Perma-bears cannot (or should not) write that because they forgot to note that stocks would be likely to outperform for a phase.
The nominal stock market is obviously still bullish, trending up in all its facets and with generally supportive internals. Currently favored sectors – while still holding a couple Semis – are Cloud/SaaS, certain BioPharma and depending on the Silver/Gold ratio and Treasury bonds (see below), certain commodity/resources areas like the usual suspects, Battery materials (Ni, Li, etc.) Rare Earth, Uranium, Copper. Also eyeing a return of Fertilizer play IPI and a few other items.
As noted, I have to take care of other things shortly. Let’s get a move on. But…
The Bottom Line to the Report So Far…
…is that the precious metals are close to a good bottom, both price-wise and in my opinion, time-wise.
Additionally, the rebound in the stock market in relation to gold is close to its end.
A dominant theme of the new (big picture) macro we are managing has been gold over stocks as paper (Treasury bonds) and things associated with paper either go bearish or under-perform. This was subject to what is now a mature counter-trend move in stocks vs. gold.
When gold takes back the macro, we may anticipate silver taking over leadership from gold and that would be a trigger for the wider commodity/resources trades, as noted above.
Because I, if no one else, am always ready to view this profound chart of the new macro, here it is again.

A disinflationary macro (roughly 1981 to 2020) held sway for decades. This featured:
- Policymakers able to supply inflation (printing in its various forms) as needed at every market/economic crisis point, while the bond market did not point a finger at said policymakers…
- …because “look Ma, no inflation!” said the bond market.
- Well, now the bond market finally caught on and says “oh yeah, inflation!”
An inflationary macro became the dominant trend post-2020 and verified in 2022 with the break of the former Continuum’s limiting moving averages.
- The trend in long-term yields has turned up and this means policymakers will not find it so easy to “hide the cheese” as they create new inflationary policy.
- This exposes them to the light of day, and to asset markets.
- The expectations during this phase of burning paper, is for real assets to outpeform.
- Gold > Silver > Copper > Nickel > REE > Uranium > Lithium > Fertilizer > etc.
We do now, and have all along held the prospect of an interim disinflationary phase, which would temporarily benefit bonds. The big picture macro says “enjoy it while you can, because it’s not the main trend… far from it.” As a side note, I’d expect such an interim phase to benefit commodities and precious metals as well as stocks, because it would reduce Fed-hawk sentiment.
Other Stock Market Internals
First up, the SPX A/D line continues to be supportive of a bullish market.

Equal Weight SPX is bouncing vs. Headline SPX. That is a short-term positive breadth sign.

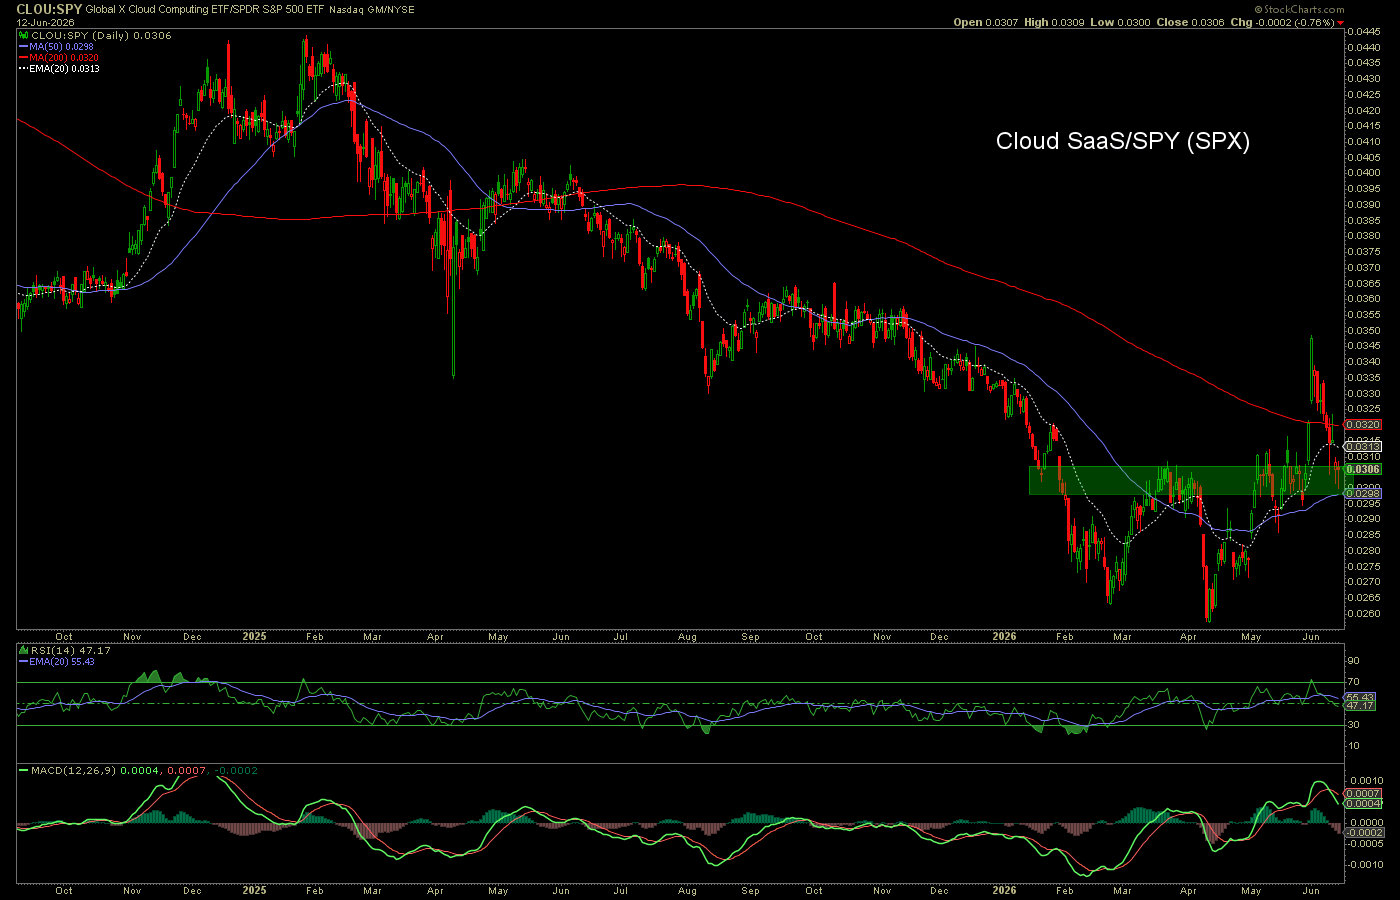
Since I have been pretty well focused on the Software sector lately, let’s check out the CLOU/SPY ratio, which has broken upward and is now dropping to test a bottom/breakout. Obviously, it needs to hold here to keep the play going. I think that is more likely than not.
Looking another potential bottomer, Small Cap stocks are making a hint of breaking out vs. the most over-owned, bloated pigs in the market. If this succeeds it will be another internal positive and making money in the bull by stock picking will be easier (as long as said bull continues).

Global Stocks (ACWX) continue to hang in there regarding a base breakout vs. US stocks (SPY).

Our neighbors to the north do not yet give a green light on the more speculative commodity/resources trades (TSX-V/TSX ratio). But as with gold stocks, you can see that risk in those areas is much reduced from January.

The destiny of the Gold/Silver ratio and USD will likely have a big say in the near-term fates of the two charts directly above, and several others as well.

Of course, this will play strongly into it. If peace breaks out it is much more likely than not that the GSR and USD will ease or break down, relieving pressure in many markets. I know that sounds overly obvious, but it’s how the markets have been acting… obviously.

Remaining Business
With time rapidly running out for your letter writer, let’s wrap this up with some brief bullets.
- The last NAAIM reading was 79% bulls, which is not extreme and is permissive of more rally.
- AAII is 30% bulls, 48% bears (remainder neutral) and that is contrary bullish.
- Fear/Greed index has jerked to ‘Fear’, which is moderately contrary bullish.
- I am watching items like the GSR/USD and TSX-V/TSX ratio in order to get more bullish on favored commodity areas.
- Those favored commodity areas are Uranium, Battery Metals/Materials like Ni & Li, Rare Earths, Copper, possibly PGMs… and their producers.
- I hold a few and bought the wipeout in Uranium, but the real green lights have not yet flashed, per the above.
- I continue to believe that a counter-trend rally in Treasury bonds could be in the offing if this phase of the war ends and inflation fears start to wane.
- The FOMC meets this week and will leave the Funds Rate as is at 3.5% to 3.75%. Even if Warsh is a Trump stooge, he’s not going to come in reveal himself as that right away.
- Aside from that, nothing has changed in Fed forecasting. Rates are projected by CME Group to remain unchanged until December, when a majority believe the next move will be a rate increase.
- A lot of time between now and then, and CME is notoriously a trend follower, not a reliable forecaster. But this is the current expectation.
Portfolios
Gold is long-term risk management & monetary value/stability in a balanced portfolio.
Well, the savings account felt bullish enough to get in the game. At 84% cash (incl. adjustment) it’s still saving, but it’s playing a bit too. If the war ends and markets respond as would be expected, bear positions are gone. Also, short-term Treasury bonds are likely to be brought back for an interim phase.
Holdings tend to be a little MAG 7-ish because I perceive they do not need as much babysitting. Others, like CCJ, MP, NOW, etc. tend to be leaders within their sectors. Since grabbing the profits on both AMEGF (AE.V) and TLOFF (TLO.TO) this account has kept the speculative stuff to a bare minimum.

The “Savings” account will vary in its positioning. At times when I am confident of bullish markets it will hold positions, while remaining primarily a cash/equivalents account. At times I am not, it will not substantially hold much beyond cash/equivalents.
Trading Account
No positions (yet), after a failed short on the last go-round with INTC.
Roth IRA (non-taxable, no contributions)
With the brutal performance of gold stocks since January, I consider it a pretty good accomplishment to have kept this chart intact to the degree it is.

With the market view shaping up the way it is, though part of me wants to grab as many gold/silver stocks as I can, I am going to stick with what my analytical mind is telling me: They are now nothing special on the big picture, inflationary macro. Lots of other areas to focus on, including the wider commodity spectrum.
Cash is 83%, and I will probably add back some short-term Treasury.
I have no time to write notes beside each of the holdings this week. But the holdings represent Gold/Silver stocks, Commodity producers, Software, Cannabis, Biopharma and more. Cash will be put to work if the “normal” script of a peace deal and associated relief plays out. Shorts would become booked losses.

Cash & income-generating Treasury bonds are at levels that are right for me and my real-world situation. Your situation is different. Cash will be adjusted as needed.
Refer to the In-Week Notes under the NFTRH Premium menu at nftrh.com for market talk and occasional trading info, if interested. Also, you can follow on X @NFTRHgt for notice of updates.
NFTRH is not to be distributed to third parties without prior written consent
Notes From the Rabbit Hole (NFTRH) is a weekly market report in which we provide analysis on financial markets. We make every effort to provide accurate and high quality content, but this analysis ultimately represents our opinions and these opinions are provided without warranty or guarantee of any kind. See full terms & conditions of service under the ‘About’ heading in the main menu.

Thoughts and prayers for your daughter Gary,
Best regards,
Bruce
Thank you, Bruce. We got really good news today!
I send you good prayers to your daughter
Thank you, Jonhny. She should recover fully. I am hugely relieved.