

Summary
A brief summary of the work done in this week’s report and in the updates and reports leading up to this point. Please read the detailed report for the complete picture. There are many granular details that cannot be summarized so briefly.
Last week’s summaries followed by [new comments in italics]
Precious Metals (bull market)
Correction has been in effect all along, but the bounce we allowed for did not materialize before the sector tanked, severely threatening support levels. Sector often leads stock markets, historically.
US Stock Market (bull market)
SPX back below our original upside target of 7400. But trends are up and a one day hit does not a correction make. However, a significant correction is now much more likely. Not so much because of the sharp down day on Friday, but because it came after manic upside in the leading Semi sector with the Gold/Silver ratio and USD spiking. Follow-through on all of these conditions needed to confirm a correction.
Global Stocks (bull market)
ACWX/SPY ratio is still at support. But if the move in USD is real, global could slip in relation to the US if its inverse USD character continues. If the US corrects with USD receiving a liquidity bid, global (on balance) could correct harder.
L/T US Treasury Bonds (bear market)
No sign of an interim bond rally yet. Indeed, strong Payrolls drove yields up and other markets down on Friday. An interim bond rally is not off the table, however, if markets correct, inflation expectations ease and Treasury bonds revert temporarily to “safe” haven status.
Commodities/Resources (bull market)
If USD and the Gold/Silver ratio both rally, commodities would come under pressure while silver (more commodity-like character) leads gold (less commodity-like character) to the downside.
US Dollar (cyclical bear market, L/T still a technical bull market)
USD has been on a grinding rally since January. This rally could be an A-B-C upward correction within a cyclical bear market. On Friday it spiked on economic news perceived to boost expectations of a hawkish Fed. If it and the Gold/Silver ratio continue upward there should be corrections in more than just gold and silver. Commodities and many stock sectors and markets would be affected.
[edit] Since this is just so much fun for me (ha ha), an NFTRH+ post on the precious metals will be upcoming this afternoon to add more color to the situation. NFTRH 918 offered favored views and a caveat. But I want to try to establish a clearer path. We’ll see how that works out.
That NFTRH+ update is now posted.
Cracked
The precious metals have been leading by a country mile. In 2025, to the upside. In 2026, to the downside – if the crack in the stock market is real, which me bones tells me it probably is. I want to tell you that I am ready to be invigorated because I do my best, most vital work when things are falling apart and the herds are set in motion.
Managing a grinding correction in the precious metals, managing the bullish Semi sector into bubblehood, and chasing around the stock market’s rotations (e.g. Software) is fine. It kept me busy.
But now, if that hard crack on Friday was real, the game plan shifts up a gear. The first part of the (personal) plan was to take most profits and limit some losses. Get cashed up. I didn’t just do this because it ‘felt’ like the time. It also looked like the time, as the 2 Horseman of the Macro Liquidity Apocalypse rode across the all day long. Severed heads and limbs and all. As you know, this indicator set needs to be watched closely.

When Gold (more counter-cyclical, less inflation sensitive) rises vs. silver while both metals are declining and the USD receives incoming risk-off liquidity, the signal is to seek shelter until they are done slaughtering the greedy and disoriented people and/or their advisors clinging to over-priced shares.
That’s a little dramatic, but if all goes well we can sit on a perch, collect income through cash, trade up and down and most importantly, wait with patience until some legit downside targets are registered.
As noted in an update, I am thinking correction, not bear market. That has been the thought all along, as you know. The US dollar is in a cyclical bear market within what is still technically a long-term (since 2008) bull market. I’ve projected a possible A-B-C upside correction to the cyclical bear on the chart above.
The upper most resistance has clear visual justification from the little shoulders of 2024 and 2025. USD has been basing and importantly, has not broken above the base. So Friday was a crack in markets. Oh yes it was. But it was a day. Neither the GSR nor the USD have proven much yet.
Please note that my hard risk-off moves were made by someone operating a Roth IRA, with no tax implication on profits. I also took taxable profits in the ‘savings’ account, but there was far less positioning there and ‘savings’ needs to live up to its name. Taxes be damned.
I could be wrong about a correction in broad stocks. But my oft-stated plan was to not substantially give back profits earned over the last year+. I don’t want to influence those with other orientations (like long-term investors) out of their shares. I am a trader. Far from a day trader. But a trader of the intermediate macro swings (measured in months, sometimes a year or more).
Semi
Understand that I would much prefer the correction scenario because I want to buy mass confusion, pain and bleak contrary sentiment. Not just in gold stocks. In all favored sectors.
For example, the Semiconductor sector was favored until it turned manic. If the mania pops, eventually items like MRVL, QCOM, TSM, NVDA and others could provide significant buying opportunities. I still hold ASML and ALAB, just in case I overreacted to Friday’s macro signal. But also because I consider ASML the premier global Semi Equipment company and ALAB a little gem I found that has grown (its business and my profits) like a weed.
Software
The stock market could rotate its way through a moderate correction or mere volatility. It will depend on what, if anything other than cash, the machines rotate toward. Frankly, when I look at the Software trade, which I/we participated in, it looks like the hard pullback could be bought. Much of this stuff came off the bottom, after all. Far from manic, unlike the Semis.
SAP, for example, is one of a few stocks I still hold because it is a chart I would buy as a bottom feed. And previously held items like NOW, MDB, DDOG are on watch, should they pull back hard enough.

PATH, for another example, remains on watch as it declines from the SMA 200 to the SMA 50 and associated support.

The above are illustrations of why I am loath to get too bearish, too soon. That and the fact that some sectors are far less directly vulnerable to a strong USD and GSR. Software being one.
Healthcare
And what of this area? As you know, I developed distrust of the wider sector due to the disruption of the GLP-1 drugs. I still hold NVO and LLY (along with GILD). But I also notice that the broad sector (XLV) is on a rally and Medical Devices (IHI) are potentially making a short-term ‘W’ bottom.
Might the sector readopt its role as a defensive sector? It might.
Conclusion
I am certainly not one to jump in and short this market. The corrective theme may be ‘rotation’ as opposed to hard down across sectors. Personally, I am prepared to trade the rotations (as per Semi and later, Software), short some stocks or sectors, and hold cash as needed.
The market will sort itself out. As yet, we had a bad day on Friday. That’s all. Trends are still what they were, but underneath, the market may be rotating.
SPX is made up of many sectors, after all, and its Advance/Decline is still intact.
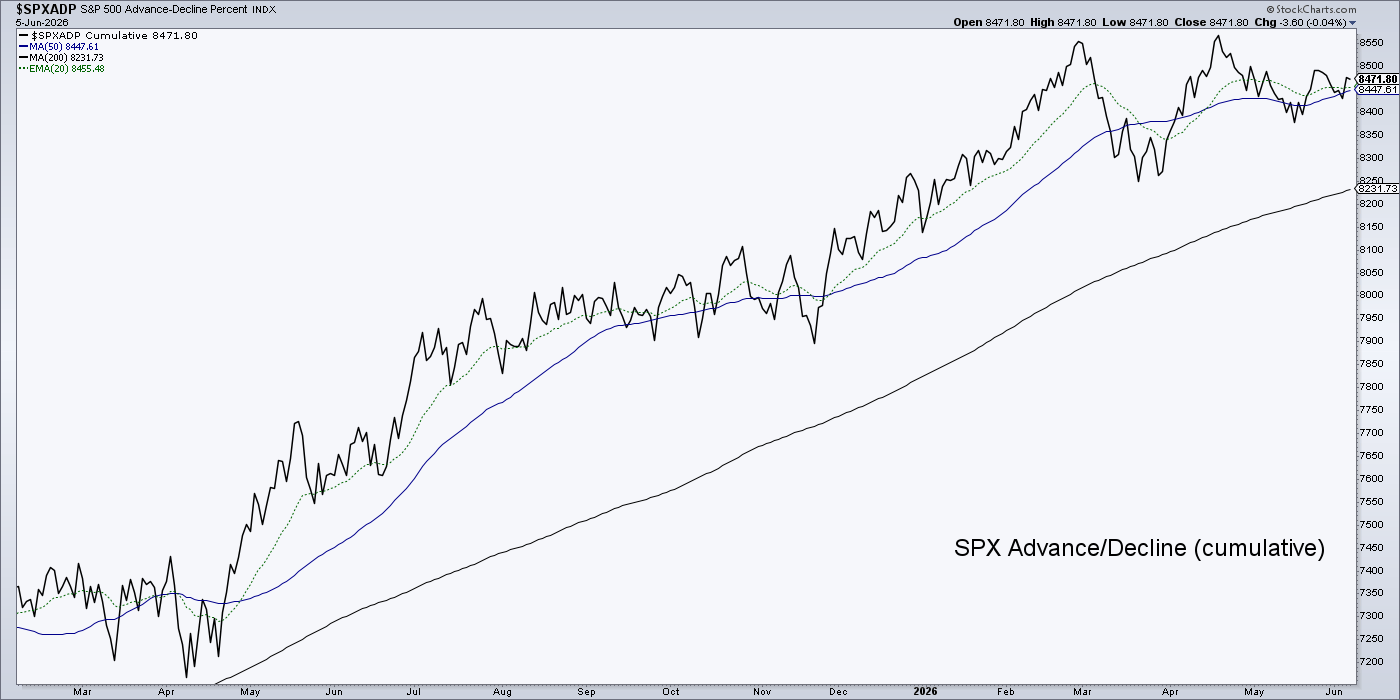
Precious Metals (the leader)
If the correction’s next leg is indeed in play we’ll keep a close eye on the gold and silver, as gold tends to bottom first (see caveat to that below). Then the miners would catch on.
I don’t think I own a single gold stock anymore because most of them were flashing accumulated profits that I had stated would not be willingly relinquished. They have not been.
If Friday was a fake out, I will have to adjust. But it is from a point of strength and risk management, not desperation. If the sector bounces tomorrow or this week, it is just a bounce. I may trade up and/or down. But the sector is in correction and has been since January.
More likely, in my opinion, is that an unfinished correction is resuming and will probably lead broader markets downward or into volatility and rotations (per the above). If the view is correct, we’d likely see gold bottom first (see caveat below) and then prepare to buy gold stocks. Silver could bottom around the same time as the miners.
Gold (daily chart) should hold right here or else a lower low (to the March 23rd pre-market low of 4098) would be probable. If that were to happen more downside opens up, including very significant support at 3400. Major MAJOR support is at the big breakout point around 2100. I don’t think that is at all realistic. But it is noted, regardless.

Caveat to the normal progression: Silver may actually lead the sector and bottom first this time because a) the macro is different now (inflationary vs. the previous disinflationary) and b) it’s got a technical head start, already having made a lower low and lower high while gold has not yet made a lower low.
The blue arrow shows the would-be no-brainer low at the long-term breakout point. However, first silver (daily) must lose the 200 day moving average to load that target.

Mining For Future Profits (but protecting current profits)
GDX (daily) is losing its SMA 200 and putting a hard test on the next support level. It looks like it wants minor support at 72, at least.

At most it may want the 54-55 area, which we’ve kept well on radar as doable. Remember how bullish 2025 was? This is the come-down.
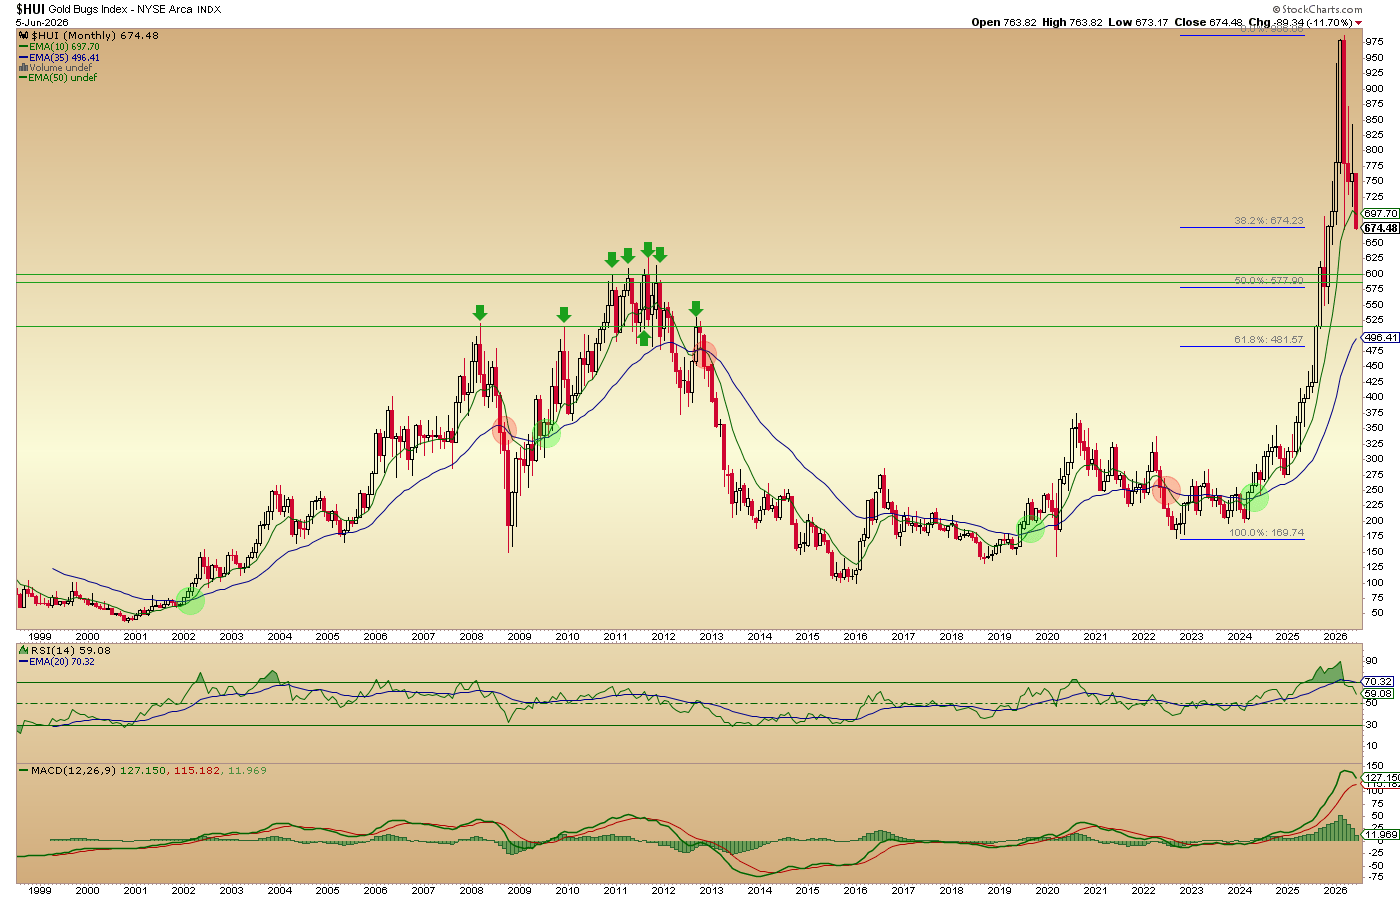
In steps the big picture monthly chart of the HUI Gold Bugs index to put more perspective on that lower level, which corresponds with the 2010-2011 highs for GDX (that same 54-55 range).
As previously noted, the sector has already done good work in burning off last year’s froth. A pullback in HUI to a level commensurate with GDX 55 would see Huey tap the 2010-2011 pattern top and a full 50% Fib retrace of the entire final rally leg. Secondarily, we keep the 62% Fib and 500 area on watch.
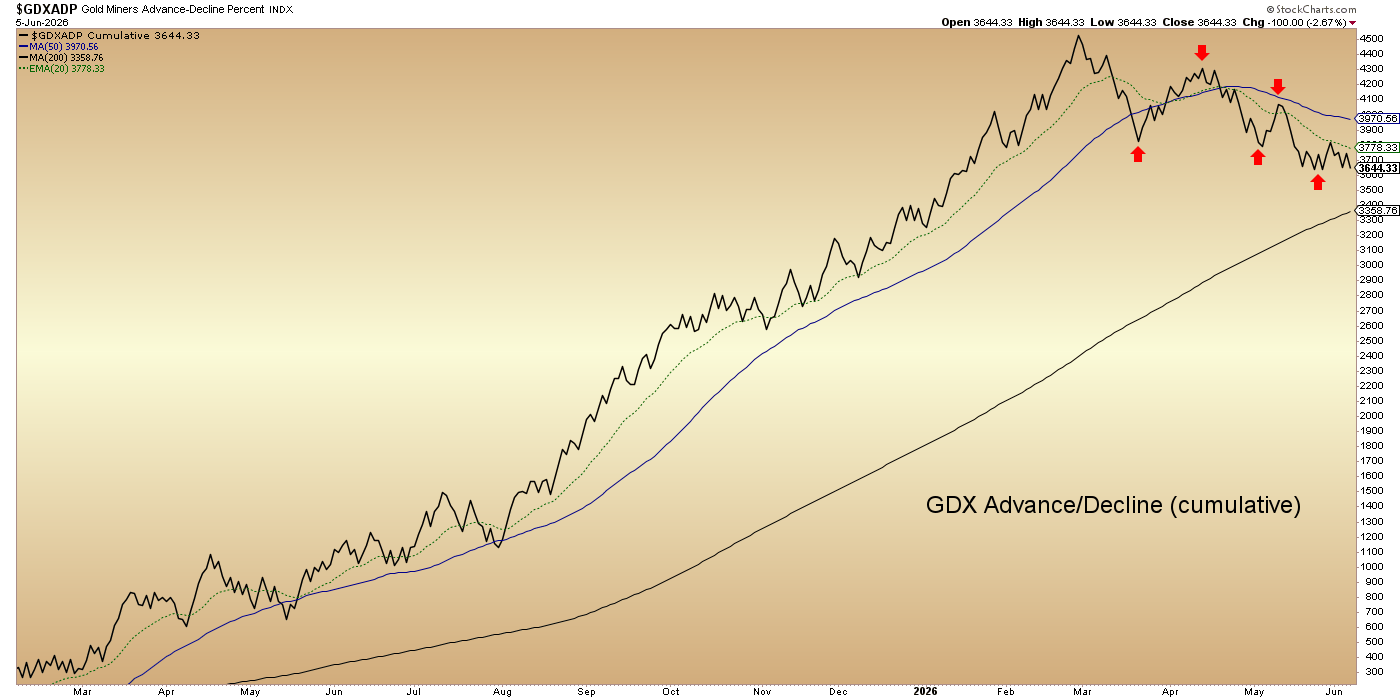
GDX Advance/Decline told us a good story of fading internals. On the plus side, it remains orderly and is probably in consolidation prior to the next bull signal/divergence (we’ll keep this on watch for internal divergence) some months from now.
The Gold/SPX ratio (GLD/SPY) continues southward. Our key level is shaded. Make a higher high there, as anticipated, or else there’s going to be more extended trouble for the precious metals. I don’t expect it, but I sure as shit will note anything that I think can be helpful to us going forward.

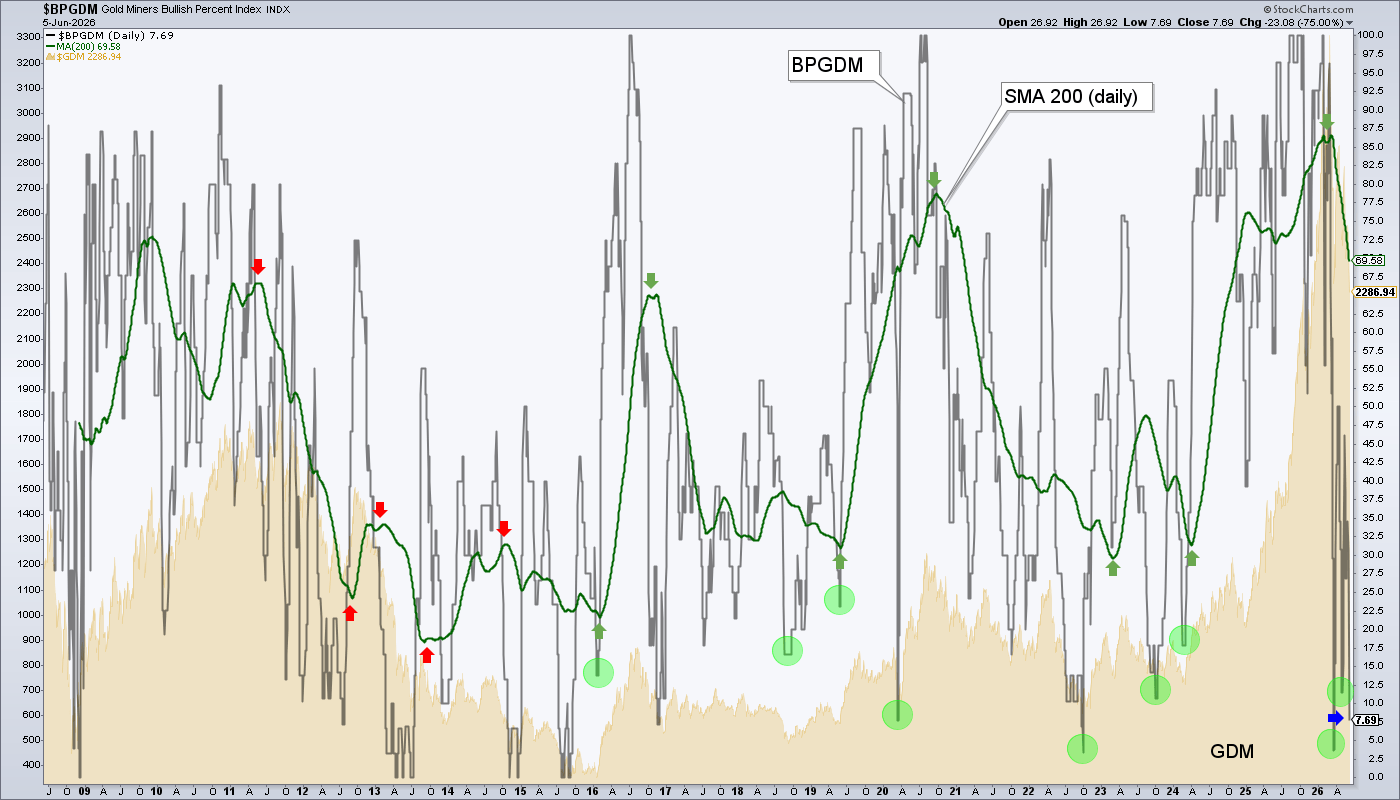
Gold Miners Bullish Percent could be faking people into crowing about a great buying opportunity as it got hammered back down to the extreme lows. Indeed, a bounce can come any time. But the warning here is that while gold stocks are in a bull market, we have anticipated the SMA 200 (green line) making another swing down over time, within its bull market uptrend.
The GDX/Gold ratio had been hanging around the nose of the Symmetrical Triangle… until Friday, when it go cracked but good. Obviously a poor internal signal.

The Gold/RINF (inflation expectations gauge) ratio has cracked the support level that needed to hold to keep the macro-fundamental picture intact from this vantage point. HUI tends to line up with the ratio pretty well. Au/RINF was a great guide for us on gold stocks during bullish 2025.
Well now it is bearish 2026. If the breakdown in Gold/RINF is real, gold stocks could have significantly further to fall during this correction.

As for the Gold/Oil ratio, which is an important indication for the fuel-intensive mining industry, I think the main damage is already done and the ratio may bottom here. Especially if the war shows signs of ending and the SoH opens up. But, damage done. We’re already over 2/3 of the way through Q2 and this ratio has been in the pits all quarter so far and still has not turned up.
We have used the GOR in the past to call positive sector fundamentals and now we use it to call poor sector fundamentals, at least where the next reporting season (late July/early August) is concerned.

Precious Metals Bottom Line
Bearish, within a bull market. Opportunity ahead. Near-term opportunity to short the sector if setups develop, and if so inclined. Longer-term (likely measured in months), correction toward future buying opportunity appears to have resumed. If we’re lucky, we’ll get to clear technical buy levels, maybe by late summer or in the fall.
The Bonds of Orthodoxy
The standard 60-40 portfolio (60% stocks, 40% bonds) pushed by my wife’s 401k (luckily, I manage it) and those of millions of others would not be likely to do well if this is any sort of 2022 redux. Back then the 60-40’ers were perplexed at how not only did their stocks go down, but so too did their supposedly risk-free bonds.
While we may still get that interim disinflationary signaling in bonds (Gary = wrong about that so far), the big trend is now up in yields and down in bonds. This is a big time bear market.

Bond Market Bottom Line
Well, it’s a bear market, after all.
Stock Market (the follower)
We can wrangle about whether silver or gold will bottom and turn up first. One of them will. But what is usually the case is that the precious metals take the hit much earlier and eventually the broads follow. Since the PMs have been in clear correction since January, I’d say that’s a great head start. If/when the stock market follows into correction, I’d expect it to bottom after gold does.
SPX is now back below our original upside target of 7400. Not bad, for a start. It looks likely that SPX will at least test its (blue) SMA 50 and a slight support shelf. But oh boy has this pig earned a deeper pullback, at least to the (orange) SMA 200 (if not the gap at 6618 or even the pattern top at 6050-6100.
But as noted above, this pig could be on a rotisserie, merely getting cooked well-done amid sector rotations rather than burned by the fires of hell. Okay Gary, that’ll be enough imagery for now.

Leadership is intact by the SOX (SMH) > NDX (QQQ) > SPX (SPY) chain. But it’s also representative of bubble dynamics in my opinion. The crack on Friday may lead to some serious breakdowns going forward. But it’s only been one day, after all. I can’t put all my analytical eggs in one day’s basket. Patience.


As for global stocks, a rising US dollar would be unlikely to prove beneficial, as the ACWX/SPY ratio struggles to hold its base breakout.

Stock Market Bottom Line
We noted last week that sentiment had become extremely over-bullish. Friday, the market cracked. Unlike the precious metals, stock markets are okay technically. But a correction would have to start somewhere. Why not from highs driven by excess in the leading bubble sector, the Semiconductors.
Even assuming a correction is starting, shorting here could be a tough proposition if not done with setups. For example an initial hard down and a sharp bounce back to resistance. The other consideration is sector rotation. Perhaps short here and go long there.
A positive is that, again IF a correction has begun, cash is still paying out reasonable income, unlike for example the hell years of ZIRP as the Bernanke Fed for 7 years punished would-be cash holders (i.e. savers) mercilessly in service to bailing out the asset-owner classes. That policy was vile, in my not so muted opinion.
Personal Plan
For what seems like the 20th time, “IF” a correction has begun… I will default to cash and probably use S/T Treasury bonds to a lesser degree than I have over the last few years. 1-3 year bonds will pay out income well enough to compensate for any erosion in price. But cash and/or T-bills just simplify the whole thing. Maybe I’ll add back STIP (0-5yr TIPS) as well.
That stuff will be the default position. In the IRA I am going to start out being very careful to preserve the gains of the last year+ and collect whatever cash pays me at the end of each month. Within that regimen, I may look for swing trades long and short, in whatever sector(s) may look interesting.
I expect this to be a typical summer correction or rotation, but I think it could bring some pain, especially in the areas that bubbled. Those areas, much like silver and precious metals in 2025, hold many unhealthy FOMOs, MOMOs and cling-ons.
That stuff needs a cleaning. If a correction has not begun, I’ll nimbly go with the rotation theme. If I am wrong about it being only a correction or rotation, we’ll evaluate support levels along the way, kicking the tires and evaluating whether that rare and mythical thing known as a bear market may actually ensue.
Mainly, I want to have fun. Fun to me is not being in harm’s way when greedy people who don’t do sound work are in harm’s way. That may sound harsh, mean, like an a-hole. But it’s how I get at times when I feel we’ve done hard work in order to not be like the majority, and then actually look forward to capitalizing. There are reasons I keep my work as honest as I can.
- I would feel very bad about myself as a human with a soul if I acted like a large percentage of the market analysis herd, including newsletters, financial advisers and of course, large financial institutions, even some of the foremost gold bug elite. I take it extremely personally trying not to put you or myself in harm’s way. I guess that’s how a risk manager manages.
- It’s really easy to bullshit yourself in this business. You can start to think you are better, more skilled and just smarter than you actually are. I am not particularly smart, by the way. Not kidding, ask my grade school teachers or college professors. I consider myself intelligent and I have a really good Bullshit Detector. It’s all ya need, folks. That and honesty. “Smart” can out-think itself and promote itself as something it’s not.
Anyway, the most fun I’ll have during the ongoing correction (precious metals and some commodities) and potential correction (stocks and some commodities) will be in the trading account, where I can make quick trades long and short. To this point I’ve had training wheels on the thing. Carefully taking only trades I feel have a high likelihood of success and not feeling any pressure whatsoever to over-trade.
I still feel no pressure to trade. But I am going to look closer at more trading opportunities. That might knock me off from the trading account’s excellent percentage performance this year. There will be losers and winners, long and short. But if I manage risk tightly, it can be fun while we pass the time this summer and prepare for the correction’s end (precious metals and some commodities) and the ‘potential’ correction’s end in stocks.
Market Sentiment & Final Note
It was over-bullish last week. The market cracked. Let’s see if it follows through. If so, there is a lot of southward real estate to which sentiment can decline.
We will know shortly if Friday was just a crack, a twitch, a reason to be alarmed, another rotation… or if it was the beginning of something that has been much needed; a genuine broad market correction.
Booked profits tell me not to sweat the answers, but instead to just await them.
Portfolios
Gold is long-term risk management & monetary value/stability in a balanced portfolio.
It’s now a true savings account, with a couple stock holdings in it.

Trading Account
No positions (yet), after another profit was booked shorting Intel. I’ll short anything, including gold stocks if I get setups, with little reservation. I will also take long setups as well. This account seeks to be completely cold hearted and business-like.
Roth IRA (non-taxable, no contributions)
As you will see below, I was not kidding when I wrote several times in this space that I would defend the noted support level.

Cash is an absurd 92%. I hold a few stocks, some of which I may not let them pry away from me.
I actually added CRON on Friday as the Cannabis stocks, including currently held GTBIF, continue to look bullish. Not a gold stock to be found. That will change with the prospects of bounces and/or rallies, but there will be no heart-felt holding until the sector either smashes clear no-brainer buy levels or starts to otherwise negate the bear.
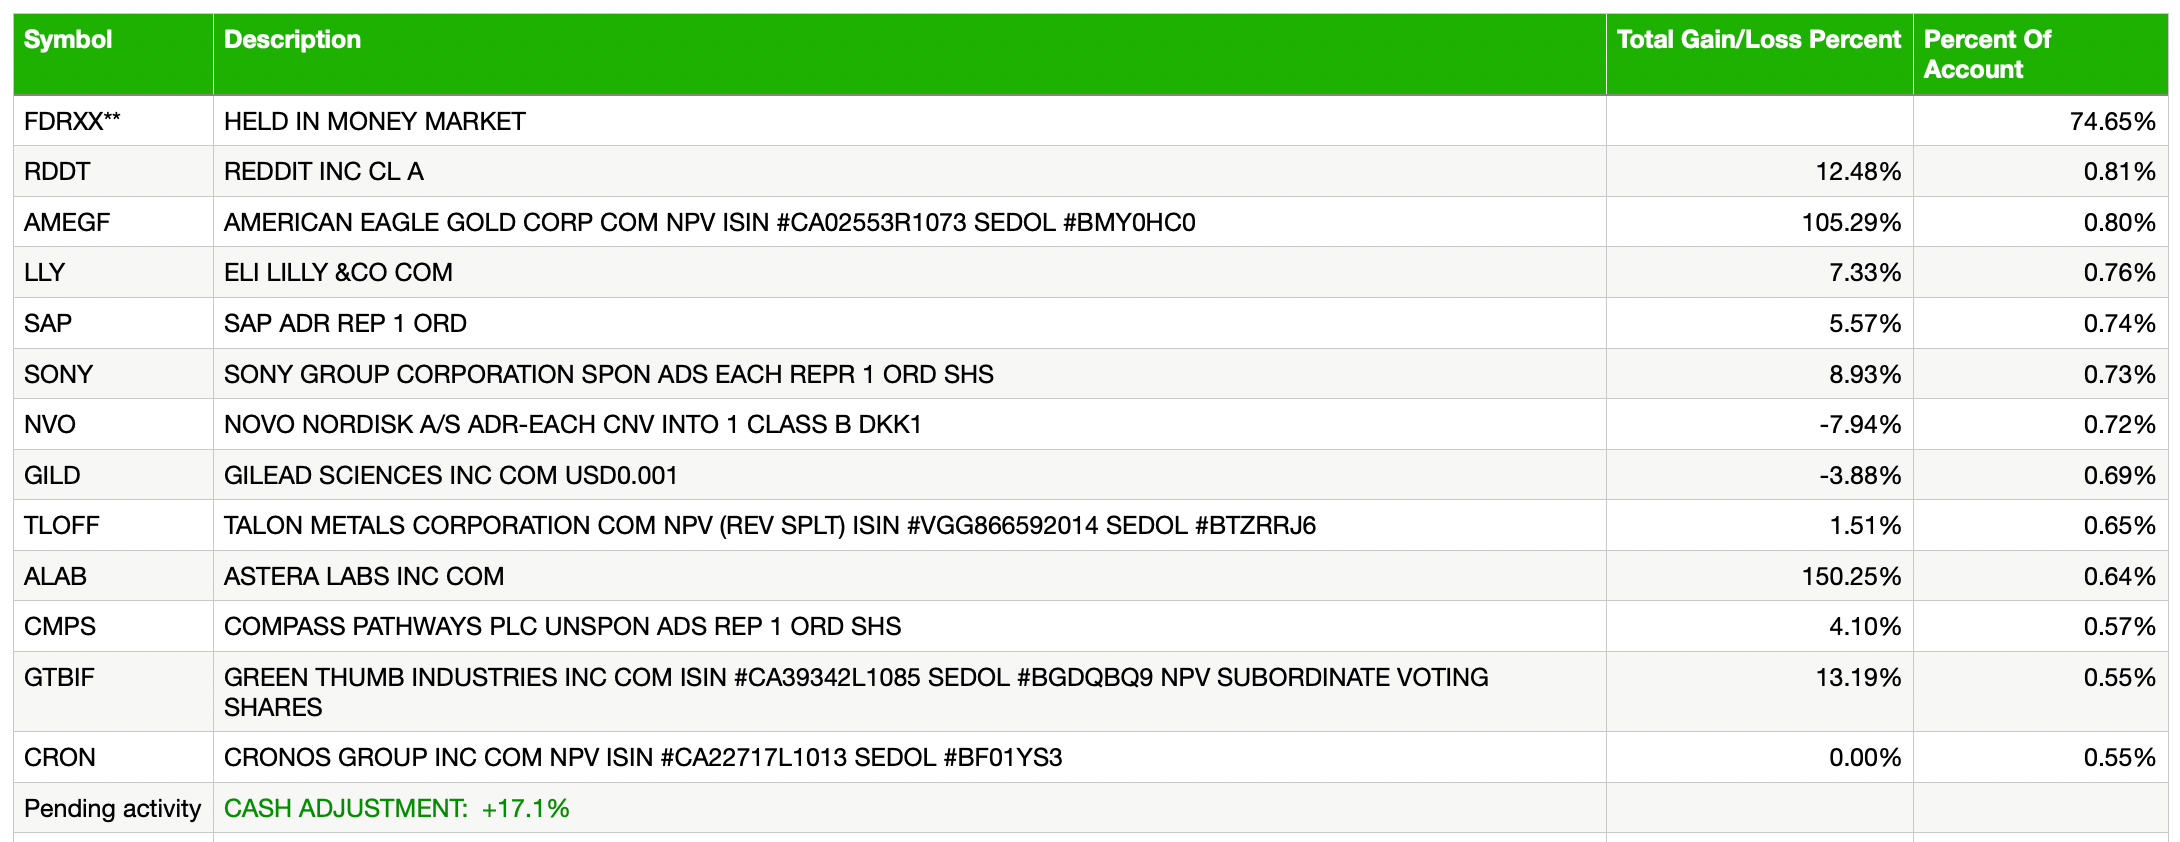
Cash & income-generating Treasury bonds are at levels that are right for me and my real-world situation. Your situation is different. Cash will be adjusted as needed.
Refer to the In-Week Notes under the NFTRH Premium menu at nftrh.com for market talk and occasional trading info, if interested. Also, you can follow on X @NFTRHgt for notice of updates.
NFTRH is not to be distributed to third parties without prior written consent
Notes From the Rabbit Hole (NFTRH) is a weekly market report in which we provide analysis on financial markets. We make every effort to provide accurate and high quality content, but this analysis ultimately represents our opinions and these opinions are provided without warranty or guarantee of any kind. See full terms & conditions of service under the ‘About’ heading in the main menu.
