

Summary
A brief summary of the work done in this week’s report and in the updates and reports leading up to this point. Please read the detailed report for the complete picture. There are many granular details that cannot be summarized so briefly.
Precious Metals (bull market)
Correction still technically in effect for gold and gold stocks. Silver is on the verge of leading the sector out of the correction and to a potential rally. Parameters are detailed below. Volatility is expected in the coming months. Long-term, it’s a bull market.
US Stock Market (bull market)
Broad SPX hit the 7400 target last week. This coincides with a personal shift away from broad diversity into a combo of risk management and more strategic positioning. A correction or pullback in SPX can come at any point. Semi and Tech are extended to the upside.
Global Stocks (bull market)
The world, on balance (ACWX) has based, bottomed and turned up vs. US stocks. If/as this holds (a weak USD would be helpful) continued interest in global stocks is warranted.
L/T US Treasury Bonds (bear market)
Technically, long-term Treasury bonds are biased bearish (yields biased bullish). But a post-war (if the darn thing is actually ending) disinflationary phase could drop yields/boost bonds. Long-term, it’s a bear market, you know.
Commodities/Resources (bull market)
Commodity-related stocks should play a primary role in a post-war, bullish broad market scenario. We are no longer narrowly focused on the precious metals. Individual commodities are all over the place. Oil is a war-related wildcard. Critical and specialty commodity producers/explorers are favored. These include u3o8, Cu, REE, Li, Ni and Ag.
US Dollar (cyclical bear market, L/T still a technical bull market)
The US policy playbook hinges on a weak dollar and the cyclical trends are down. Hence, global markets are prospective. But USD should continue to gain holders at times of asset market correction. Long-term, it’s going to take much more downside (below 89, w/ current being 97.84) to break the technical bull.
SPX Target Registered
I seriously had no clue that SPX was even close to target, let alone realized it had hit the 7400 measured target yesterday, until I took a look yesterday afternoon. Though upside targets are seldom stop signs (at least mine aren’t, they are objectives laid out well ahead of time), it does give me a bit of pause.
As I watch certain holdings go vertical (QCOM, DDOG, SYNA, FTNT) after previous holdings had done so (MRVL, ALAB, etc.), I wonder, could my timeline (balance of 2026) have been pulled in that far? Probably not. But a correction can come at any time.
The 2025 pattern objective measured to 7400, we’ve had it in view for nearly a year, and now it is no more. With the wildcard in the Middle East still in play, anything that goes wrong on that front could trigger a correction. Or if peace breaks out, the machines could sell the news.
Or it could simply be “happy days are here again” as joy spreads across the land (yeah, right) and Trump and Warsh (with a little Bessent whispering sweet dovish nothings in his ear) get to work. Let’s also not forget the big, beautiful, pro-business bill.
Back to the chart, it has earned a correction if one is to come about any time soon (we’ll check in on sentiment below). But the market has busted bullish, near-term correction potential notwithstanding. Any corrective activity now would be expected to test the 6950-6750 range (lateral support/SMA 50 and SMA 200).

SPX is an amalgam of large companies from a multitude of sectors. So within its makeup, there are rotations. For example, Healthcare has been very weak*, while Semi, broad Tech and Growth stocks have been strong. Inside the index Materials, Industrials and Value stocks are quite firm. Lately, Software, which caught a beating on AI hysterics (some of which are valid for some companies) have been in recovery.
Considering the internal rotations, I have been trying to stay in tune. For example, adding laggards/beat downs like DDOG, ZS, FTNT and PANW (several of which have since caught on to the bull) while trimming profits in the bottle rockets. For example, MRVL was sold, ALAB trimmed and on Friday QCOM and SYNA were also trimmed. The general plan is to re-seed elsewhere that may look to rotate ‘in’ over the coming months. In other words, rebalance.
* There are at least two disruptive themes in play right now. The first, which we all know, is AI. Who benefits from it and who is impaired? The second is the effect of widespread adoption of GLP-1 weight-loss drugs. Of note are NVO and LLY. I’ve got them on my watch list as NVO rallies off the lows and LLY takes a correction of sorts. But the important point here is that the prospect of people losing weight leads directly to people avoiding the need for as many medical procedures. This explains why the Medical Device industry and other aspects of Healthcare are getting woodshedded much like Software stocks have in the face of AI. Progress, you know. We’ve got to stay ahead of it.
Internals
Pertaining to the above, the hard down in the XLV (Healthcare)/SPY ratio has been aligned with other market bullish/risk-on signals, but it goes further than that. It’s not only medical devices that will theoretically be altered by the GLP-1 craze.
There are all sorts of treatments, services, therapies, devices/equipment and even infrastructure that could be affected. This looks like a potential structural issue. I have wanted to raise some cash and so that may come from this area.

I think the play for 2026 is to be on top of the internals and rotations. Perhaps sell the ramps and buy the dumps. Or sell that which is going out of favor from a macro perspective and buy that which looks to be in favor. I am not sure what else will go out of favor (we’ll keep watch) but, for example, Uranium and critical minerals stocks look like a rotation ‘in’ candidate. Generally, we should be aware of the rotational dynamic.
Meanwhile, Semi is still ramping vs. Tech…

…and Tech is still ramping vs. Broad (SPX). As long as this persists, there’s no correction. But these indicators are very stretched and hence, a routine correction as illustrated on SPX above, can come at any time.

Growth/Value implies there could yet be more bull to go before a correction ensues. If IFW/IWD has made a real (higher) low here, it looks like it’s only just getting started. Other indicators like Junk/Investment Grade bonds and Consumer Discretionary/Staples also could have further to climb in the near-term.

Market Sentiment
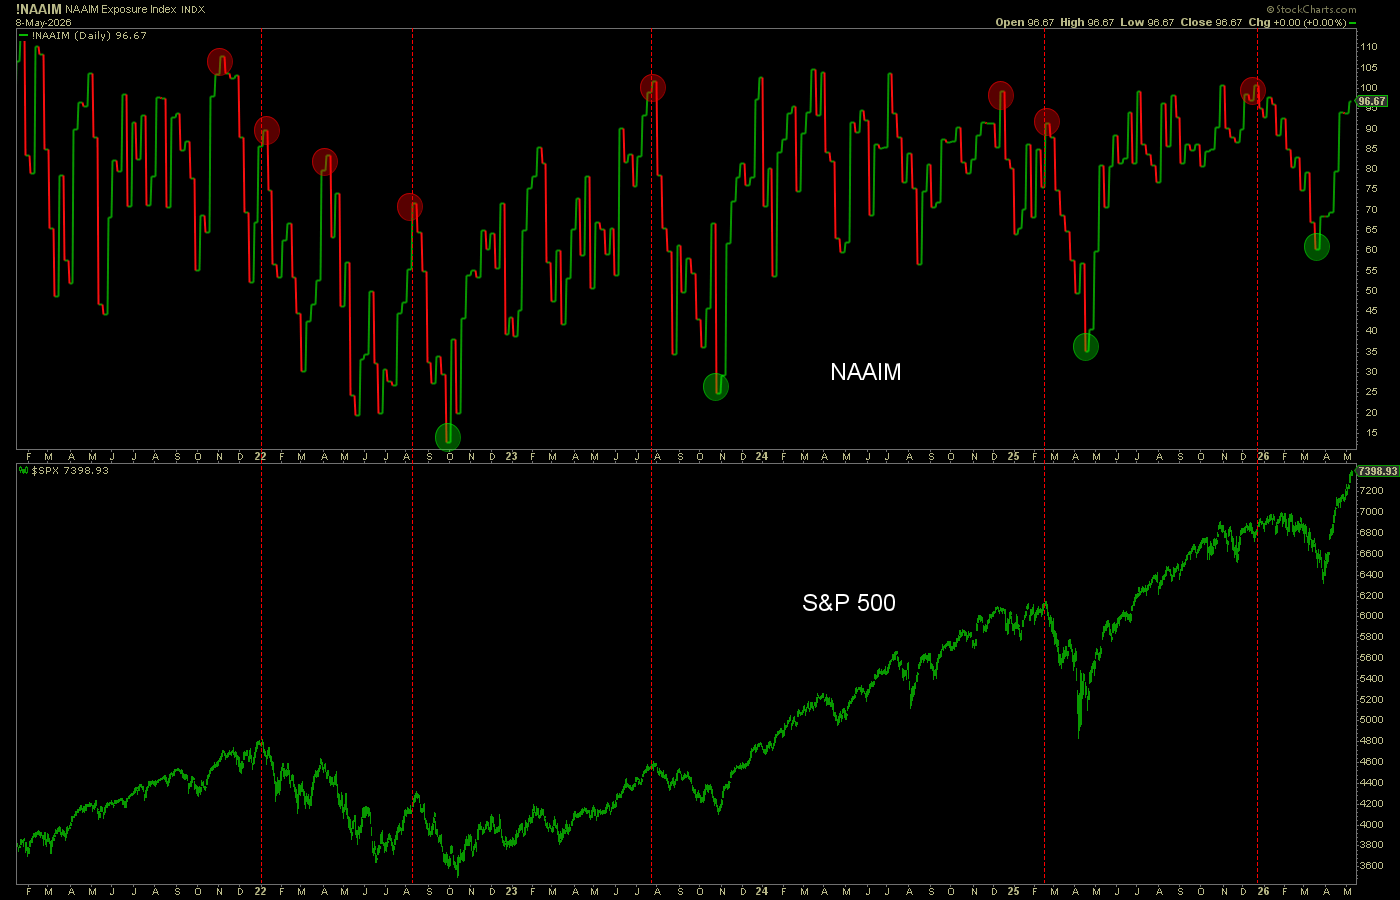
NAAIM (investment managers) tend to be great bullish contrary indicators when they make extreme lows in sentiment (green shaded) as in 2022, 2023 and 2025. NAAIM is a little more inconsistent when making extreme highs. The 2026 correction kicked off from a moderate low, which theoretically does not pack the optimum level of fuel for a major rally or bull leg. It is another argument for the possibility of an interim correction in the US market (ref. SPX chart above).
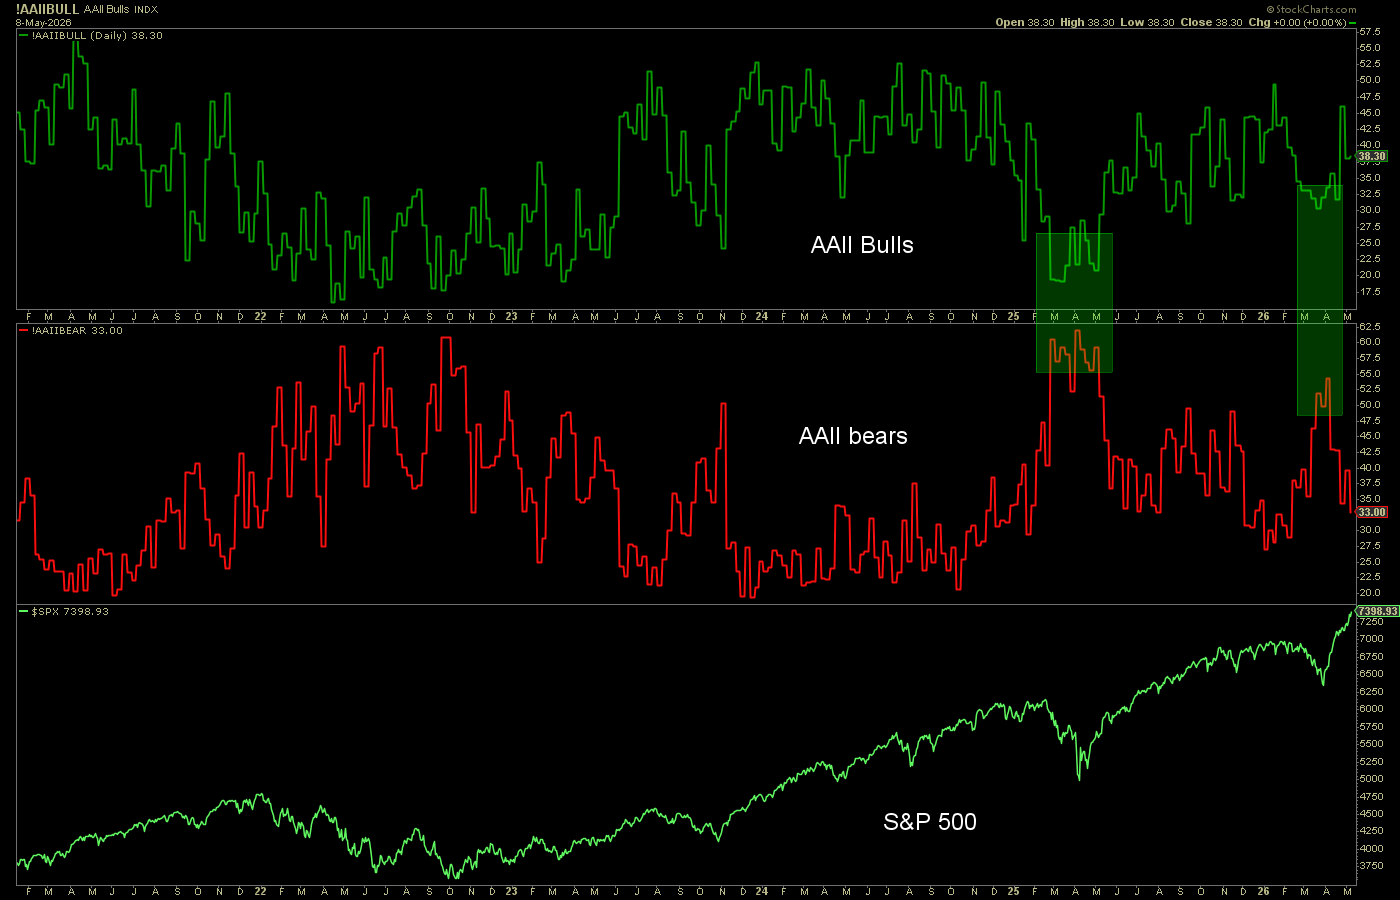
AAII (Ma & Pa) similarly became over bearish recently in much the same way NAAIM did. Not as extreme as 2025.
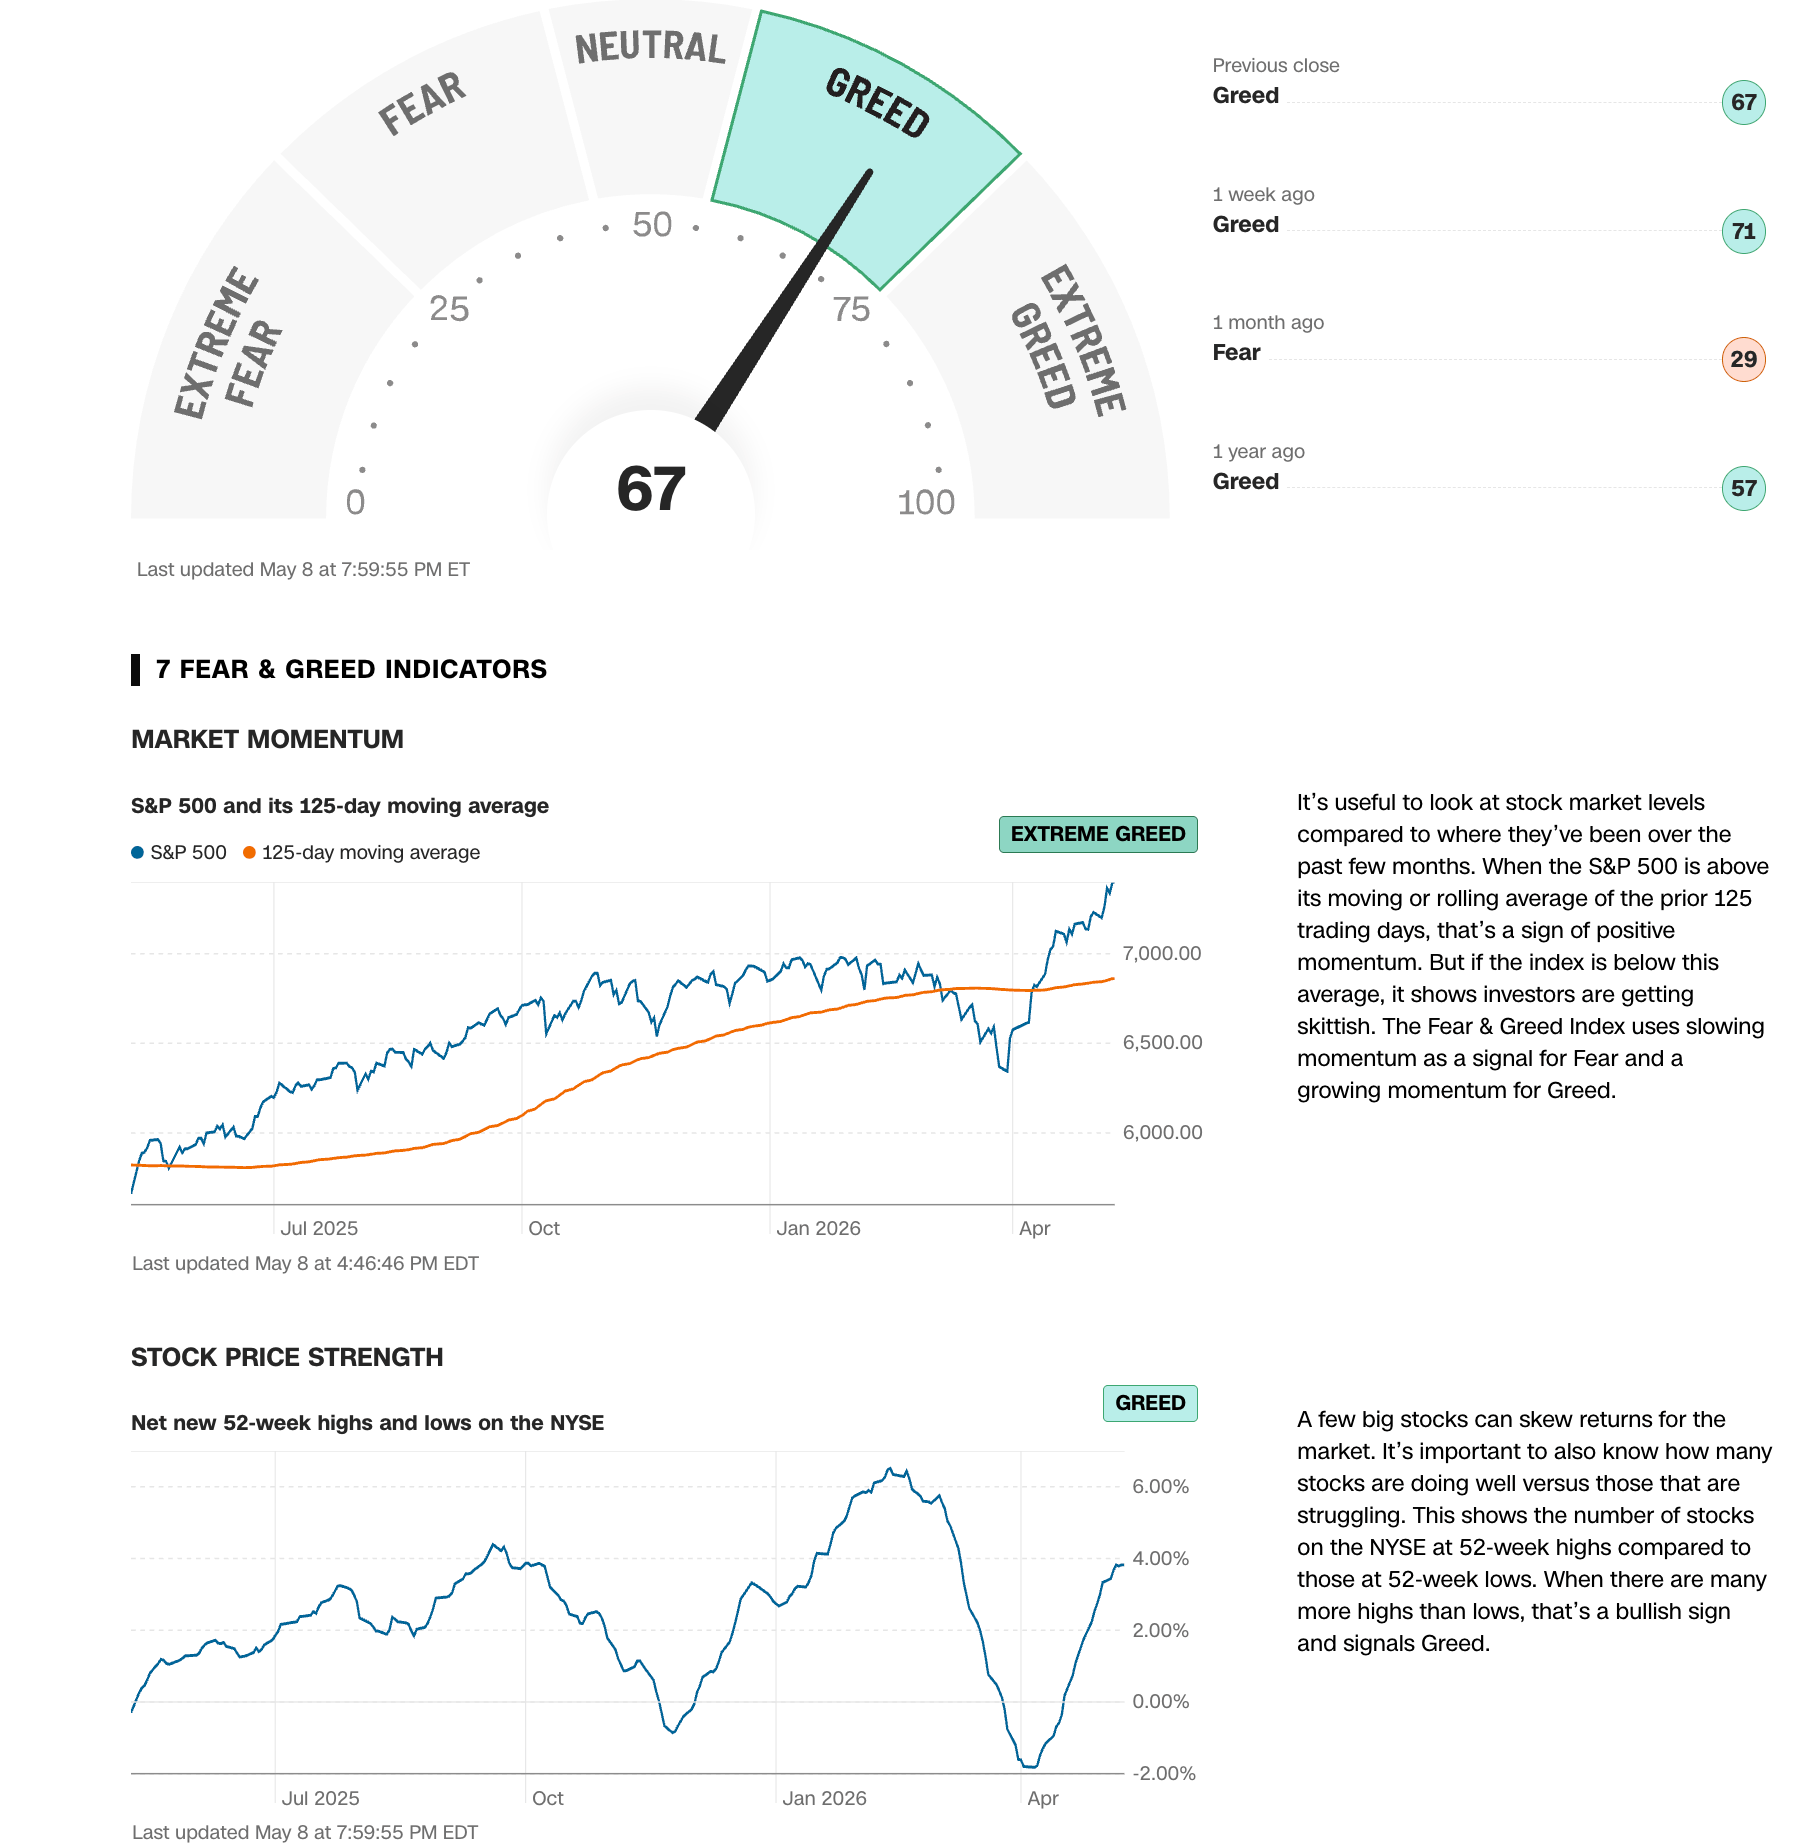
Fear/Greed Index checks in with a Greed reading based on stock prices, momo and…
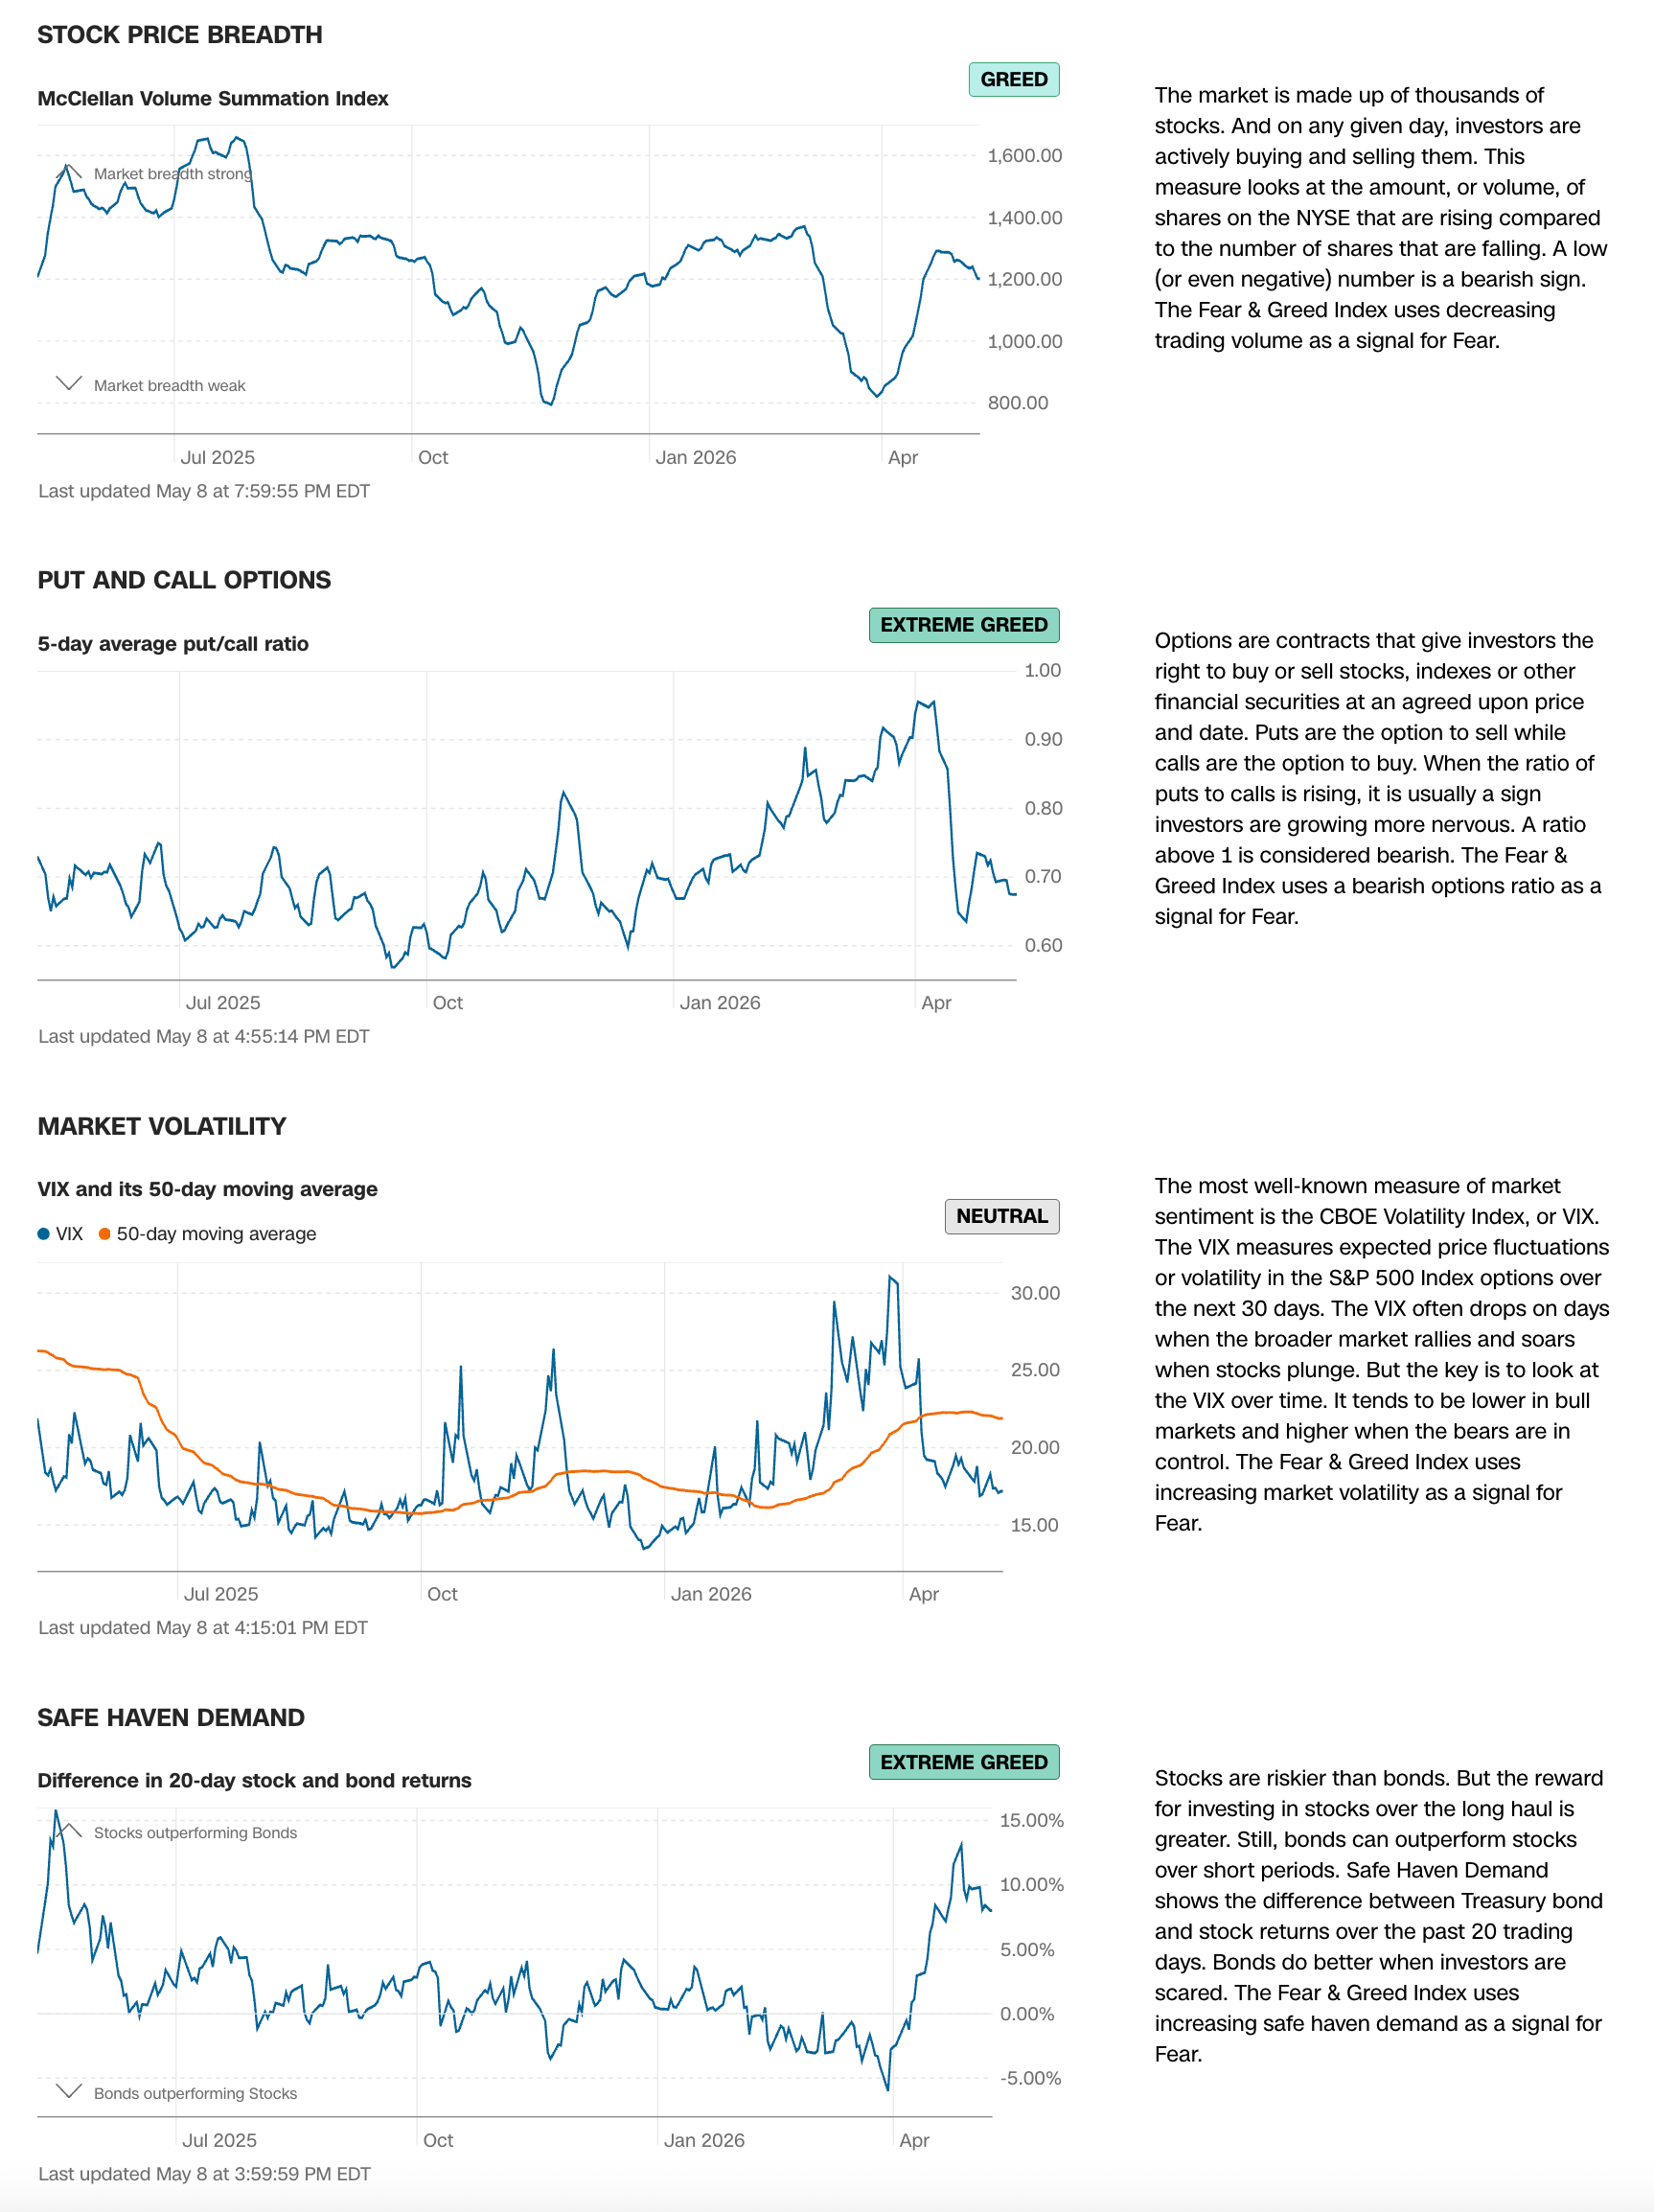
…breadth, which is rolling over a bit and should be watched as a negative divergence. Put/Call ratios are asleep and over-bullish. Same with the VIX. I may think about buying some volatility protection soon. I’d continue to filter the safe haven demand reading as being at least as much due to inflation fears (Treasury bonds sold down) as greed for stocks.
Sentiment Bottom Line
Sentiment has ticked up again in its over-bullish readings. While sentiment will ride over-bullish indefinitely with a rally, it will also be over-bullish at the time a rally ends or gets corrected. Current sentiment is not overly extreme, but not at all standing in the way of a market correction of some kind if that is what is in the cards.
Global Picture
It is beyond my areas of competence to span the globe analytically. But as previously noted, MacroMicro does help me with the global macro and in particular with country and industry dynamics. Ref. the snippet included in Friday’s notes about the AI industry.
So without traveling too far afield I want to simply continue to gauge for us when and when not a favorable view of the global environment looks good relative to US stocks. As noted previously, ACWX/SPY may have not so coincidentally made its low as a man in a red hat was sworn in promising to make America great again.

While focusing heavily on precious metals and critical minerals in 2025, I missed the general bull in non-commodity related EM. But I have been focused on China. Last week I comp’d the iShares FXI with the actively managed TDF and swapped ’em out. TDF is on a base breakout.
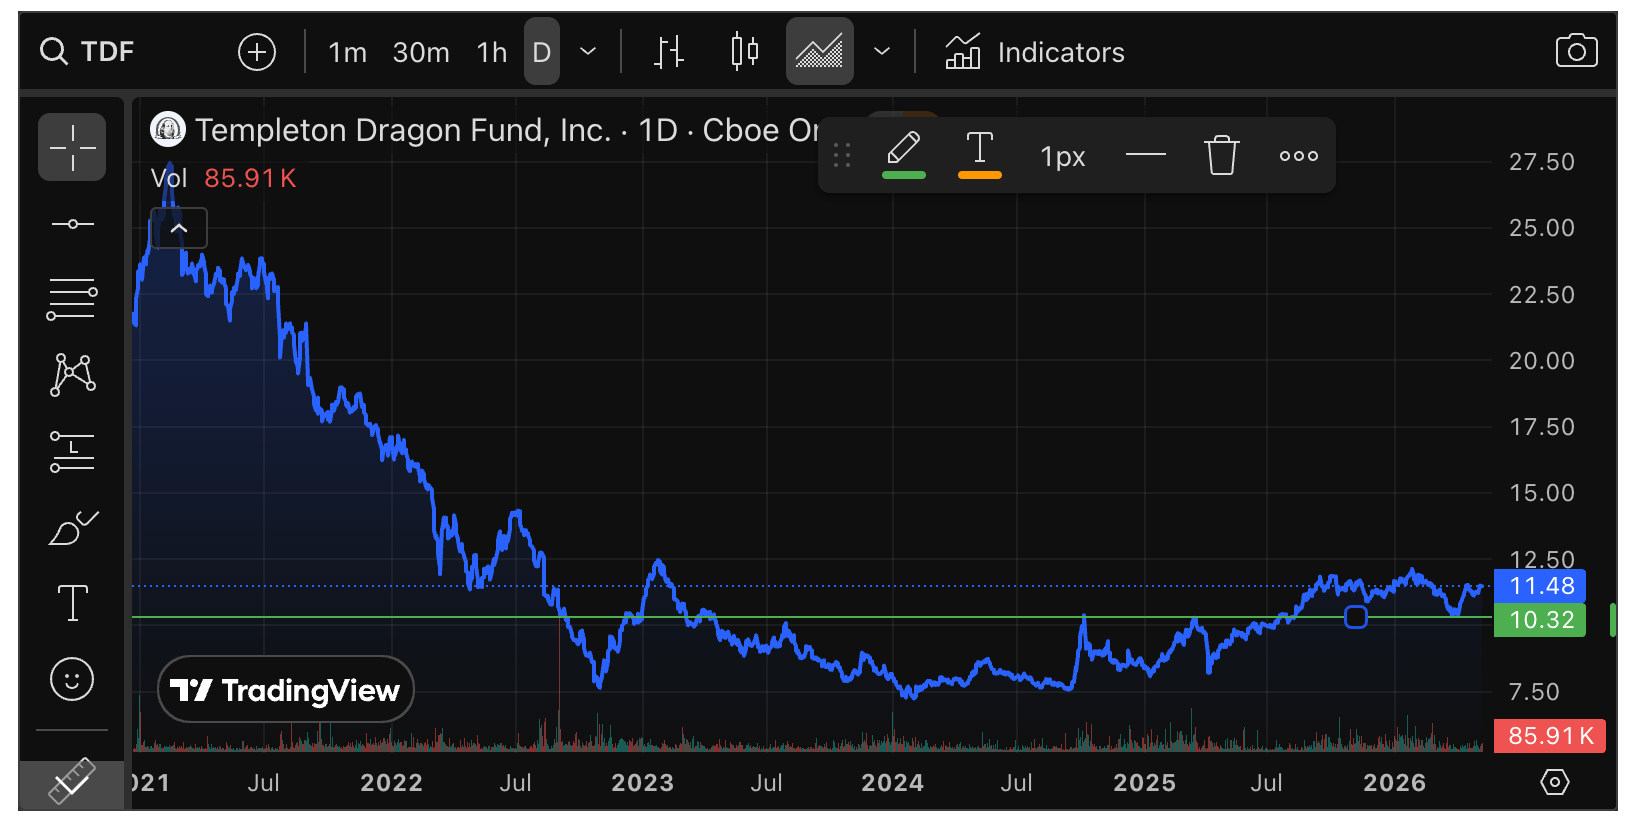
The fund is actively managed by three gentleman with intimate experience across Asia/China. I’ll take that over a passive “large cap” holder, like FXI. I like the fund’s sector breakdown as well, and I have inserted its top holdings as well.

Moving on, while I tend to shy away from much of the world (outside of the US, Canada and few other regions) where mining is concerned (for reasons of perceived risk), I don’t necessarily want to do that broadly, industry and market-wise.
Several other markets like Japan and Germany, have flown too high to chase on a macro level (again, my concern in 2025 was precious metals and critical commodities, and still is), but I am looking for situations within those markets. In Germany, for example, that meant SAP, which got creamed in the Software-pocalypse.
In Asia, consumer services play GRAB was added upon doing some research, and its competitor, SE is on watch. Japan’s Sony was added after a long tank job to support. TM was avoided for now, as it crapped its earnings.
I botched Taiwan Semi play HIMX, taking only a good and quick profit before it exploded much higher. That’s what I’m talking about though; if/as global starts to assert over the US I want to get more granular and look for bottom/value plays that could catch on. I am not now nor never will be a momo (it’s all I can do to hold positioning in my own items that are going vertical).
A lot of words, but the bottom line is that if the market’s fortunes continue to favor the global view, NFTRH will be there. There is still a dynamic in play where global market performance relative to the US depends on the direction of the US dollar.
So above we have a chart of the ACWX/SPY ratio looking like it has bottomed, and here we have a chart of USD/DXY having gone sideways over the last year with a bearish bias. If USD breaks down, it’s a good bet global stocks will broadly benefit relative to US stocks. Obviously, if it rallies, the opposite would be likely.

Precious Metals
Beginning with Newmont, and then through B2 Gold, to name the two I paid attention to, the degrading sector fundamentals (primarily from the tanking Gold/Oil ratio) did not impair at least some miners this earnings season (AEM also beat, KGC and AGI missed, CDE missed earnings by a bit but beat on revenue, etc.).
The drop in gold vs. oil occurred during the last month of Q1. These lows were generally maintained through the first month of Q2. It would be best for the Gold/Oil ratio (GLD/USO) to recover now as it is cued up to do. Then maybe the effects on Q2’s results will be muted, as they were in Q1.

On the other hand, the anticipated rally in stocks vs. gold may MAY have just ended as the (daily) SPX/Gold ratio touched its major downtrend marker (SMA 200) and recoiled from it. It could be prepping for the kind of thing we’ve seen in the past when trying to assert Gold Buggy dominance over the world of paper equity. In other words, an improbable breakthrough (because stonks… winning, duh).

However, I want to keep guessing to a minimum and actual real-time reality to a maximum. The reality of the moment is that we projected a snap-back in stocks vs. gold within the new macro. But we also projected a limit. It is certainly possible that the SPX/Gold ratio is halting and a shift back to favoring gold is at hand.
I think it is time to once again consider favoring precious metals positioning at least as well if not more than broad stock positioning. But it is unlikely to be a smooth transition. There could be some up/down grappling with the SMA 200 on the chart above.

The daily chart of the would-be leader, silver, continues to struggle with the key decision point we noted as the April 17th high of 83.06. It did take out the 50 day moving average, which was important as it closed the week that way. It’s set up. Now it needs follow-through. A successful break above 83.06 measures to the 110 area.

GDX is also set up to do a little sumpin’ sumpin’. However it failed to take the 50 day average last week and until it does, and takes out the April 17th high of 102.39, it is still in correction. As for a target if a good rally ensues? Well, there’s a big fat gap up there at 111.36.

Internally, the GDX/GLD ratio (HUI/Gold proxy) remains in the Symmetrical Triangle noted in an NFTRH+ update on May 4th.
I went over to the Indicator Charts page and fiddled around a little. I added 50 and 200 day moving averages to the GDX/Gold ratio and came up with a tolerance that should hold in order to keep alive a (thus far not yet preferred) prospect of a near-term positive view for gold stocks (the existing analysis has for a deeper A-B-C correction, after all).
The ratio is concerning in that it made a lower high before declining. But the (orange) 200 day average has been a historical support for the ratio and if it holds here, we could view the ratio as coiling in a prep for an upside breakout. Picture the SMA 200 as the lower triangle line to the red dotted one.
Very good progress by GDX/GLD last week. It held the SMA 200 and closed the week above the SMA 50. Next step to likely end the correction? Take out the Triangle and the previous high.

I would continue to have a measure of caution on the gold stock sector beyond this bounce that may well turn into a full on rally. The macro fundamentals for not only gold stocks, but for much of the investment world, are in a blender right now. We do not yet know for sure how the 3 Amigos (Trump & Warsh w/ a little Bessent in his ear) are going to manipulate, I mean manage the system.
We do know they will employ the tools of inflation, which may be good for gold, should be good for silver and would be fundamentally negative for gold mining unless gold really gets its inflation utility on and out-performs cost drivers like oil, materials, etc.
We don’t know the forward interest rate picture, let alone its effects. The economy has not really cracked (it seems more like a long, slow death rattle). But also, the BBB and the Amigos will be working toward stimulation.
But then again, there is the 2003-2008 phase when HUI rose 360% while fundamentals were eaten away at by the inflation that was temporarily driving economic expansion. HUI crashed in 2008. But 5 years was 5 years. That’s a long time.
Point being, we should resist predicting the future and resist the Sirens’ song of those who really REALLY want you to obsess on gold stocks. That is their vocation, after all. Our vocation is the financial markets.
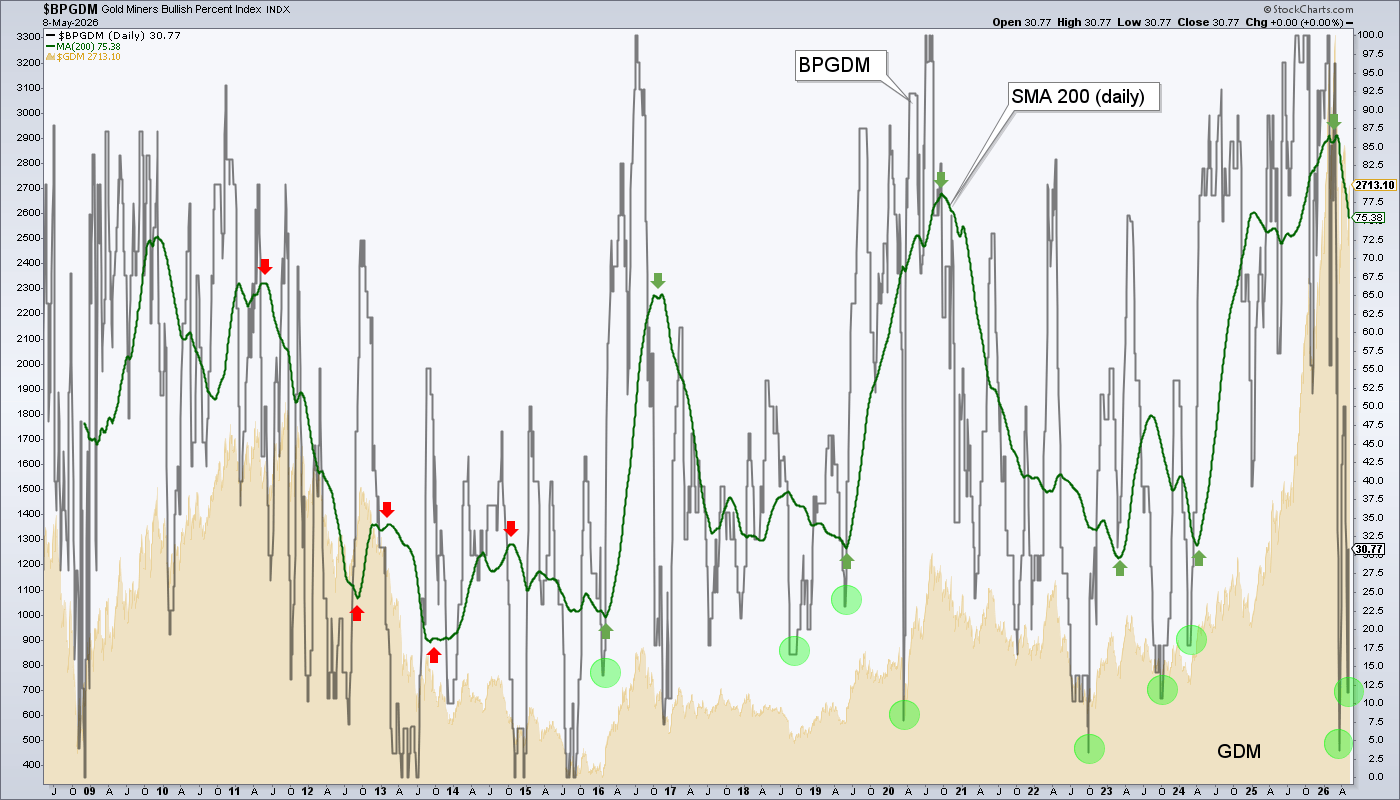
Little screed aside, the BPGDM is in a bull market. That is by definition of its 200 day moving average, which smooths the spiky ups and downs into a series of higher highs and lows. However, in uncertain times, you may not want to get caught in a flush to a low, bull market or not.
BPGDM recently registered a double-tap low. We are on a bounce that could become a real rally (ref. the parameters on GDX above). But if the SMA 200 has turned down toward a future low, a rally high could be a “sell” or “hedge” for those who are not Old Turkeys (sitting like a mother hen because “it’s a bull market, you know”).
Precious Metals Bottom Line
“It’s a bull market, you know.”
But the momentum was so extreme in 2025, the sector has earned an extended cool down. Yet typical of the precious metals, the corrections don’t come easy. Silver crashed. Gold got hammered. The miners topped over 2 months ago and remain in an uptrend above the main markers, their respective 200 day moving averages.
However, I think it will pay to keep close to the vest, and trade the rallies (or if you’re not a swing trader, understand that it’s going to be volatile and consider hedging along the way). We will use tools like nominal TA, internals like GDX/HUI/Gold ratios, macro fundamentals, overbought/oversold indicators like BPGDM and simply manage what is presented.
Technicals
Gold (4713): Has already put in a valid correction low with a test of the rising 200 day average. It lurks below its 50 day average (4781). If it takes that and the April 17th high (4891) the implication would be a new all-time high (5598 on January 29th).
Silver (80.29): Closed the week above its 50 day average (77.20). Working on the April 17th high of 83.06. Take that out and the implication would be a potential test of the ATH (121.65). If a successful breakout happens the measured target would be a lower high around 110 due to the downward slope of the neckline on the chart above. So let’s call 110 a valid “lower high” test of the high.
GDX (94.59): Still below the SMA 50. Take that and the April 17th high (102.39) out and we’d look to the gap at 111.36. Technically, still in correction.
Commodities
“Commodities” is a strange word. It is so far-reaching and vague. Anything from the most down and dirty raw materials to food, chemicals that make food grow, oil, gas, uranium that power vehicles, cities and increasingly, AI server farms (data centers) and everything in between.
I have favored critical minerals since 2023, as you may recall (beginning with REE producer MP, which has since received government funding and is adding domestic processing). Along with MP are uranium producer and REE processor UUUU, Greenland project owner CRML, Idaho (small) gold miner and large REE land package owner IDR. I hold all but IDR, currently.
There is Lithium, with SLI held and LAC on watch. Battery materials like Li and Ni were hammered badly after getting bubbly previously, but are prospective to rise going forward. Nickel, for example, has come off the bottom of a long base after holding clear support at 16,600. It is dealing with clear resistance around 20,000. TLO.TO (TLOFF) is my play with BTT.V (BTTIF) as a spec. But I want to be on watch for more.

Lithium Carbonate is also well off its lows (as priced in Yuan).

Uranium actually bottomed in 2016, along with the precious metals complex. It is on a correction now, but the objective is to make a new high. Uranium supply/demand has flipped from surplus to deficit, and like natural gas, it sees AI data centers and conventional power needs as an ongoing fundamental underpinning. Items held are URNM, UUUU, UEC and NXE was bought back.

Platinum, Palladium and of course copper (and more). These are now strategic materials in a world becoming more belligerent and divided.
This leads us to >>>
NFTRH 914 Bottom Line
To this point diversification has worked well. From Precious Metals to Semiconductors/AI to Tech to Healthcare (boo) to Alternative Energy to Banks/Financials to Cannabis, to Global and more, to… Commodities. It has been a ‘lifts all boats’ market.
But I feels ins me bones that it is time to return to being more discrete. Why? Well, I don’t know how the trend of GLP-1 impairment on Healthcare is going to go. Much like the previous trend in Weed stocks due to government regulation/laws, this could get worse before it gets better.
As for the Semi/AI stuff, it’s not going away. But when I see positions that have gone vertical I sure am not adding to them, and have started to trim them.
What I want to do is look at the bedrock more closely. The bedrock of modern life is constructed of commodities. Within that broad descriptor I want to build positions in areas that appear to be hard wired for demand in a supply-challenged world.
The bedrock (literally, it’s a just rock!) of the monetary world is gold. Silver has more relevance to the world than it did a decade ago. But to me, it’s just another critical mineral. The miners of these rocks are well in focus and I hold the favored items. It will be volatile. I may trade.
In short, it is a new macro, far different from the one that expired in 2020 and was officially pronounced dead (by your letter writer and his “Continuum” chart) in 2022. I think it is time to fine tune, folks.

Portfolios
Gold is long-term risk management & monetary value/stability in a balanced portfolio.
Taxable Savings
As noted, this account is going to take a big hit to fund the purchase of a new home that I really don’t want to buy in this market, but that we really want to buy, because it is right for us. If that makes sense. The account did a lot of (net) profit-taking last week to raise cash. Holdings may be discussed casually in the future, but the IRA will do the heavy lifting in that area.
Trading Notes
No positions. I took another quick-hit trade buying the little pattern on ZS and selling it the next day. The profit was “only” 9% or so, but the position was about 35% of the entire account, so it was a good trade and back to cash. The next day Zscaler pulled back and was added to the IRA below.
Roth IRA (non-taxable, no contributions)
The chart is ambling along, dumb and happy as it held the area I wanted it to hold and ticked a new high.

The YTD view… welp, what’re ya gonna do?

Answer: I am going to tighten up because I caught myself getting a little greedy and self-satisfied last week. Then I saw SPX at the 7400 target (not a stop sign, obviously, but still…) and soon to have far less overall cash, I want to tighten everything up, risk management-wise and focus-wise. In other words, I am probably done parroting “diversity” to you. Time to tighten up, G.
Cash is 27%, short-term and inflation protected Treasury is 32% and Equity is 41%. So in essence, cash is 59% (plus income). That is too low for the current moment and for my modus.
I will likely start by getting rid of things like Medical Device losers like MDT and maybe BSX. I already took profits on the Weed stocks. BMRN needs to get off its butt or get out. I am pretty much set with precious metals stocks for now. I’ll also need to dump FXI (in favor of the new TDF position, which will be increased on opportunity), which I forgot to do last week.
I want to continue researching and biasing positioning toward critical commodities, as well as global areas. In short, it is time to stop playing mother hen (Old Turkey) and start getting a little more strategic, while keeping my risk management game as sharp as I can. This is my current plan.

Cash & income-generating Treasury bonds are at levels that are right for me and my real-world situation. Your situation is different. Cash will be adjusted as needed.
Refer to the In-Week Notes under the NFTRH Premium menu at nftrh.com for market talk and occasional trading info, if interested. Also, you can follow on X @NFTRHgt for notice of updates.
NFTRH is not to be distributed to third parties without prior written consent
Notes From the Rabbit Hole (NFTRH) is a weekly market report in which we provide analysis on financial markets. We make every effort to provide accurate and high quality content, but this analysis ultimately represents our opinions and these opinions are provided without warranty or guarantee of any kind. See full terms & conditions of service under the ‘About’ heading in the main menu.
