
Gold Stocks
Let’s get right to the sector that is primary in our forward view of the macro change that is developing (as if on cue, I might add). It’s exciting because the proper fundamentals for the gold mining industry are finally lining up. But there is one caveat; gold is rising nominally and in relation to other assets/markets as if in a microcosm to the Q4, 2008 mass market liquidations, but it is coming directly at the hands of alarming systemic risk headlines. Any calming words from government, Fed or the banking industry itself could prompt a negative reaction in the precious metals, which are benefiting amid the mayhem.
Yet, the bank failures hitting the headlines could well be the tip of the spear known as a post-bubble contraction and as such, it will not be a good idea to guess about when a pullback might come about. I “guessed” on Thursday that pre-FOMC blip might happen and added a small position in DUST, eliminating it quickly for little damage. Had I held it the damage would not have been little. It would have eaten into my gold stock gains on that day. Another little lesson for trader Gary (the lesson being he’s at his best when sticking to his macro compass).
But that is all short-term noise. The original view was and still is that gold stocks are on the next leg of an incredibly volatile bull market that began in 2016 with the first hard leg up (launch) that ultimately failed under the weight of its own poor fundamental underpinning, as we noted at the time.
The 2020 leg was driven by proper fundamentals (gold ramping up in relation to cyclical and inflation sensitive markets), but was ultimately thwarted by the Fed’s epic and successful attempt to inflate the system.
This leg? Is the Fed ready to try to re-inflate the system (give it the gas)? No. Is the Fed about ready to get off the breaks and start speaking in dovish tones? Maybe. It depends on whether enough things break hard enough (including inflation signals) and how aggressively the risk indicators we watch (e.g. Yield Curve, High Yield spreads, Libor/T-bills, etc.) move.
Given that the Fed will be loath to clown itself for full public viewing right on the heels of its tough talking hawking, and with long-term Treasury yields (e.g. 30yr yield Continuum) still in big picture macro trend change mode, I am more than open to this finally being the post-bubble, rather than just another cyclical bubble in waiting. Fed out of bullets (at least bullets it will be willing to use any time soon)?
In other words, the 3rd leg up could actually be backed by proper and more enduring fundamentals, unlike legs 1 and 2. The upside target for the HUI Gold Bugs index is 500 as that is a logical resistance area off of an implied higher high to the previous target at 375. But as you can see, HUI is still in the grips of the 2nd major downward consolidation. However, it has taken back the support area at 230 (+/-).

Daily HUI held above the preferred support zone of 200 to 206, made a small positive divergence by RSI and popped. On Friday it poked through the SMA 50, which is equivalent to clear lateral resistance. Take that out and it likely goes quite bullish. Friday does not qualify as broken resistance, however.

Let’s take a daily chart view using our GDX ‘guide’ chart for more detail. It guided us into the most recent correction, which faked below the SMA 200 twice before exposing that as a short-term double bottom shakeout.
The recent upside volume was instigated at least in part by alarming headlines, but it looks a lot more like a launch than a blow off. In other words, for whatever reason there was buying conviction at the support just below the SMA 200. As the chart notes, that level was also a solid 62% Fib retrace of the previous rally. The only short-term point of concern I’d have is Monday’s gap up from the SMA 200. But with that volume and the very short-term trend change, it may be a ‘breakaway gap’ not destined to fill any time soon. It is a reason I took the ill-fated DUST position, however.
The correction came on the cue of the “Golden (bullish) Cross” b/s as would normally be the case. A valid support/Fib area was ticked (incl. the SMA 200) and now volume has turned up with RSI positive and as noted in NFTRH 748, MACD that had a positive look to it. As a TA looking only at the chart and not listening to a thing out there in the markets, GDX will look for new highs above the January high and likely go on an upside gap filling mission, three of which you see on this chart. The short-term key to that is for GDX to hold the SMA 50, which it poked through on Friday, and turn it to support.

Precious Metals
Well what do you know, we finally have Commitments of Traders data! And during the time away gold’s situation showed that speculative sentiment had eased but certainly in no marked fashion. It’s okay, though. Certainly not a rally show-stopper.
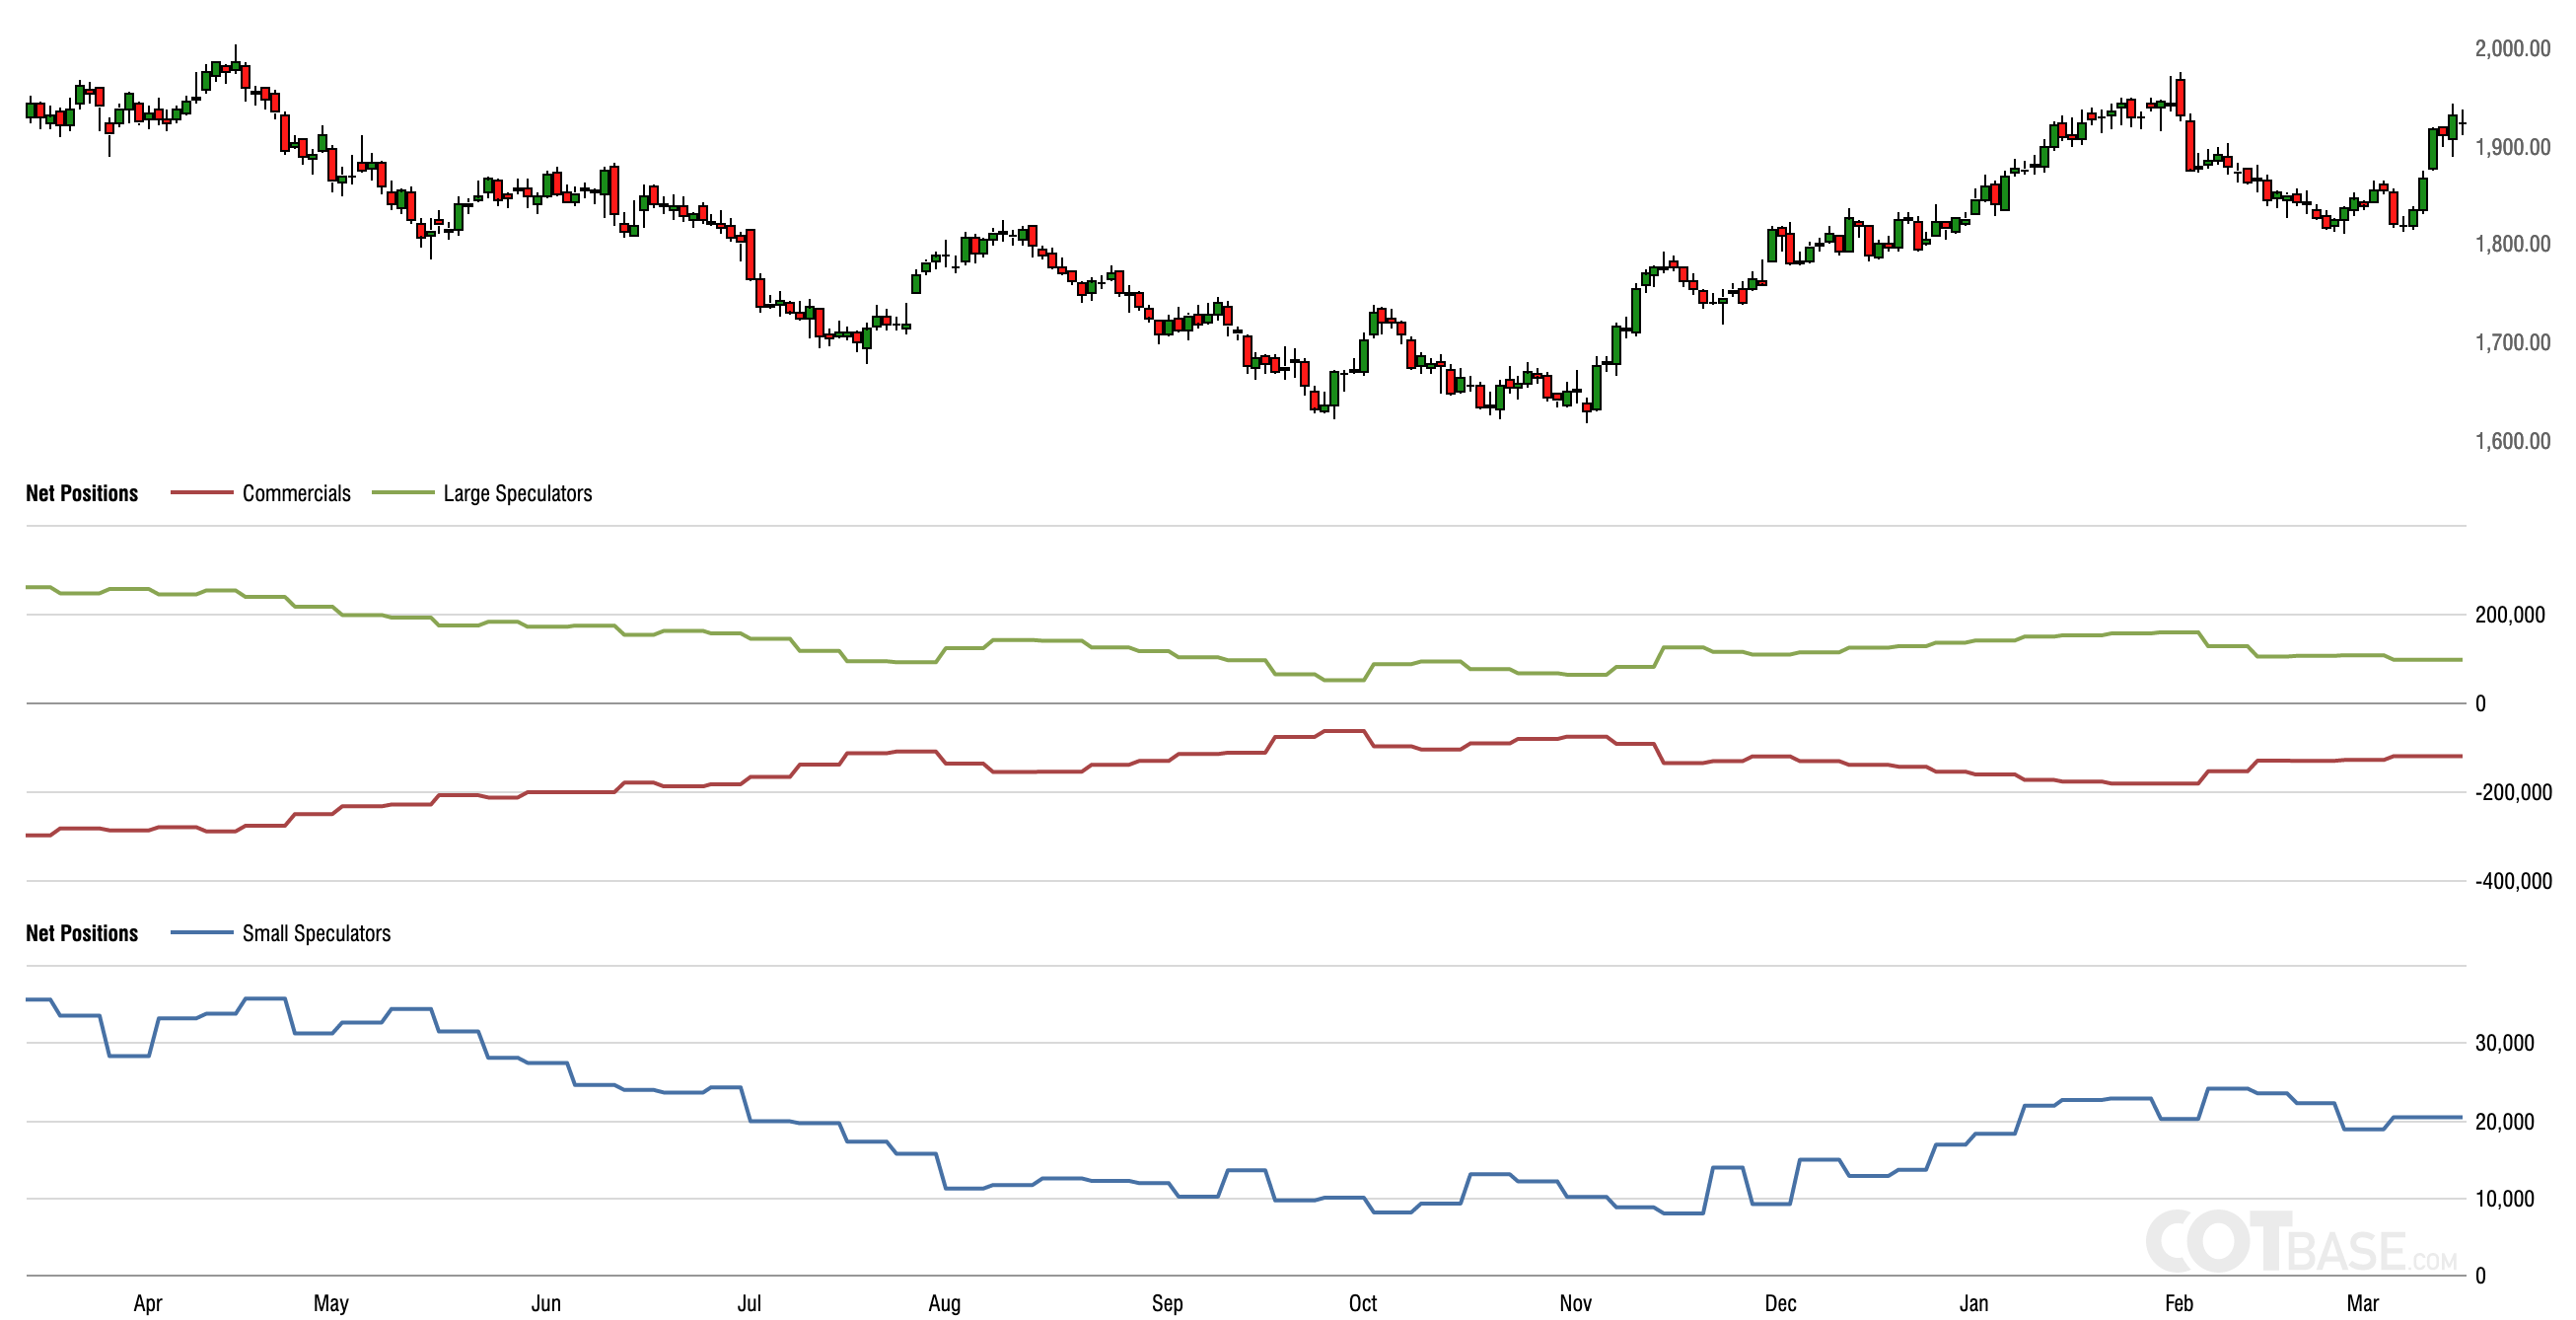
Silver’s CoT is where it gets interesting. With Commercial traders having covered net shorts to near even and large Specs having come out to the same degree, any move in silver now would have some solid sentiment backing. Recall here the deep discount to NAV that Gold/Silver bullion holder CEF is trading at. If I were to guess, I’d say the lack of enthusiasm is among inflation bugs on the run from copper, oil, Ags, etc.

Speaking of CEF, a daily chart was shown in the Trade Log highlighting that discount to NAV. Dialing out to the big picture view we see that the correction (handle) is doing its job. That job was to mute the enthusiasm of gold and silver investors. The lower panel shows an ongoing discount to NAV. The implication is that if we are right about a coming next leg up (handle breakout) there is a lot of potential FOMO/MOMO fuel in waiting to drive CEF to new all-time highs. I plan to add to my position on opportunity while it trades at a discount.

Technically on the short-term, if Silver is going to have any pre/post-FOMC difficulty, it is currently parked right at a spot for that. The silver price false broke below the SMA 200 and preferred support, took all that back and rammed upward. Now the test is on back at the old “22.57” proving ground. With FOMC on deck.
Technically, the daily chart shows a “Golden Cross” (ha ha) of the SMA 50 above the SMA 200. It also shows the nearly inevitable move down to punish Golden Cross believers. But with that cross what it also shows is an attempted trend change, which is still obviously in process. A Golden (or Death) Cross is a decent indicator of a trend change, but only after the punishing move in the opposite direction of its implication.
So the bullish view includes a Golden Cross now released of its hype baggage! If/when silver takes out that SMA 50 and leaves it behind dollars to donuts silver will enter a new daily uptrend. That would be proven by taking out 24.78, which was the high ticked during that consolidation cluster from December-January.

Gold never made it to the SMA 200 on the downside, as it was relatively strong (which makes sense to its CoT relative to silver’s) on the pullback. It is at what does not appear to be a particularly imposing resistance point and in ticking a new high for the year, has sent a scout up above in search of a test of the high from a year ago and so too, an all-time high (2089.20).

Okay then, let’s include a monthly chart for a big picture bullish view. We have been managing the Cup in essence since gold broke through the Bull Gateway at 1378 (it was actually a bowl back then said the man who stares at charts) in 2019, and its sloppy Handle since projecting the need for a correction at the hysterical and overbought 2020 high. While I am the guy who calls gold “a lump of value” that we should not cheer the price of, the measured target established by the 2020 break to a new all-time high is 3000+. It’s a measurement and projection. Not a promise.
But nothing has changed with that bullish big picture view. To boot, monthly RSI is now positive and MACD remained positive and has now up-triggered. Gold is technically bullish, and has been on a big picture basis since 2019. Note also that the more times a market tests resistance the weaker it tends to become. Gold appears to be making test #3 of the highs and with reference to RSI and MACD, it has implied fuel now to get ‘er done. Am I sounding hysterical? I find it harder to call bullish than bearish because I have an internal imperative not to sound promotional. But big picture bullish is what I am compelled to call on gold and silver at this time.

As for gold stock holdings I took a large profit in AGI as I got squirrely about the sector a couple weeks ago. So in a perfect world, AGI would still be here at the head of the list of my holdings. But it is not. It is however a solid gold miner in mostly favorable locales. So it is included with the “quality miners” I want to be associated with and may yet once again be associated with if a buying opportunity materializes. A warning about the Men Who Stare at Charts…

…they sometimes see things that don’t exist or cease to exist (like the H&S I saw, which failed to lose its neckline and promptly repaired itself).
Currently held (in order of position size): CEF (Au & Ag bullion fund), AEM, MAIFF (MAI.V), BTG, NEM, OGNRF (OGN.V), SILV & MAG.
I am obviously interested in increasing CEF and/or adding PHYS (gold) over time. As for gold mining, I want producers due to the macro fundamentals that imply forward earnings improvements for operators. A classic precious metal bull market sees juniors/explorers perform late in a cycle. I think we are very early in the next leg’s potential up-cycle.
So I want to increase AEM, BTG, NEM and maybe MAI and keep an eye on KGC, HL, GOLD and maybe outliers that could see turnarounds like WDOFF (WDO.TO), NGD and SSRM. But the well known entities like NEM, GOLD, AEM, etc. are where the big funds are likely to flow once the market gets on our macro theme. I also like tweener BTG, obviously, especially after it took over Sabina Gold & Silver’s (SBB.TO) development and AGI, as noted above.
As for speculation, I’d consider increasing positions in SILV and MAG. But I think I want to keep the list relatively compact and if possible, mostly away from unsafe political jurisdictions, which for me means LatAm in general (example: RIO.V/RIOFF) due to political impacts that can seemingly come out of left field (pun not intended, but there it is anyway).
There is always GDX too, as a way to just own the sector and not worry about any individual miner’s execution.
US Stock Market
Goldilocks endures. Frankly, I am a little bit in disbelief as to how well it is working because it was improbably projected and the type of forward view that I myself had trouble believing because it made so much sense. What sense did it make? It made sense that Tech, including some very high quality companies, had been beaten down so badly in large part by the interest rate ramp job to the upside that attended the inflation the Fed created.
It was time for a rally as noted in Q4, 2022 as sentiment, mid-term election cycle, fading inflation/dove flipping Fed and seasonals combined to indicate relief and with the bombed out situation in Tech along with its disinflationary Goldilocks preference, Tech should lead. Well, Tech led. And it is still leading. While wobbling a bit lately, Semi is still leading Tech as well and Semi is firmly leading SPX, itself not yet broken from its rally stance.

But leadership of another kind has contributed to flipping the relative script in favor of Tech. Markets are obviously seeing this as a trigger to a dovish Fed and dovish Fed hopes were one of our original rally rationale as well. More market risk indicator updates are below the SPX chart.

So my positioning is in Tech. Within that, Tech that is performing operationally. Including sub-segments like Cloud/Security and a sexy side order of AI. Favored stocks are CRWD, ANET, FTNT, PLTR and MSFT, with OKTA added and an eye on items like ZS (suffering compression of its formerly extreme and still rich valuation, but the bottom feeder in me can’t help watching this Cloud security company that is not unlike CRWD).
Other than those items, QQQ is held and that seems a solid way to go because the view of this rally is “interim” to a next leg of an ongoing bear market. Not an investment. Eh?
SPX: It Don’t Come Easy
This is a downtrending chart that barely clung to the life given it by not dropping below the 3764.49 bear trigger (December low) that would likely signal a reentry into the bear market if lost for more than a day or two. But SPX, weighed down by Banks/Financials and the recently cracked Energy sector, among several other under-performers, has held its grasp on intact status for another week. What’s more, if a sector like Energy (for example) were to rally anew (ref. NFTRH+ update on Friday) it would be helpful for this this multi-sector broad market view.
SPX dropped hard below the SMA 200, maintained a higher low to December and tentatively poked its way back above support before getting hit again on Friday. No, it don’t come easy. But it is still intact and hence, so is the Q4-Q1 rally theme; especially considering the intact leadership noted at the beginning of the segment.

Warnings & Indicators From the Bond Market & Sentiment
High yield spreads are spiking. This is consistent with the systemic fears bubbling up to the surface lately. As yet it’s a spike, not a trend. It bears continual watching.

Libor to T-bill spread is also on a spike with the banking sector stress. Logical and right. But not something that has not happened before in the current bear market (2022). A break above here would indicate a big caution signal. For perspective, the 2020 spike was only arrested because of the Fed’s balls out inflationary operations. They are not in that position now. At least not with the same mechanics that were present in 2020.

The real yield on the 10yr Treasury note appears to have topped. This is consistent with the current Goldilocks theme and as a side note, certainly helpful for gold as well.

The 10-2 yield curve has also spiked with the rush to the liquidity of short-term Treasuries relative to long-term Treasuries. The trend is still down, but the spike in this risk indicator is similar to those of the first two charts above. We are on a ‘warning’ spike in the macro. But ironically, this spike in angst and defensive behavior could also serve to reset the Q4-Q1 rally’s sentiment profile to contrary bullish. Theoretically, the market could use this sentiment lurch to its contrarian advantage, especially if the Fed blinks this week.

The 2yr Treasury yield illustrates how volatile the macro backdrop has been since we began managing the change from inflationary to dis/deflationary. I mean jeez, who needed that interim upside head fake as opposed to a nice, normal breakdown in inflationary market signaling. #painintheass, if you ask me. But break down the 2yy did and this is consistent to the dis-inflationary rush to liquidity by casino patrons.

The chart above could also signal a couple other things…
- Relieved pressure on the Fed to keep hawking and
- The initial downturn that could lead a divergent hawking Fed hanging out to dry prior to the next bear market leg. Remember that bear markets have tended to begin (in this case it would re-emerge) after the Fed overshoots and the 2yr diverges downward.
To that second point, this chart shows the Fed tracker, the T-bill yield with the 2yr yield. If the 2yr really is on its ultimate downturn it should only be a matter of time (which can be measured in months) before the bear market resumes. Indeed, there is a case where (in my opinion) “they ain’t seen nuthin’ yet” from the bear side.

The Q4-Q1 (and possibly well into Q2?) rally is likely a major bear market suck-in. So many times along the continuum of the Fed’s inflationary operations it was as simple as ‘casino patron see market tank, casino patron wait for bailout’. But our Continuum is one picture arguing that what has been may no longer be. At this point the primary message I get from this chart is that something big changed from the decades previous and that autopilot thinking that depends on that former continuum of declining yields should be avoided. The key point is that in my opinion, the decades long downtrend in yields gave the Fed license to inflate. Now? Not so much.

On to the market sentiment backdrop the Smart/Dumb money sentiment chart shows a big drop in Dumb money indicators and finally – after noting its flat status last week – a big spike in Smart money indicators. So folks, we have an unbroken SPX and a now contrary positive sentiment structure. Market sentiment is potential kindling for whatever spark might reignite investors’ spirits. FOMC, you’re up.

Others at last reading:
AAII (individual investors): Deeply negative and contrary bullish.
NAAIM (investment managers): Hard pullback from previously over-bullish sentiment. Now contrary constructive.
Investors Intelligence (newsletters): A moderate pullback in sentiment but still middling. Newsletters do not tend to be as skittish as the above. They tend to stand behind a given view more firmly because, in my opinion, they are not managing their own or other peoples’ money as are the above. They are prognosticating on the markets. Sort of like your letter writer is doing in this report.
Sentiment Bottom Line
Contrary bullish now. What that means is that if a rally resumption is in the offing sentiment certainly is not a standing in the way. It could act as fuel.
Global Stock Markets
I am not going to spend too much time on this because it may be as simple as USD breakdown, global outperform and USD re-bull, global underperform. In other words, watch USD. The World (ex-US) ETF should hold right here at the SMA 200, otherwise it would tick a lower low and raise a significant warning on the global market (on balance, obviously with fluctuations within it depending on individual markets’ character, macro fundamentals, etc.). Personally, I don’t have much interest in global markets at this time because I am seeing NDX and SOX in the US more clearly, and also due to the view that it’s all a bear market rally, i.e. interim, temporary in my opinion.

Curiously, despite the drop in USD recently, global in relation to US has not shown a spark, unlike gold for example. The ratio is a potential post-Golden Cross trend change but if so, is taking the obligatory post-Golden Cross drubbing first.

Commodities
CRB Index: Finally after too many months of this b/s at the downtrending daily SMA 50, a breakdown. Longer-term charts show the next support level at 240 (current price: 254). CRB could get a bounce if the Fed stops hawking and markets get a relief bid. Strong support does not come into play until the 200 level however, and I generally remain interested in things other than commodities on this Goldilocks phase insofar as I’ll remain interim bullish on markets.

Crude Oil & Natural Gas: If we are looking at the Energy stock sector for upcoming bounce potential we should note that the downside target for Crude Oil is about 61 (current price: 66), where there is support defined by the 2019 highs. I would not be surprised by a hard bounce in oil from at or above 61. NatGas has crashed back near support dating back to the 1990s. While the price chart is not indicating anything actionable, there is a small RSI divergence and this bombed out play could certainly participate in any commodity sector relief that may be out ahead. I’ll take a mild interest in Oil and a few Energy stocks going forward.
Copper/Industrial Metals (GYX): You have no idea how pleasing it is to me to finally see Doctor Copper crack because it is (IMO) the easiest non-precious metal for commodity touts to promote (China reopening and low warehouse levels), and well, I care more about macro signaling than copper’s warehouse levels or China’s latest economic news. The macro signaling indicated by this breakdown in the Copper/Gold ratio is exactly on plan with our favored 2023 macro.
Copper/Gold daily has broken down from the intermediate uptrend channel and it did so where it was supposed to, at clear resistance (I believe ratios have support/resistance, etc. because they are the product of two markets that have those attributes).

Copper/Gold monthly shows the head fake spike in February as an upside blip after tremor of inflationary hysterics hit the markets and then a drop back into a consolidation cluster. Importantly, that cluster comes after a breakdown from the latest big picture decision point, which Copper/Gold has once again failed (red resistance zone). No personal interest in Copper or Industrial metals at this time. Much personal interest in this macro chart indicating our preferred backdrop is asserting for 2023.

Uranium: u3o8 price has been going sideways for nearly a year. Uranium sector (URNM) has dropped hard to oversold levels and can bounce on relief as well as the next guy. But as with other commodities and inflation trades, little current interest as I can see technicals on the Nasdaq much more clearly as being something other than oversold and bombed out. Uranium is a special bigger picture interest, however. So I’ll stay open to it at all times.
Li, Ni, REE, Pd & Pt: No, no no, no and no! Lithium price is going hard down now. ALB & LTHM have gotten hammered. <insert here> comments about how any of this stuff can bounce hard with broad market relief, but little personal interest at this time due to waning inflation trades. Nickel is at support from its lows last summer. I have TLOFF (TLO.TO) on casual watch for its Tesla/battery metals angle. Rare Earths see REMX oversold within its gentle downtrend and preferred REE play MP getting there (on watch as a special situation). Palladium bounced, got hammered and is still fully trending down. Platinum continues to look more like silver than its fellow PGM. It’s a potential trend changer above its SMA 50. But little current PGM interest.
Agricultural (GKX): On a little bear flag rise at the moment. As a whole the Ags have rolled their major daily trend (SMA 200) over and are also resuming the intermediate downtrend. No current interest.
Commodities Bottom Line
Why, they are inflation trades! You expected anything different? Well, I am sure that inflation rooters are still out there trying to keep the troops rallied, and indeed they’ll probably get a bounce at some point. But if our view is for inflation signals to drop (it has been for a majority of the last year) then our view should be negative on commodities in alignment with that macro.
Here we find those lumping gold, silver, copper, tin, hogs and soybeans all at once (the ‘protect yourself, buy real assets, buy resources!’ autopilot thinkers) to be exposed as, well, wrong.
Currencies
USD is at the support defined by its daily SMA 50 after halting at resistance just below the SMA 200. The Gold/Silver ratio has rolled over along with it. That is logical. If the Fed follows a dovish script and talks softer about inflation or louder about systemic issues (banking) these could break down with a relief trade.

You may recall that we also reviewed a weekly chart of these two and darned if a theoretical leg ‘B’ has not come about for USD. I have not touched this chart since it was created and if you look closely you can see the USD price doing exactly as we had projected (okay easy now, it’s more luck than anything). But the larger point is that if this chart projection continues to track accurately, a leg ‘C’ could croak much of the macro, especially the inflation stuff. But it could also pressure the precious metals if the Gold/Silver ratio also were to rise in tandem.
While my artwork on the chart was random and not likely to stay so in form with the USD price, it does argue about why I am keeping a level of caution about FOMC week. What, may I ask, happens if the Fed takes this as an opportunity to show how committed hawkish it is, playing tough guy?

The daily chart cavalcade of global currencies reflects the pullback in USD with a bounce in some currencies. Interestingly and logically, the commodity currencies (Canada & Australia) are still trending firmly down. The Yen is relatively strong and the Euro appears vulnerable even after the ECB’s rate hike.
Swissy (CHF) and the British Pound are relatively okay, but neither is what I’d call overly bullish.

Speaking of the Yen, could its old “carry” trade bid be back in play with the US banking sector troubles and the global macro implications it holds? I have not included this chart in probably the last couple years. But Yen has formed a pattern from its lows that is similar to the one Gold is forming near its highs. I wonder if watching the Yen from here on might be worthwhile as, among other things, a confirming indicator to gold after the broken correlation from 2019 to 2022.

Finally, have a look at weekly Bitcoin. To me it is still just a speculation, but with the retake of support and the projected market relief rally we targeted 30000 for said speculation. It is well on the way. If/when the general broad bear market resumes, we may yet see BTCUSD at the major support target of 12500 to 10000.

Portfolios
Holdings balanced by gold held for the very long-term.
Trading Account: Long QQQ and cash. I envision this account coming into play one day if I see extreme upside euphoria, “bear is over, happy days are here again!” type stuff. I’d consider going all in bearish with this small account. But for now, the play continues to be bullish via QQQ, considering casino patrons’ now over-bearish mindset and the constructive technical status of NDX/QQQ. But FOMC, you’re up.
Roth IRA (non-taxable, no contributions)
Cash (incl. bond equiv.) is at 85% and that is a perch from which I am evaluating what to expect from the FOMC this week. The potential problem with that stance is that an overt dovish flip by the Fed could ignite a spike rally across assets. But as already noted, an unexpectedly firm Fed could ignite disappointment. I see gold as especially vulnerable if that second thing comes about because it has been so stellar amid other assets leading into FOMC.
Of note, CME Group traders see a 38% chance of no rate hike and 62% see a .25% hike.
Regardless, it’s going to be a noisy week, one way or another. Depending on what I see/feel/hear/sense pre-FOMC, I’ll tweak accordingly. But the macro as it stands now appears bull biased, including gold, obviously.

Cash & income-paying Equivalents are at levels that are right for me and my real-world situation. Your situation is different. Cash will be adjusted as needed.
Refer to the Trade Log under the NFTRH Premium menu at nftrh.com for trade info, if interested (not that you necessarily should be). Also, you can follow at Twitter @NFTRHgt for notice of updates.
NFTRH is not to be distributed to third parties without prior written consent
Notes From the Rabbit Hole (NFTRH) is a weekly market report in which we provide analysis on financial markets. We make every effort to provide accurate and high quality content, but this analysis ultimately represents our opinions and these opinions are provided without warranty or guarantee of any kind. See full terms & conditions of service under the ‘About’ heading in the main menu.