It’s time for another online edition so that I can more comfortably streamline, talk a little more casually and get more done sooner on a holiday weekend.
Daily market viewing vs. larger trends
I know I am not the only one who gets mentally whipsawed and tossed about sometimes on the market’s daily moves. Yesterday’s post-payrolls reaction, for example. I held SPX short fund SPXS (among a couple shorts on individual stocks, which I held on to) but I looked at the market, saw short-term support, over thought the situation and perceived potential for a stronger bounce. Due to my makeup that is ill-equipped to be short in a rising market I defaulted back to cash. Then the market again did the logical (that word has appeared a lot over the last couple of weeks) as SPX failed at the SMA 50.
As thinking humans watching the markets it can be easy to over-think. As a cold big picture manager it should be a discipline to always keep the trend view as the bedrock one. The US stock market (along with most global markets) is in a bear market by definition of its trends. That is something we’ve known. It is the important view.
Just for fun, this chart flips SPX, NDX, DJIA and SOX over to their inverse selves and shows the January bottoms (tops) in markets and subsequent uptrends (downtrends). The summer rally (correction) bent but did not break these charts, which means that it did not break the bear market. Looking at this view you’d say ‘new bull (bear) market intact’ after its first big test. It’s a bear market as long as long as the trends say so.

US Stock Market
The daily chart of SPX shows the SMA 50 and SMA 200 each sloping downward after the ‘death cross’, the inevitable rally to screw knee-jerk traders reacting to the death cross, and then the failure. In June-July we noted over-bearish sentiment and the likelihood of a bear market rally, which finally ground into being in July. Then? Well, there’s the logical rally termination point right at the down-sloping 200 day moving average in August.
More logic? SPX sits on short-term support. So who wins out here, that support as grounds for a bounce or the SMA 50, which resisted the market on Friday, as grounds for a resumption of the correction? Beats me. What doesn’t beat me is that the trends are down and it’s still a bear market (our minimum downside target being the 3100-3200 area per support not shown on the daily chart).

The chart below shows other aspects of the market in the same boat. Even ‘Value’ stocks, which financial advisers often put their clients into along with Consumer Staples, Healthcare, Utilities, and tragically enough, bonds, etc. because they are more defensive.
A true bear market will take down most if not all of these items (bonds being a wild card as they’ve been bearish on this cycle, which is not traditionally the case in equity bear markets), but the buttoned down investment community will usually rotate ‘defensive’ rather than put clients into cash (which is interest bearing on this bear cycle). Wouldn’t want your clients to get the idea they can do it themselves by simply opening a money market account, would you boyz and girlz?
I digress. It’s a pervasive bear market. These items are at a short-term support cluster. If they’re going to bounce prior to the next lower low they need to do it now.

Sentimentrader’s Smart/Dumb money indicators agree. Smart money ate the market last week and dumb money puked it.

Check out how aggressively investment managers (NAAIM) barfed the market even before the week ended on its down note. Turns out they were once again good predictors of a down move to come. Indeed, NAAIM have jerked southward even more strongly than stock prices and this is another indicator advising that the market can bounce in the very short-term. But the trend is down and in that, NAAIM are not contrary indicators. It’s a view of bursts of enthusiasm and bouts of depression in a bear market.

Investors Intelligence (newsletter writer survey) and AAII (individual investor survey) each pulled back as well, with AAII spiking hard down similar to ‘dumb money’ and NAAIM above.
With the seasonal turning negative by mid-September it would be logical for today’s sentiment setup to lead to a bounce into mid-month and an oncoming FOMC that is not pretending it wants to kill inflation. It needs to kill inflation or die trying.

With the idea that sentiment is a condition that is in place for a bounce I am still holding the Cannabis MSOs, of all things. Here is a weekly chart that we have used in the past, currently showing a sector that, in a vacuum, is making a bottoming attempt.
Does the sector know something about coming Federal policy? Has the sector simply had enough selling over the last 1.5 years? Or is it a bear market bounce only? All valid questions. But with the possibility that the US stock market could hold together for a week or two, I still hold CURLF, CRLBF and TCNNF but not yet as a die hard investor by any means.

Taking a wider view of the US market, let’s go back to daily charts of various ETFs. This chart shows items that would tend to prefer higher Treasury yields (XLE, XLI, XLF) and one that would not (XLRE). Yet it’s all the same bearish situation. So to repeat, it’s a pervasive bear market. Rotation is not working well.

Again, more market segments trending down. Consumer Staples are somewhat of an exception but XLP made a spike and failure at the convergence of its SMA 50 and SMA 200 (the latter not shown) on Friday. It’s neutral, bear biased.

Early on we used the loss of Semiconductor sector leadership as one of several warning signals. That leadership continues to be to the downside. It’s a cyclical sector that will likely start to turn up in relation to others when it is time to call an end to the bear market. Meanwhile, another leading indicator, NDX/SPX looks brutal.

Global Stock Markets
Here we find the global down-trenders with Japan and India still trying for ‘exception’ status. Note ‘commodity/resources’ countries Canada and Australia turning back down within their downtrends.

More down-trenders, with Brazil making an attempt at ‘exception’ status. That’s curious since it is considered a commodity/resources market. The ultimate market for speculative commodity/resources related stocks, Canada’s TSX-V, is slithering along its SMA 50 within a downtrend.
None of it looks very good to my eye, and I am including Brazil and India and if it loses its SMA 50, Japan’s Nikkei as well. Or at least I have no interest in speculating long global or US markets for that matter. Not if I keep the main theme of a global bear market in mind (which I do). Short-term trades are one thing. Longer-term structures are down.

Stock Market Bottom Line
It’s a pervasive global bear market. As for the US, FOMC meets on September 21 and there is room there for a market bounce. But it’s a BEAR market bounce if it happens. After ‘payrolls’ Friday CME traders expect a .75% rate hike to 3% on balance.

For the Fed, the act of following the bond market to raise rates is also the act of removing the incentive they gave casino patrons in early 2020 to go forth and speculate. It’s the opposite situation to then. ‘Logic’ would hold that the Fed knows it created the bull market and also knows it’s creating a bear market. Just the cost of doing business to them. It is up to us to be smart. It’s not like Daddy Jerome is going to coddle us and hold our hand.
Cash will soon be paying close to 3% interest and you’re not getting that return from many other assets in 2022 for equities and over the last 3 months for commodities/resources.
Precious Metals – Gold Stocks
This is a tough one. On the one hand we have incomplete fundamentals (but if stocks and commodities tank you watch how those funda slam into place) and poor technicals. As to the latter, you’re not always going to catch a bottom or a top by using charts. As an example, in January of 2016 gold stocks (HUI) tanked from an already bearish and bear trending state, then immediately reversed to a big rally into summer. In other words, it was a false breakdown and shakeout.
Sound familiar? Per the August 29 update we noted a breakdown from a little bearish pattern would target the 178 area. Later that day an already bear trending Huey lost the neckline and then proceeded to dump to 180 on Thursday. Close enough for government work? Maybe. It then reversed upward. So while I am loath to get on the Good Ship Goldbug with any kind of resolve just yet, I keep the 2016 event in mind as a possible template.
For reference, HUI was updated to the current situation on Friday.
Here is the bigger picture deal though; the 2016 event soon proved to be invalid (other than as a major suck-in) because it led commodities, stocks and a whole raft of reflation markets upward that year. By May we were noting a bearish macro situation amid over-bullish touts, especially by inflationistas, as cyclical markets had begun to re-bull. This led to a top in the PM complex that summer and another bearish 2 years in the desert.
Does something else sound familiar? It should. It’s been just over 2 years since the sector’s foremost touts unwittingly called the top in 2020. Ref. the classic buy of a gold stock by Buffett and 3 Twitter influencing Stooges falling all over themselves to tout it. Boink! A top.
Interlude – Heavily Followed Twitter ‘Influencers’
 Speaking of Twitter influencers, it cannot be stressed enough how dangerous these people are to less experienced people reading them for anything other than comic relief. On Twitter you are judged as more substantial by the number of followers you have. For the life of me I cannot figure out how they attract tens of thousands of followers by simply tweeting bias-reinforcement, but they do.
As we’ve learned by the rancid political realm (on both sides), Twitter is a dangerous place for the truth. Indeed, in my opinion it’s where the truth goes to die. It’s where hyperbole, bombast and bias go to thrive.
But another aspect of it is that it is a place where the truth, backed by constant sloganeering and emotional declarations, can bring a lot of pain before it ever actually plays out some hazy day out in the future. In other words, a gold bug or inflationist vision may well play out one day but constantly being rallied to hold the line (on the ideology) and/or called to action on it is dangerous at any given time unless it really is ‘the big one, Elizabeth!’ (old ref. showing my age).
What I mean is the old saying ‘markets can remain irrational longer than you can remain liquid’. You can act upon some future potential truth and die by it if you take it to heart before it becomes actualized.
Bottom Line
Beware those with dynamic calls to action who adhere to dogma and bias. It sounds simple, but all those followers. Wow, we are not in Kansas anymore. We are down a social media driven rabbit hole and it is #dangerous to the naive or inexperienced.
Back to Precious Metals (sort of)
The easiest ways to spot a promoter are to look for easy analysis (Gold stocks will bull because… inflation! Gold stocks will bull because.. economic ruin! Gold stocks are not bulling because… gold manipulation by the cartel! Gold stocks are not bulling because… they are propping the US dollar!…), and on and on it goes.
Gold stocks topped in August of 2020 per the signal by 3 Twitter influencers above. There were and are others. There is Larry, who some may recall flipped his wig and blocked me when I uploaded the ladies pictured above to his feed. There is the commodity chart guru who blocked me when I offered a polite but alternate technical view of gold to his own (he’s got subscriptions to sell, after all). There is the horrible account that pumped the #silversqueeze promotion to unsuspecting victims and also blocked me. There is a 24/7 gold touting dogma spewing woman who simply un-followed me after one too many differing opinions.
There is an agenda in the gold cult community. It is important to remember that. I don’t know why that agenda is so pronounced. I think it is a combination of promotion for personal gain, honest naivete and an inability to get over one’s own core beliefs (i.e. dogma) in service to effective market management.
I have a little stash of gold and I have it for the long-term (20 years and counting). I’d call that a gold bug. Hence, I am not some outsider poking fun at those proudly calling themselves gold bugs while spewing their hype. I am a gold bug trying to shine a light on those who’ve co-opted something I consider real and lasting, for short-term purposes. Any given phase can be painful as evidenced by the period beginning when the 3 Stooges linked above unwittingly called the top, to today.
Long-term value has nothing to do with this noise. We won’t spin inflation as a primary reason to own gold (or certainly not gold stocks). We should also note that a phase directly prior to a big bull run can be the most dangerous (e.g. just prior to the 2000 low, the 2008 low and the 2016 low).
But let’s also keep in mind that gold, silver and gold stocks have done a lot of correcting for 2 years now while the stock market only started to correct this year. The sector is setting up for a bull phase and as noted by the weekly chart in an update linked above, it tapped valid support last week.
If the cyclical markets – preferably including commodities – continue to swing bearish the fundamentals for gold will improve and for gold miners, they will improve greatly since the gold mining industry leverages gold’s standing vs. cyclical assets, both psychologically (e.g. vs. stock markets) and practically (e.g. vs. mining cost inputs like crude oil and materials).

The monthly chart advises an intact series of higher highs and higher lows. Fact. I’d prefer that the black arrow turn green above the March 2020 spike low (142.51) but the major low we are concerned with is actually the 2018 low (131.12).

Meanwhile, September is going to be a dynamic month with a major sentiment event (FOMC) coming up. The charts above advise that someone who’s fundamentally engaged and a would-be buyer on a risk vs. reward basis (i.e. with a realization that the sector can move lower in the short-term) would see the current situation as positive and could be starting to position.
I took the bold move of adding a second MAIFF (MAI.V) position on Friday. That’s sarcasm, because I didn’t consider it bold at all. Just a little move to increase positioning in my only core miner that I’d want to have solid positioning in when the next bull phase arrives.
I am aware that the man I consider my daddy when it comes to my most closely held fundamental views of gold stocks, Bob Hoye, has gone mad bullish the sector for not only a coming rally, but a sustained bull market. I learned about the counter-cyclicality of gold miners from this man who has a solid grasp on market history, if not timing. On the latter, I’ve watched, observed and long ago decided to tune out the questionable timing but never to tune out the fundamental principles, which to this day I completely agree with because they make sense. If only the herds would listen!
But the herds are the herds for a reason. They eat Larry and the gang’s dogma for breakfast, lunch and dinner. They are the herd and it is their job to be wrong when it is time to be right. They were wrong at the last green arrow on the chart above. If we are in a process of rejecting the inflation trades now, the inflationist bugs will be wrong again, having puked the terrible gold stock correction and the ‘would-be’ failure of the broader inflation trades.
Bottom Line
So if we get a stock market wipe out, a commodity market wipe out and a blow off in the US dollar and the Gold/Silver ratio (most recently updated in this public post on August 30), preferably at peak Fed Hawk hysteria, the time will be right. It could come as soon as this very month of September. But as yet, that’s still speculation.
Personally, with cash paying increasing dividends I am going have patience. I may end up chasing a little or I may end up having a glorious and final selling event fall right into my lap as the fundamentals scream positive (e.g. Q4 2008). What I am going to do is continue to view the markets as though they have something to prove to me, rather than I having anything whatsoever to prove to them. Cash, baby.
But I do agree with Hoye in that there is the potential for a sea change in gold stocks should the big macro ‘everything’ bubble finally burst as the Fed, which has blown the bubble reliably at every point of concern since 2000, having its inflating hands tied in this bear market. The gold mining business is by the very nature of gold’s relative standing within the macro, counter-cyclical.
Commodities
Industrial metals, including copper took it on the chin last week. This despite ongoing inflation hysterics in the media and a stable US economy from a payrolls perspective. Let’s also realize however that copper is not US centric and that it is used in manufacturing and home building, two areas under duress right now.
Doctor Copper is known as the economic PhD metal due to its highly cyclical utility. Last week Doc’s rally aborted, much like broader markets. Can it bounce if the broads bounce? Sure. Will it get to target at $4/lb? Unknown.
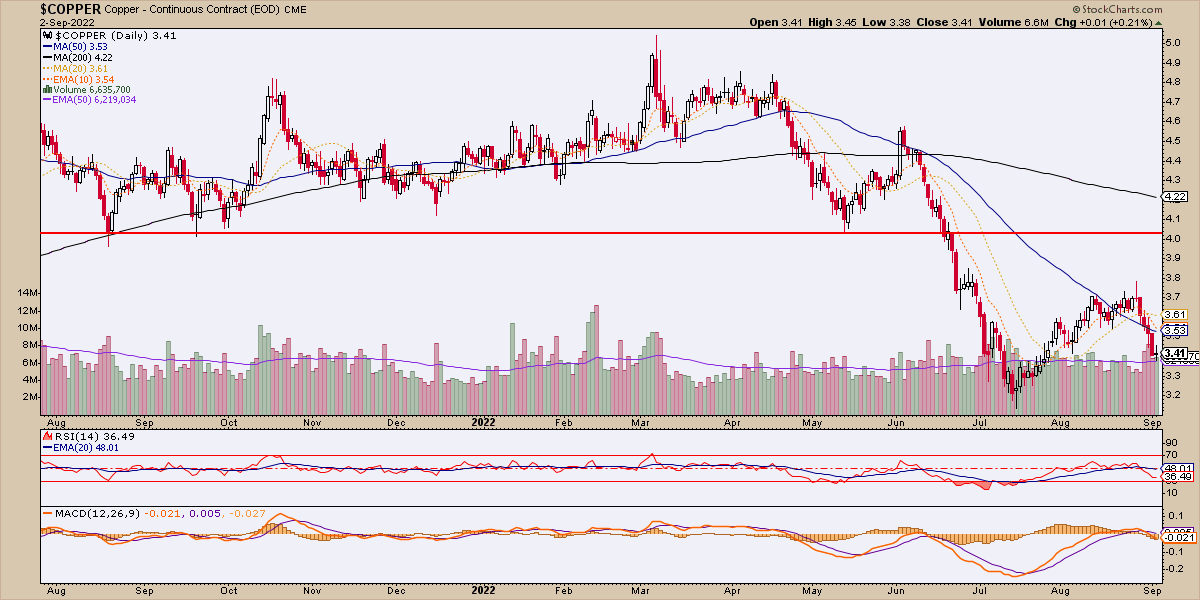
But Doc’s bearish state nominally and in relation to counter-cyclical gold shows the big macro breakdown we’d been anticipating through much of 2021 and into June of this year.
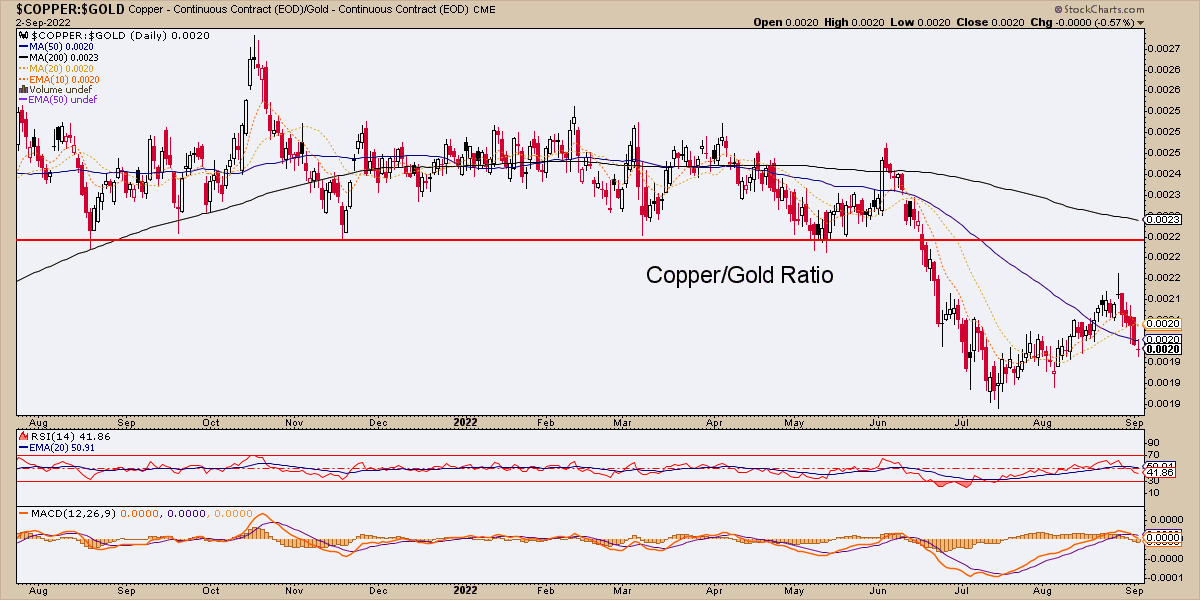
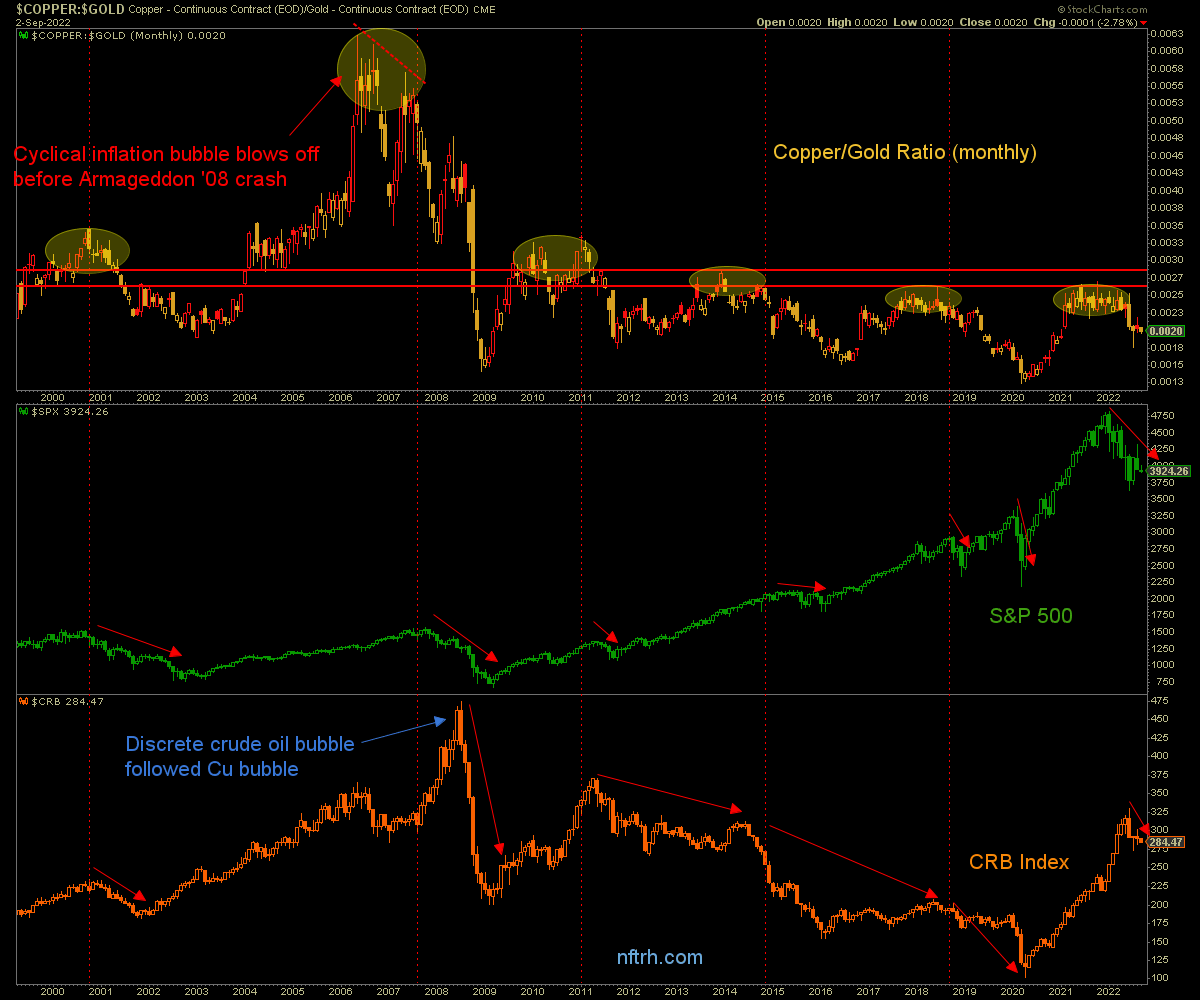
Here is the big picture view by monthly chart. When Copper/Gold broke down it was an indication that inflation was no longer working to the cyclical benefit of the economy. It was turning virulent. In other words, stagflation gripped the macro as rising costs started to erode business activity, including manufacturing.
Structural inflationists hold their ground because they believe that the Fed has lost control (it’s an old narrative going back to 2001 in my experience). If they are right then perhaps a commodity ‘super cycle’ may yet evolve. The CRB index has after all, only suffered a pronounced blip. But that is due to the ‘last inflated man standing’, Energy, which is subject to global political pressures as well as supply/demand pressures and of course, inflationary policy.
More likely and with everybody still on the inflation side of the boat, we’re going to get a failure of inflation and by extension a continued failure of inflated markets.
Being a major gold mining cost input (which was shown to have impaired miners at the recent earnings season) oil must either fail (likely against deflationary pressure) or start to fail in relation to gold (if stagflation is the play) for the gold miners to gain fundamental traction from an operational standpoint.
Here is a pretty picture, dear gold bugs. WTI oil vs. gold, while still technically trending up, broke ugly last week. If this were a stock I’d have sold Friday’s test and failure at the SMA 200. Will it bounce if the broads bounce? Probably. Nothing worth having is easy. But when this does break down what we will have is a greatly improved gold mining fundamental underpinning.

Flipping it over to Gold/Oil, you can see that there is a hell of a lot of upside potential after the post-2020 cyclical drubbing gold has taken in relation to oil. Or put another way, there is very little risk in favoring gold over oil beyond the very short-term. And if there is little risk in this ratio then there is little risk in a forward positive operational fundamental view for the gold mining sector. Hoye… oh boy! :-)

Let’s clip the Commodity segment here. I don’t want to waste too much ink on ‘at risk’ sectors of the markets, which are most of them.
Commodities Bottom Line
Generally cyclical and inflation sensitive, it is unlikely that commodity ‘super cycle’ touts will prove correct. Those same touts tend to tout gold stocks. One thing we are looking for is a failure of inflation after the Fed overshoots to the upside as it historically has. For all we know inflation may have already peaked along with short-term Treasury yields.
Another thing we are looking for is the inflation/commodity/resource/gold touts to be proven wrong as inflation signals continue to fade. Of course, if that happens and gold gains macro preeminence the touts will simply deemphasize their commodity obsessions and amplify the noise about gold. What a racket, promoters never lose! They simply rotate.
A Fed overshoot could come in the form of September’s rate increase just as the inflated macro starts to fail for the wider public to see. That would leave the Fed sitting out there like a sore thumb, having been tardy to tighten and then tardy to abort tightening. Or it could come later if the pressure to tighten continues through year-end.
September begins an often troublesome seasonal period for stock markets. Though often subject to different stimuli, commodities are cyclical, much like stock markets. The cycle was inflated. If it deflates… ? This is not the time to be a committed long-term commodity bull. Remember, despite the touts of people doomsaying stock markets while humping commodities, commodities are the material building blocks of an economy.
That said, there are still combined inflation/supply chain/simmering global war pressures that could pop certain commodities at certain times, especially strategic commodities and materials like Natural Gas, Rare Earths, Uranium, Lithium, etc. Despite the negative (vs. gold) analysis above, oil can also be a wild card subject to politics as much as inflation or economics at any given time.
Indicators
The 30yr yield ‘Continuum’ was updated on September 1 on both its all-important big picture monthly view and its shorter-term daily view. The test of 3.45% is on now and we’ll have more to discuss if it holds below that level (favored) or breaks through (there is an upside target off its inverted H&S pattern of 4% that I had leaned toward as a future objective, but could come sooner rather than later.
While there is rationale for the yield to rise in a deflationary situation (debt revulsion) let’s for now stick with it as an inflation (or lack thereof) indicator. 3.45% comin’ up.
The 10yr-2yr yield curve is in a posture to steepen. A curve steepening can come with inflationary or deflationary pressure. If bonds are rallying and nominal yields dropping while the curve steepens the indication would likely be deflationary and an ‘everybody out of the pool, there’s a turd in there!’ signal.

As yet the above daily view is in a downtrend, only making a hint. But let’s keep in mind the message of two previous inversions and subsequent steepeners. There appears little room to go much of anywhere but up after the curve inverted to -.48 in August.
The stock market has already gotten a jump on the next steepener by starting its bear early. That could be viewed as positive but I’d more likely view it as negative and the opposite of 2006, when peak (or better yet, trough) inversion preceded the bear market by the better part of a year. This bear market in stocks has preceded the trough inversion by at least 7 months. Maybe it could not wait to get bearish, given the speculative pressure and funny munny injected by the Fed that is now being quite overtly removed by the Fed. This is an indicator with much potential to damage the macro economic and market situation well into 2023.

 Gold/Silver ratio (GSR) you ask? Well, for me it’s always a good time to check in on the 2 Horsemen of the liquidity Apocalypse. They strongly favor a deflationary curve steepener. Let’s segue into the Currency segment with this pair.
I don’t include graphics to be cute or funny (okay, you caught me; I do include them to be funny as my Clark Gable/distinguished ascot wearing mature gentlemen practicing Dow Theory shtick will attest) so much as to make points.
The point of this graphic is that when 2 grim riders ride together the indication is usually, but not always*, very negative for cyclical markets.
* An exception being the 2013-2016 Goldilocks phase (with a strong dollar sucking in global investment to US Tech and other non-inflation markets) in the US, which was relatively painful for much of the rest of the world under deflationary pressure.
Currencies
This is a beautiful picture of the world’s senior currency flipping it to the legions of ideologues who have been advising us of the dollar’s imminent death for over 20 years now. The rise in the Gold/Silver ratio since April has compounded the bearish situation. Formerly speculative liquidity is fleeing to the reserve currency (intrinsically valueless or not, it’s the winner and as of September 4th, still champion of the global valueless currency sweepstakes).
As a side note, this is another illustration of how the dogmatists lead their herds of followers astray. The rise in the US dollar is fact. 100% fact. What’s more, the rise in the GSR adds a stern warning against speculation to that fact.

The weekly chart shows the GSR lagging Uncle Buck, probably due to the absolute moon shot it took as casino patrons panicked into the Fed’s very soon to come inflationary operation of 2020.
You see what a damn joke this is, right? The 2 Horsemen are working on breaking the last speculative frenzy (bubble) while at the same time the Fed is compelled to go full bore in a hawkish direction. It’s dangerous out there, folks.

We’ll skip Bitcoin this week because it’s a speculative asset that may one day be a great buy on a future viable asset. But I’ll have little lasting interest until it drops to or through 12,500 (currently trending down but trying to hold what looks like unimpressive support at 19,798).
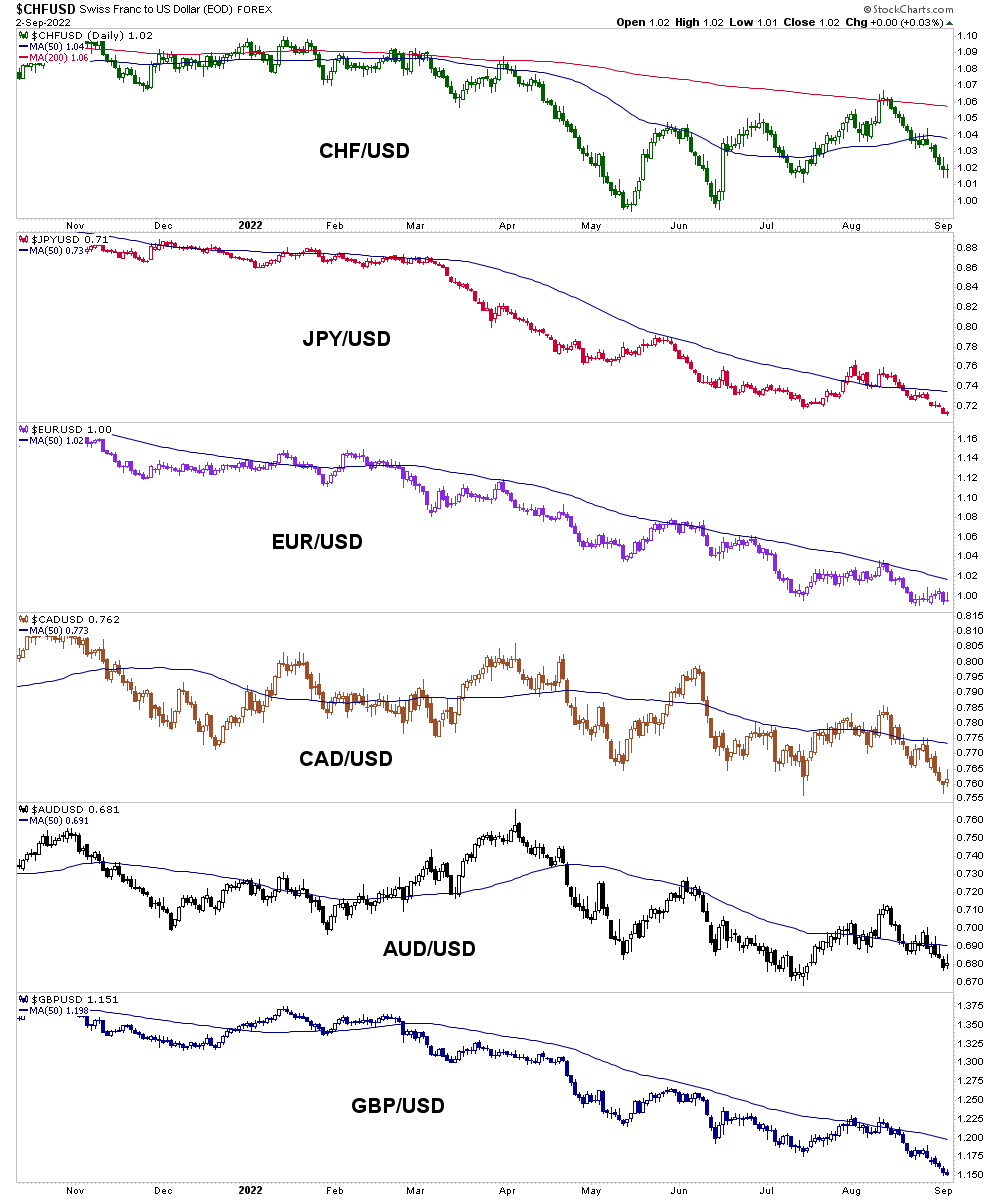
Instead, let’s get a view of global currencies, none of which can hold a candle to Uncle Buck as the global macro comes under increasing stress. There is one hegemon producing this pressure and despite your view on its intrinsic value (my view is that there is little, if any) its ‘price’ is firmly bullish and with the global liquidity dynamics in play, so too perhaps are its only functioning fundamentals, namely the hawking Fed and the global drive for the liquidity of the currency ‘anti-market’.
Bottom Line to NFTRH 721
Why, it’s bearish out there!
No seriously, it’s bearish out there. Bounces and counter-trend rallies will come (e.g. July-August) and go. But the trends are down and while it seems overly logical, the Fed is working toward a bear market because that is probably the only thing that would reverse the inflation problem that they created and then extended with their idiotic ‘transitory’ garbage.
I think that notion was probably the product of political pressure applied by the likes of Janet Yellen and by extension, directly or indirectly, the Biden administration, which is probably laying in wait to claim credit for defeating inflation. Well Joe, better be careful what you ask for, because you just might – and probably will – get it.
In short, inflation was the thing that created the post Q1 2020 bull market. We documented the building of that bull every step of the way in 2020. Now we are documenting its deconstruction. It is possible that inflation will take on a life of its own and go into a super trend of some kind. But this is – in my opinion – not the time to be betting on that, logically speaking.
The September FOMC does have the potential to be a watershed event, however. Everybody had come to know that inflation was a major problem and now the Fed is being dragged up the interest rate ladder by the bond market. The bond market looks ahead and the Fed follows its signals, sometimes in a tardy manner. If the Fed is tardy to view the potential of the coming economic bust to snuff out inflation there could be a real problem for cyclical, inflation sensitive and risk ‘on’ markets.
I am not a gold bug for my sunny personality (that’s more sarcasm). I am a gold bug because I am malcontented about the way the system is remotely managed by systematic inflation. That systematic inflation, while sometimes (like mid-2020 to now) not positive for the gold price is also not positive for the system itself in the long-term. It’s corrosive.
Hence a long-term hold of gold and currently a view of quality gold mining operations as a future go-to sector due to the gathering counter-cyclical signals as the economy weakens and eventually gold starts/continues to rise in terms of other commodities and markets (i.e. gold’s ‘real’ price).
The short-term spanner in the works is the still hawking Fed. There could still be a dangerous juncture ahead for gold stocks, although the other argument is that they’ve already bled out most of the risk. Hence, I’d describe myself as very interested but at the same time very patient, pending incoming information and data points.
Happy Labor Day weekend to you.
help me out Gary……..
Markets down Gold +
NAIIM down Gold +
XLE down Gold +
Global mkts down Gold +
Cyclical mkts down Gold +
Industrial mkts down Gold +
Interest rates steepening Gold ?
GSR steepening Gold ?
Dollar strengthening Gold ?
Why not now? Dyrl
Why not now? Because it is a process and one part of that process is to clean the inflationists out of the bug community.
Hi Dyrl, Curve steepening: Gold+. GSR rising: Often NOT gold+ because it tends to happen when the PMs are declining. Dollar strength: usually, but not always NOT gold+. But GSR & USD rising indicate negative market liquidity, which one day puts pressure on policymakers to quit with the hawk routine and then later try for another inflationary kick save, which gold picks up on first.