Copper/Gold ratio (daily chart) pulls back to the moving averages
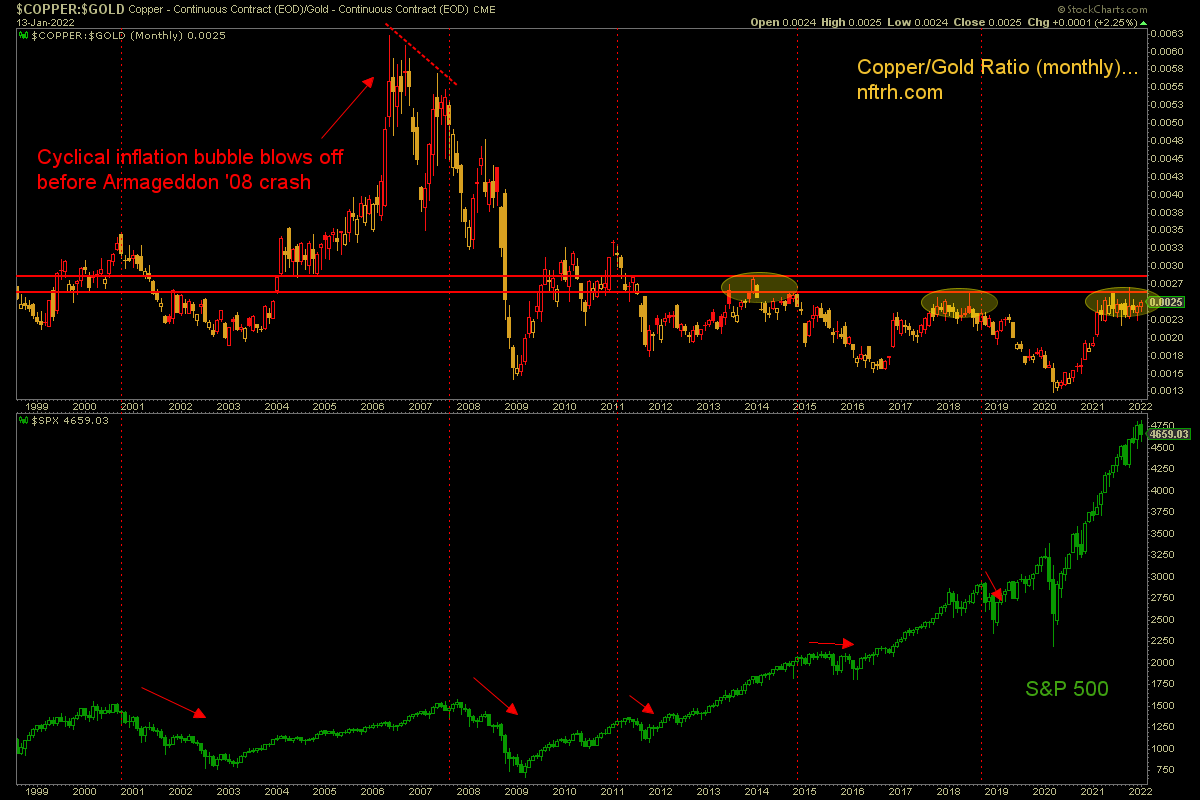
It’s a tough market, and by this indicator it’s been a tough market for nearly a year. That is because the Copper/Gold ratio refuses to give a signal (cyclical inflation on/off). There are positives and negatives aplenty as shown by other indicators and markets, but this one illustrates well the general theme of the macro over the last year… indecision.

Meanwhile, when it does break one way (up for the inflationists) or the other (down for the dis and/or de… flationists) we are going to get signals, alright.
Confounding as it may be to USD/inflation-centric gold bugs, gold and USD are positive in pre-market and that is not positive macro signaling. This macro phase was created by inflation. If gold takes preeminence in the metals patch that ain’t gonna be inflationary, folks.
The inflationary indicators are not broken, and that includes the Silver/Gold ratio (very depressed but also at a key decision point). But as noted there are some concerning negative divergences to the inflation trades in play, including but far from limited to Uncle Buck’s quick drop to the first support level.
For “best of breed” top down analysis of all major markets, subscribe to NFTRH Premium, which includes an in-depth weekly market report, detailed market updates and NFTRH+ dynamic updates and chart/trade setup ideas. Subscribe by PayPal or credit card using a button on the right sidebar (if using a mobile device you may need to scroll down) or see other options. Keep up to date with actionable public content at NFTRH.com by using the email form on the right sidebar. Follow via Twitter @NFTRHgt.