Since NFTRH 681 put its stock picking pants on I want to make sure we’re following the market backdrop this week if/as things change or affirm. Long-term Treasury yields have been grinding upward over the last few trading days with the 10yr especially looking constructive. Daily chart…

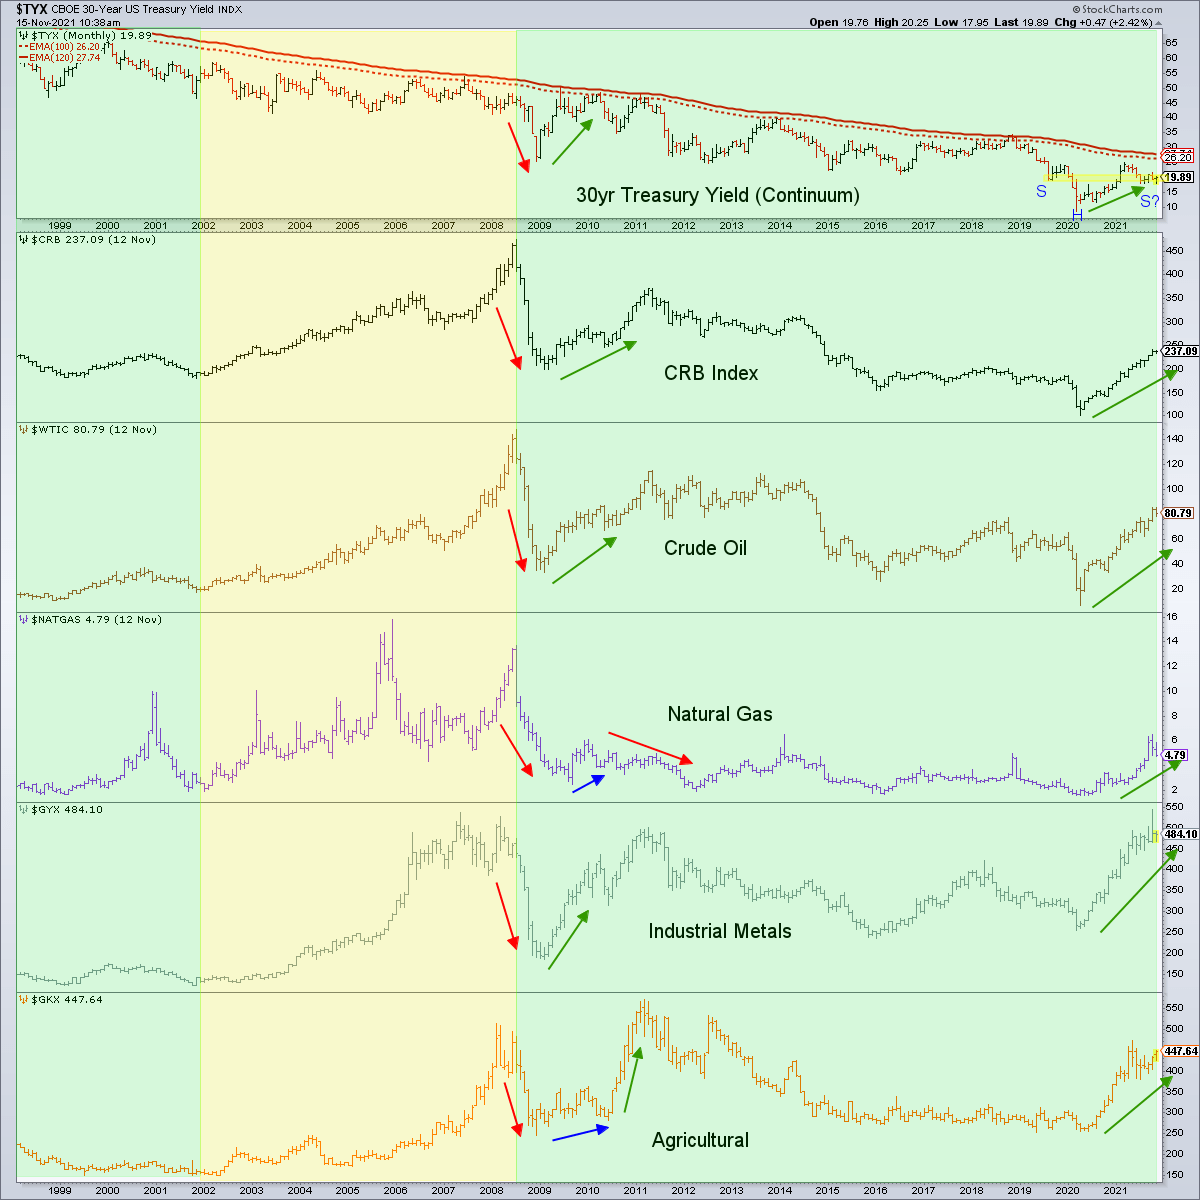
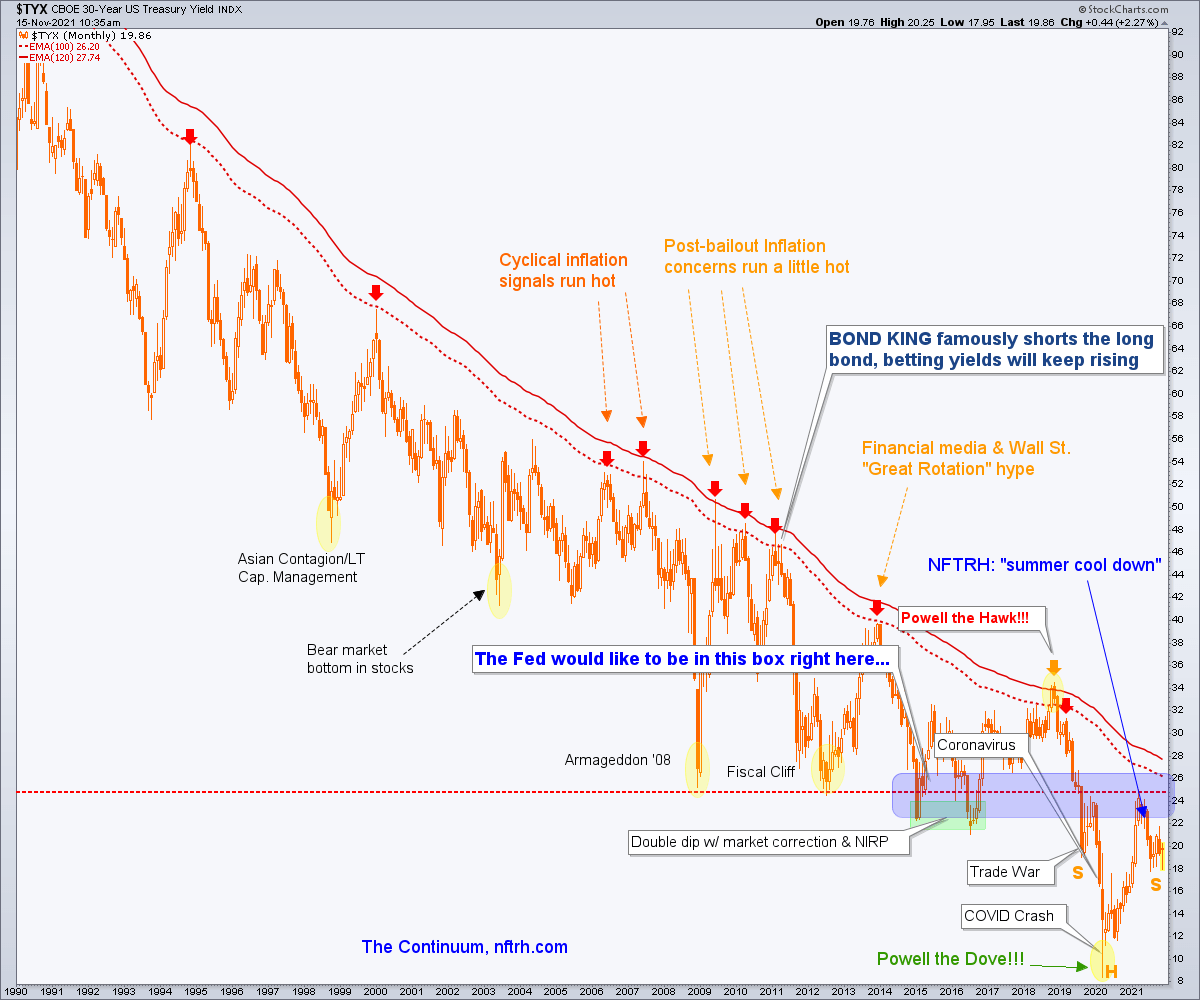
I use the 30yr as our big picture monthly ‘Continuum’ guide because it has so consistently been resisted at the EMA 100 and 120 over the years and decades. The would-be play has been a right side inverted shoulder to form after the ‘summer cool down’ in inflation trades. If the above recover, so will the right side shoulder on the Continuum.
Nominal yields are far from the only indicator of inflation (for one, inflation expectations continue to rise) but in the current macro the 30yr yield has been a good guide for the inflation trades. What this tells me is that despite the ‘buy the news’ (in bonds, sell the news in yields) of the recent FOMC and its taper talk the inflation trades are still on until/unless the right shoulder breaks down and inflation expectations tank.