We have not looked at the market’s internals and relative sector performance for a couple of weeks because the market cracked, was in motion and straight TA took precedence. But now that the market is predictably rallying after the shakeout we need to determine whether it is real or a suck-in to once again wash out the bulls.
This update does not provide conclusions on that question so much as give us a snapshot of certain internal conditions. I have sold virtually none of the items bought during the mini crash, but have scaled into a few shorts on the relief rally. Yesterday was a very good day and I am still geared to the long side.
So speaking personally, I’ll want to get a grasp on whether this rebound is going to fail or whether the micro time A-B-C correction (per 30 min. chart in NFTRH 486) was all there is because…
- If the market is going to recover fully, I don’t want shorts dragging my profits and…
- If the market is going to resume correction, likely to SPX 2400s, I’ll want to do some selling of longs.
First, a couple of SPX charts. There are a couple of gaps on the 30min. chart and if the index goes above the B high, it might want to keep on going to one or both of those gaps. I’ll consider keeping a tight leash on the short positions if it gets past that point. The blue arrow shows the current projected open this morning based on futures.
The daily chart also shows why the 2725 area (actually 2727.67) is key. So far, the market is only bouncing to an area that was completely expected ahead of time. The favored area was the SMA 50 (blue line). Any higher than that and bears would start to get that old feeling of ‘rut roh, here we go again’ that the bull market has trained into them. However, until 2727.67 is taken out and held for a couple of daily closes, the favored scenario is that the relief rally will suck in enough players as to be ready for a 2nd leg down.
On to some internal views. The Semis continue to be on a negative signal. The 1st step in negating the new weekly down trend would be for these ratios to rise above the SMA 50s and then the January highs. Thus far, it’s considered an early (potentially quite early) negative economic cycle indicator.
The view vs. broad Tech is similar.
We have noted that Palladium/Gold has taken a hit, but remains intact. A shakeout on the way to more bullish things? Let’s let the indicators tell the story, not our bias.
This big picture chart shows why PALL/Gold is so important. It is no coincidence that PALL cracked, PALL/Gold cracked and the SPX also cracked. So until the chart above breaks down and later crosses its moving averages down, why don’t we keep the bear juices under wraps?
The counter-cyclical, defensive and/or risk ‘off’ stuff never did break upward in relation to SPY, and with the relief rally in stocks, that is all the more the case. At face value, these indicators are and have been bullish for stocks.
Which leads us to macro Amigo #1, AKA the SPX/Gold ratio. The negative monthly candle is putting in a tail that could morph into a Hammer and resolve in hindsight to what could be looked back at as merely a February shakeout on the way to target, which is significantly higher at around 2.50.
We have already noted that despite the bearish hysterics ‘Junk to quality’ bond ratios remained very firm. This is a ‘risk still on’ indicator.
This is as well.
And this is a healthy picture of the ‘man in the middle’.
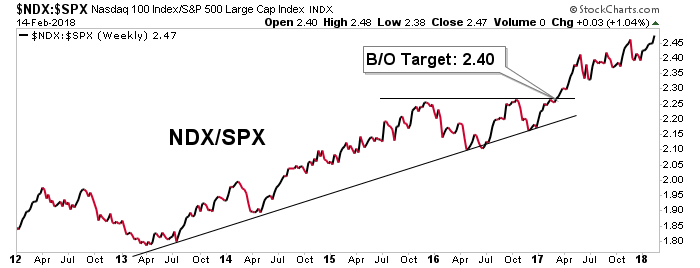
NDX, a leading market, remains firm vs. SPX.
Sure, there was a crack in the A/D line, but the market also cracked and so there is no divergence here currently.
SOX/NDX remains somewhat suspect, which continues to argue that selective shorting may still work for some against a generally bullish backdrop in the markets.
On to some general inter-market ratios, the Bank ETF is doing what it should do vs. SPY as 10yr yields have risen (to target of 2.9%).
We’ll close with the daily and weekly views of various sectors vs. SPY. Taking both daily and weekly into account, Financials and Tech look best with respect to their robotic leadership trends.
Bottom Line
Now that the post-mini crash landscape is smoothing out with the expected relief rally, there are few negative divergences developing outside of some potentially very early signals from the Semiconductor sector* and Palladium’s drop vs. Gold, which retains its intermediate-term uptrend.
As someone who bought the crash and has started shorting the recovery, I am very interested to see how this plays out. Hence, with below the surface indicators stable on balance, I plan to use straight TA (roughly the 2725 +/- area on SPX) as a near-term guide. The bears have not taken over until they break the trends and/or start creating more negative divergences.
Meanwhile, we should be aware that a new leg down in the market (to SPX 2400s) can take place within a still-bullish macro backdrop. So that is another consideration. Even if the market does dump again per the favored scenario, that could still be a bullish opportunity. More to come as things evolve.
* For new subscribers, we used the Semi Equipment sector as a very early positive economic signal in the 1st half of 2013 and logically, would use it again in looking toward a potential economic down shift.


