Time once again for a review of the big picture, because… perspective. For example, in my mind I feel that training has been done to not expect a real whopper of an inflation trade. That was from the conditioning of the global deflationary force, post 2007. Yet the technicals for industrial metals are bullish for more upside, as you’ll see below.
Anyway, here are big picture monthly charts with limited word interference from me (and hence, not comprehensive analysis). It’s just for your own individual reflection if you’re even into this stuff like I am.
We’ll start off with my favorite cartoon, just because when I get on a shtick I like to beat you over the head with it. The Continuum’s red dotted line breaks? Game changes. Red dotted line holds as it has for decades? Move along, nothing to see here.

The Dow overshot targets and is at an uptrend channel line.

S&P 500 overshot targets and creeps along the fork’s trend line.

Nasdaq 100… blue sky. It’s gone far enough that a simple test of long-term breakout support could feel like a bear market to late-coming momos.

Semi Index, ha ha ha… silly me. 930… ha ha ha. It’s looking for a test of the all-time high and maybe that closes the door on this party. Who knows? SOX got the party started in 2013.

Look at that top channel line on the Russell 2000.

DAX… there’s the measured target close to 14,000.

Well, if Nikkei successfully crosses the red lines it’s going a lot higher. As in 14,000 points higher. It’s got the pattern to do so, now it just needs to do so.

Oh Canada, I had not seen this view previously. It actually looks monstrously bullish. Okay, relax. It’s a chart. They say things all the time. But this is freakishly bullish looking as it stands now.

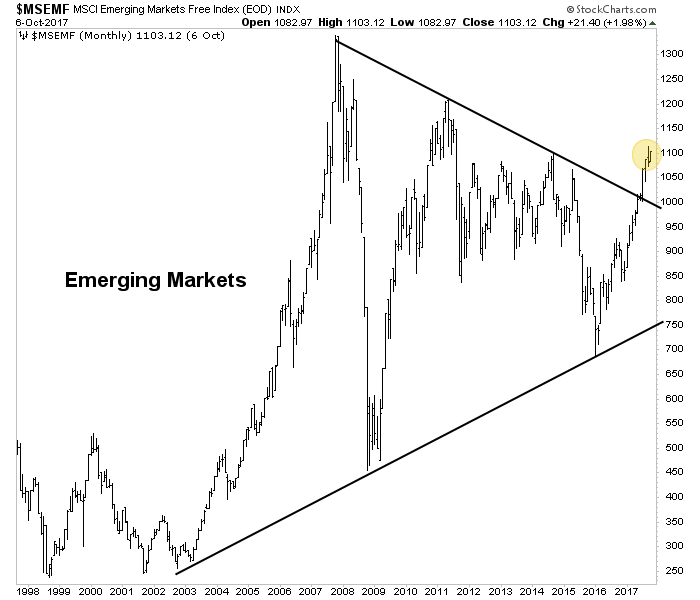
EMs are overbought and vulnerable on short-term charts. They are also quite bullish on the big view.
China not so much.

Crude Oil goes to 75 if it gets and holds above 55. So will it get and hold above 55?

Copper still deals with the congestion and long-term resistance at the 38% Fib.
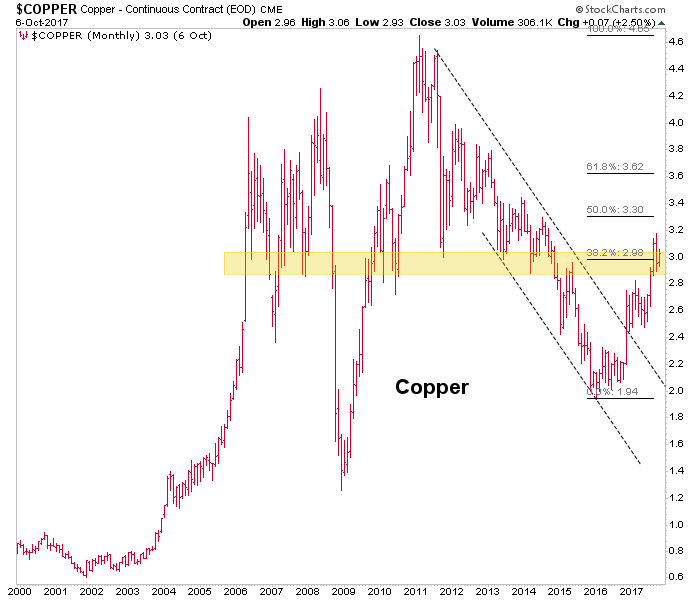
Copper’s Industrial Metal bros target 440 by the noted bottoming pattern and handily, there is also the area of the red dotted downtrend line. That’s a ‘hmmmm… ‘ if you ask me.

Agricultural is one that a lot of people ask me about because I think people want to get bullish for fundamental reasons (I hear Jim Rogers is back on this one??). But as of now the chart says no dice until 240-250 on GKX. Maybe there it would be a mega buy. In fact, I am going to keep a closer eye on these monthlies for NFTRH going forward.

Gold broke the wedge to the upside and is now shaking out Rocket Boy momos and other dunderheads. It always was going to stop, if temporarily, at the high 1300s.

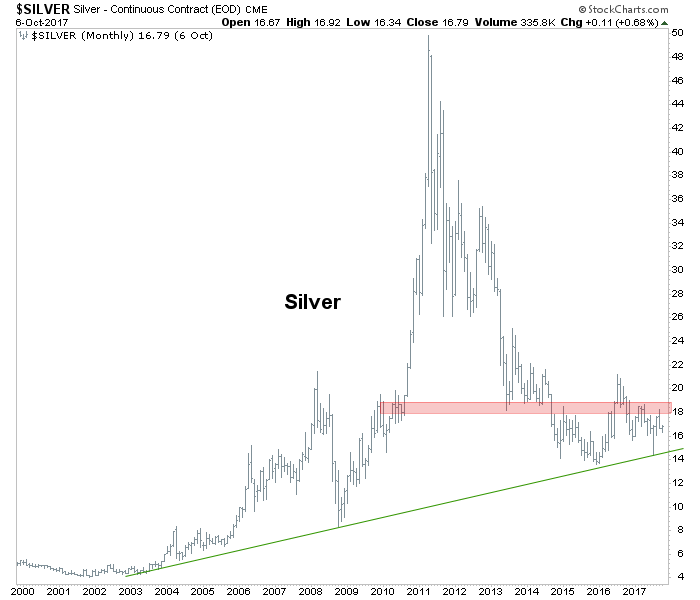
Silver has twice tapped a trend line. Hey, that’s something. Any rise above the 2016 high and this thing is gone. That’ll be a tall order but then again, it’s been a brutal bear market to take out the promoters. Now if only those conspiracy detectives looking at the COMEX the wrong way could be more thoroughly debunked the deck could be cleared.
Last but not least, the HUI Gold Bugs index. At the risk of sounding like a gold lunatic pompom waving douche, even an A-B-C rally would tack on big gains for gold stocks. And the thing is, a higher high above ‘A’ would also open the prospect of a new bull market cycle.
Aside from that, we have been monitoring Huey’s progress in holding the Bollinger Band mid point for all of 2017 after making kind of a big deal about its break upward through that point in 2016 to a hysterically overbought ‘A’. The green arrows are no fun as the BB mid point routinely gets jabbed in month, but since we used it as a parameter to avoid a bull view in the bear market we flip it over and do the opposite now that the index is constructive. Not rocket science, folks.

By the way, if you’re thinking of subscribing to NFTRH don’t wait too long. The subscription price will be increasing (albeit moderately) soon. It’ll still be a value based on what I see of pricing for far less comprehensive services. If you subscribe now you lock in the current price for the life of the subscription.
Subscribe to NFTRH Premium for your 40-55 page weekly report, interim updates and NFTRH+ chart and trade ideas or the free eLetter for an introduction to our work. Or simply keep up to date with plenty of public content at NFTRH.com and Biiwii.com. Also, you can follow via Twitter @BiiwiiNFTRH, StockTwits, RSS or sign up to receive posts directly by email (right sidebar).