Wax On
We should understand that the market is just doing what it does. I was beginning to wonder if they would be able to put the wax back on before the market broke down, but in dramatic fashion the bounce waited until the market took things to the limit.
Here is the weekly chart of SPX, NDX & Dow from NFTRH 382. The reality is that the market (at least per the futures) is looking to continue Friday’s bounce and this comes from the most logical point possible, because any lower and the market would have been broken.

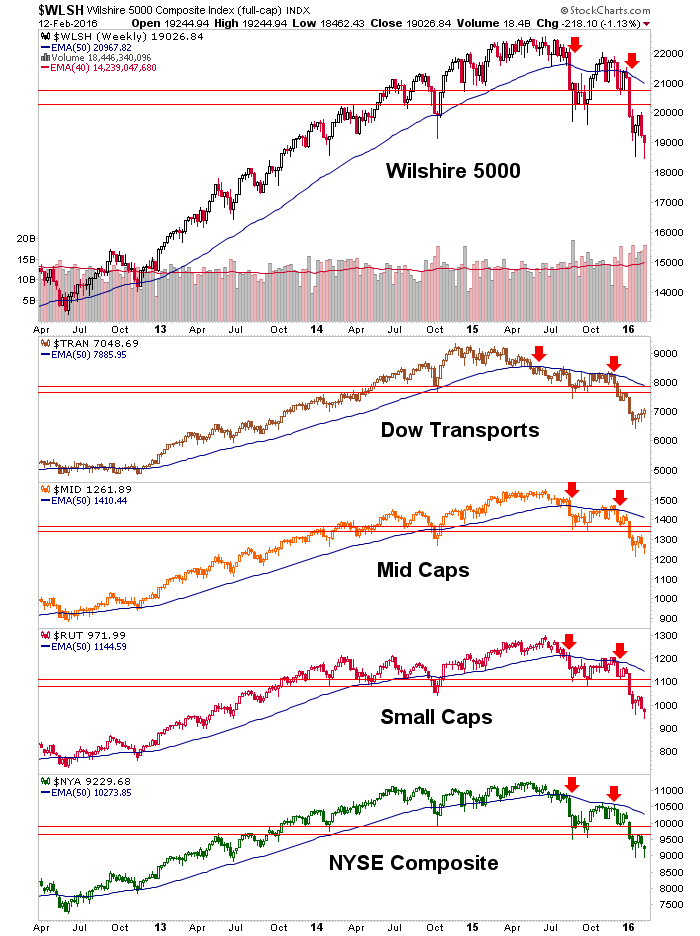
So yes, we are in an unbroken market (by these headline indexes) but we are also in a bearish market and it will remain that way until such time as it can negate the intermediate downtrends. Of the above, only SPX can conclusively be said to be making a series lower highs and lower lows with NDX still at a higher low (after making a higher high) and Dow having made a lower high but not a lower low. Enter the broader multi-index chart. Lower highs and lower lows abound.
Enter the mainstream media coming up with headlines to suit market activity (see post Market Bottom! at Biiwii) and the contrarian’s contrarian, Mark Hulbert at MarketWatch… What bear market? Stocks will likely be higher in 6 months.
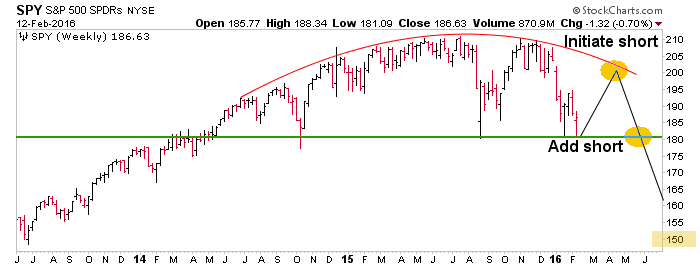
And do you know what? I think that a massive rally is probably going to happen when this bear phase ends. 6 months could be a little soon for that window, but we are only managing the S&P 500 to 1500-1560 and that will only be the target if the green zone in the top chart is lost.
The market (except for NDX, technically) is intermediate bearish and we have planned on an interim bounce. That’s all there is to it. The media always want to tell us why we see what we see. Today they want to tell us why we should be bullish because markets are bouncing. Until I get sound reason to change the view, it remains in line with this chart. We ‘Bouncers’ can play but risk will be rising along the way.
Wax Off
As for gold, some people have been desperate to buy the sector that seemed to run away from everybody. Well it is not running away today. Gold, which is counter-cyclical in its current role and is a risk ‘off’ item, is getting hammered.
A reaction (whether mini or maxi) is on. I don’t want to do play by play on this because the gold “community” is going to be doing that publicly for anyone who wants to get caught up in it. It’s a violent sector, to the upside and the downside. Here is the view of gold today…

As shown in #382 gold was very over bought and this reaction is normal. Rather than use that daily chart’s busy amalgam of would-be support levels, let’s simplify per the weekly chart below.
Assuming that the 1260 area was a reaction point of some significance, we can plot potential Fibonacci pullback levels. I will tell you that as a gold bull I wouldn’t want to see the EMA 75, which we have used for so long to say ‘still a bear market’ fail to hold as support. The EMA 75 is near a 38% Fib pullback. As a sign of strength, I’d like gold not to drop below 1172, aside from maybe a quick poke or two.

Bottom Line
We went through the sentiment picture in an update late last week and also in the weekend report. I see no reason to alter the view that the market bounce will be weaker than the post-September bounce. What’s more, gold as a risk ‘off’ item should hold the 38% Fib (let’s call it 1170 to 1180) in order to remain strong. It can theoretically pull back more than that (50%, 62% Fibs) but again, we have already seen and continue looking for signs of strength and I’d want to see that continue… with a 38% pullback.
An important fundamental consideration to the gold sector is an has been gold vs. the state of stock markets. So as long as things stay in bounds from that perspective nothing has changed. Looking at those charts we would expect a reaction and that is what is going on at this time. Let’s keep it simple and review new information as it comes in and not try to guess or worse, get caught up in the ‘sentiment’ game.