Right in line with the information I got from a former industry colleague back in July, Machine Tool sales data have continued to degrade. Click for a larger view of the graph. From EDA (mark ups mine)…
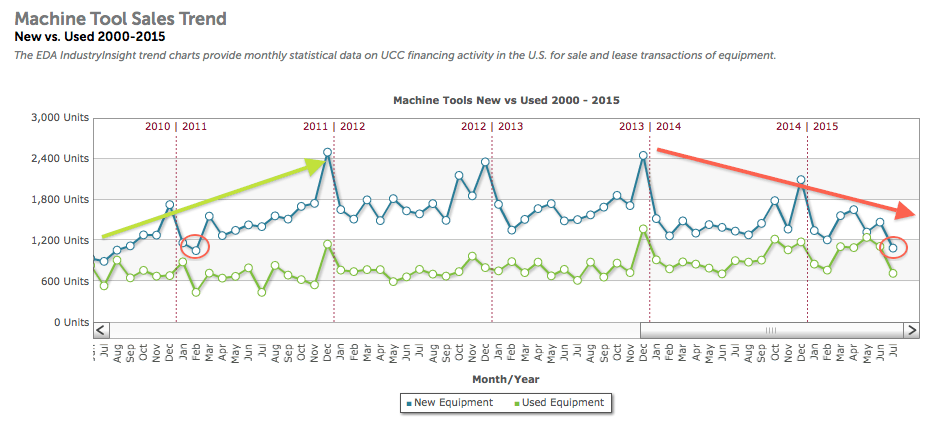
The key ‘New Equipment’ sales (blue) are most important and these sales are at lows not seen since 2011. A couple key points…
- This graph shows units sold, not sales dollar volume. This is important because in the post linked above we noted how Mori Seiki was ‘blowin’ ’em out’ at extreme discounts and that could move some unit volume while hurting bottom line profits (and/or delivering losses) to the industry. Well, despite the blow out, unit sales have still tanked and that’s not good for the industry.
- Sale volume is at the early 2011 level. Okay fine, but that was part of an uptrend that was a positive divergence that eventually led to the post-2012 bull phase in stock markets and the economy. Now? Where is uptrend? You see uptrend? Show me uptrend!
Clicking the graphic yields the video for anyone with too much time on their hands. :-)

Subscribe to NFTRH Premium for your 25-35 page weekly report, interim updates and NFTRH+ chart and trade ideas or the free eLetter for an introduction to our work. Or simply keep up to date with plenty of public content at NFTRH.com and Biiwii.com. Also, you can follow via Twitter @BiiwiiNFTRH.