

Summary
A brief summary of the work done in this week’s report and in the updates and reports leading up to this point. Please read the detailed report for the complete picture. There are many granular details that cannot be summarized so briefly.
Precious Metals (bull market)
Sector firmly in correction. Whether or not the final low is in, the sector is at much-reduced risk. Any bounce from here could be just that, a bounce. But given the length of the originally anticipated “multi-month” correction (now a half year), any bounce from here could also be the start of a real bull move.
US Stock Market (bull market)
The pig just will not crack. Or will it? Its leaders, SOX & NDX, have cracked and they should be watched closely this week for broader indications. The leaders have bounced, but only to resistance.
Global Stock Market (bull market)
Watching closely for global participation in a 2003-2007 style anti-USD trade where global out-performs the US. It may have already started. If that is the case, China/Asia, EM, Canada and Australia are favored.
L/T US Treasury Bonds (bear market)
I was wrong to anticipate an interim rally. Regardless, a bear market is a bear market. The rise in rates on the longer ends of the curve are pressuring the Fed to raise rates.
Commodities/Resources (bull market)
Watch the Silver/Gold ratio. Meanwhile, it appears time to discretely nibble at favored items.
US Dollar (short-term bullish, post-2008 bull market)
US Dollar (mega long-term bear market)
USD got clubbed last week. Has the anti-USD “inflation trade” begun? Stay tuned.
As noted previously, #926 is abbreviated as we spend this weekend moving. See you next week from my new office where I will feel settled for the first time in two years of apartment living. I never realized how important the office in my old home was to me. In the coming months I want to really settle in and get some new initiatives going… or should I say old initiatives that two very challenging years while living in an apartment have put on hold.
US Stock Market
SPX popped above its 50 day moving average (7470) on Friday, closing at 7490.
NDX merely bounced to test, and thus far remain at key resistance in the 28,250 to 28,500 area, closing at 28274.
SOX broke back above its pattern neckline, but much like NDX closed at key resistance at 11,311.
Here is the broad SPX, not quite out of the woods but trying to get there.

Sentiment
High Yield spreads (junk bonds) continued to spike off of very complacent lows. That implies market upset in the making. VIX tanked to 16 to end the week, which implies complacency back in place. One of these indicators is lying. However, when viewing junk bond fund HYG vs. investment grade fund LQD, the message is ‘risk still ON’ as junk greatly out-performs IG.
AAII and NAAIM* each displayed anxiety on Wednesday, which of sprung the end of week bounce.
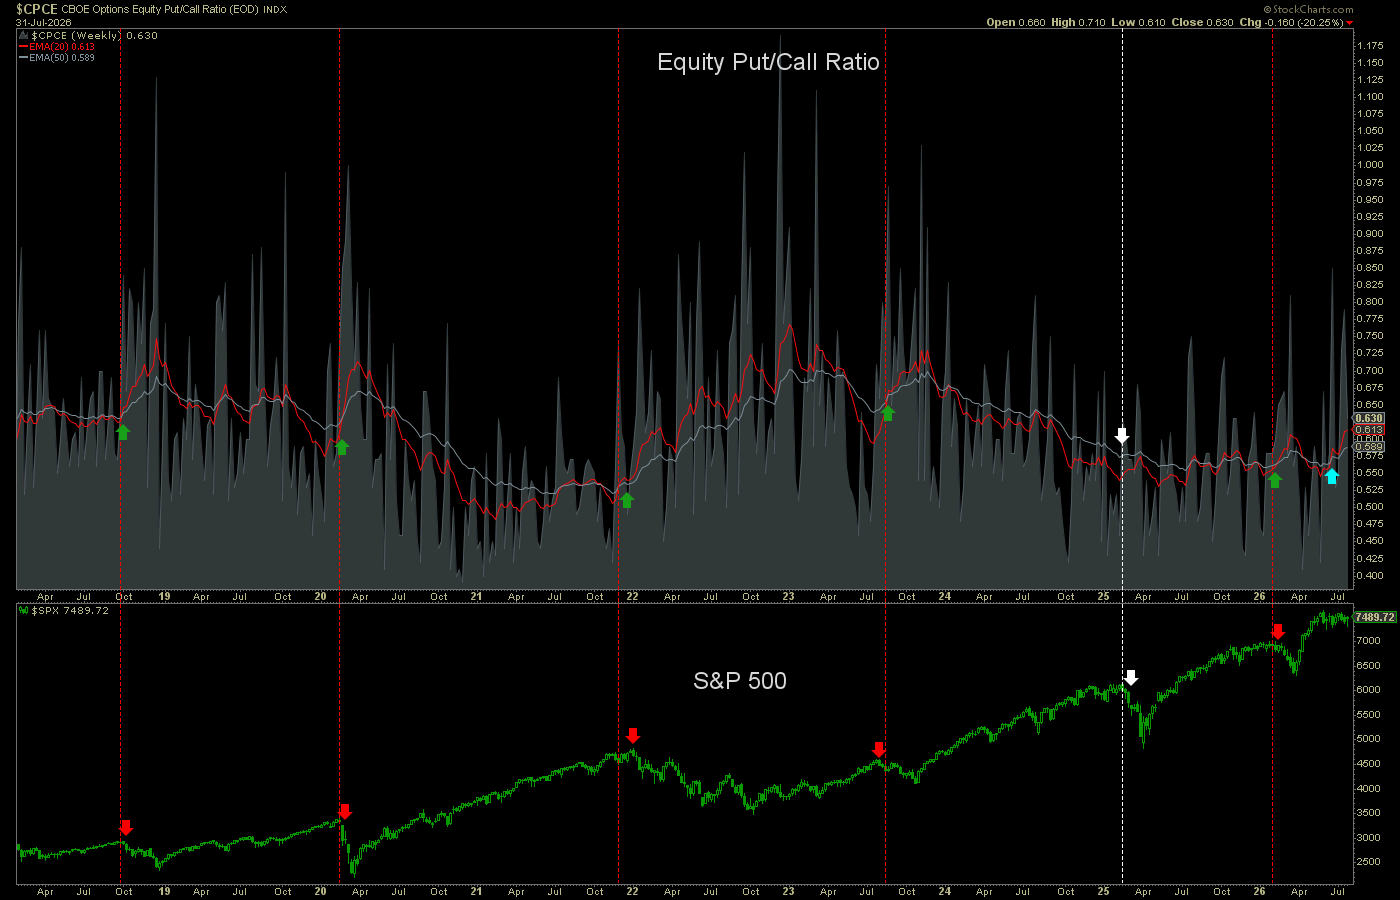
The Equity Put/Call ratio checks in with its bear/correction signal. While other indexes have cracked, SPX has thus far refused to crack. This indicator shows the broad market still vulnerable.
* NAAIM has begun charging $600/yr for data that shows how managers of other peoples’ money (OPM) are positioned. This group is consistently the most correlated to the market in real time, because when you’re managing OPM you have to be one with the herd or else you will no longer be managing OPM. At that subscription rate, I can easily live without them (unless Stockcharts.com continues tracking, in which case, fine). From NAAIM:
“Rather than predicting future market direction, the Index provides insight into how active risk managers are currently positioning client portfolios and the adjustments they have made over time.”
Oh please…
FOMC
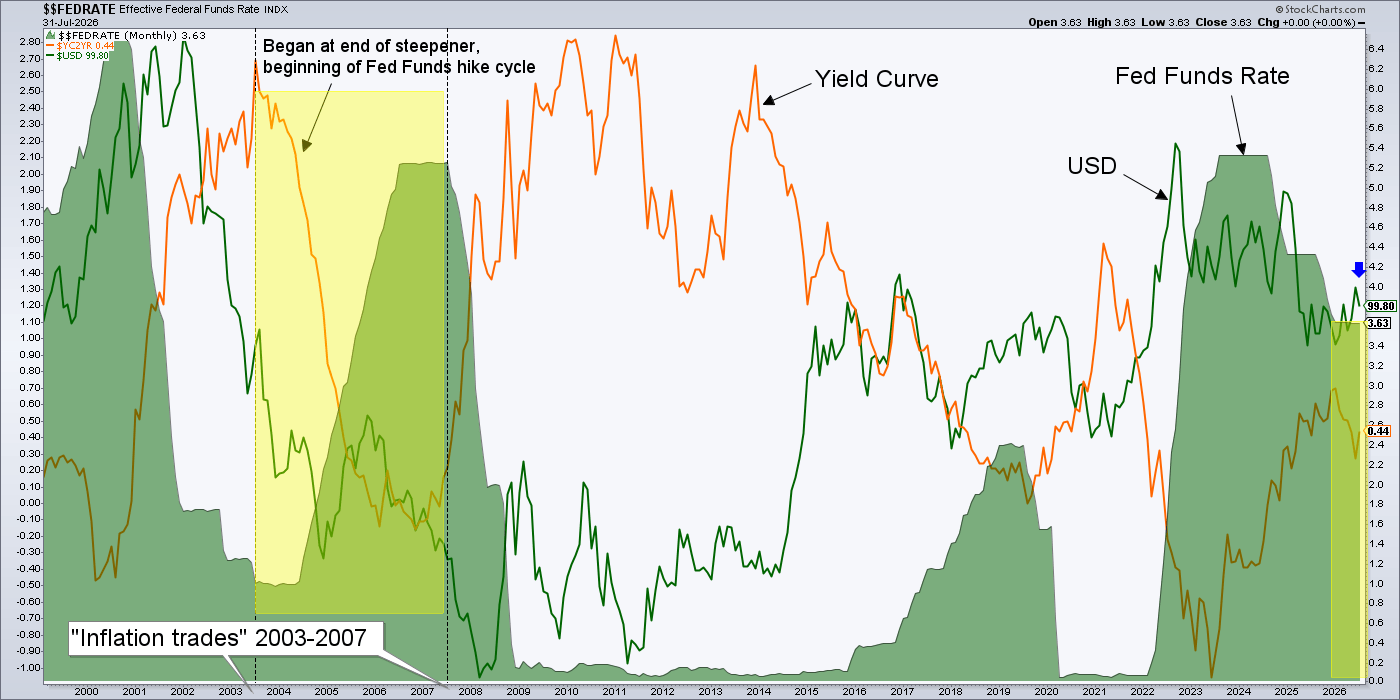
FOMC rode off into the sunset of its late summer hiatus, having left the Funds rate as is at 350-375 bps. 67% of CME traders expect a .25% hike in September. 77% expect at least .25% by the October meeting. Let’s remember that CME is just a wind sock, advising us which way the current prevailing wind is blowing.
But if the Fed does hike as expected, let’s recall that 2003-2007 “inflation trade” plan saw a rate hike regime. It also saw a flattening yield curve (a function of the Fed’s rate hiking) and a bearish USD (interrupted by one big rally).
Things probably will not play out exactly the same on this cycle, but a bearish USD will be necessary (pending any interim rally activity like the one currently in progress). But the main point is that a global commodity and precious metals rally, along with certain global stock market areas (in 2003-2007 it was China/Asia/EM among others) can happen with the Fed raising the Funds rate.
Especially now that commercial banks are being set free from regulatory constraints (as in ’03-’07) in order to stimulate the economy. This makes the Fed less important as Warsh eases us off the blight of the Bernanke years, when that evil Wizard was in TOTAL control. Today, Wizards Warsh and Bessent are in control, but leaving the heavy lifting to the commercial banks. It’s so simple, yet brilliant (and if past is prologue, ultimately destructive).
Global Stock Markets
This chart will continue asking its question in light of the similarities to 2003-2007. I added another TDF position last week to lean a bit further into China. As for the world of investment, the key is a weak US dollar. That has not yet come about. But it could be close.

Precious Metals
Still going nowhere. Still bearish. And still of much interest for the end of the correction.
I continue to favor royalty and exploration on the big inflationary picture, but the miners have started to release results and thus far appear to have factored the cost pressures of Q2. I’ll slap a couple graphics of current holdings (PM & non-PM) in at the end of the report.
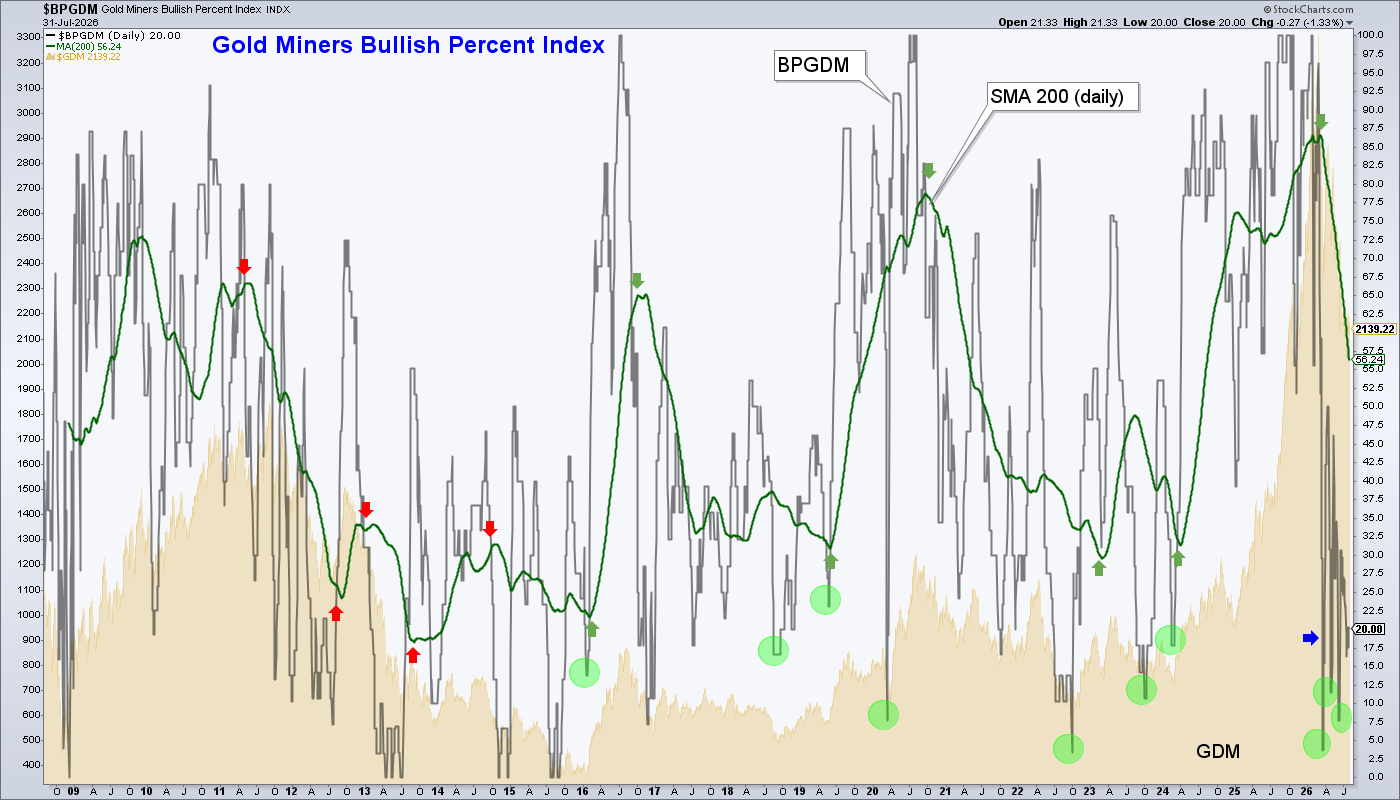
The main theme is greatly reduced risk and not many indicators are better than the BPGDM’s 200 day moving average at illustrating that. We are looking for a higher low in the green line, while being aware that after the sector bottoms it will continue downward for a while. In other words, a bottom can come at any time now. The SMA 200 has done its work.
Commodities
Still waiting on the Silver/Gold ratio to give the all-clear. I can’t stress enough how important that will be to the inflation trades. Yet some exposure can be taken with risk of short-term downside. I hold a few copper and uranium positions within a diverse set of holdings.
The SGR is trending down but RSI is constructive and a bounce could be prepping.

Portfolios
Gold is long-term risk management & monetary value/stability in a balanced portfolio.
“Savings” account positions (cash & equiv: 75%)

Roth IRA positions (cash & equiv: 73%):

Cash & income-generating Treasury bonds are at levels that are right for me and my real-world situation. Your situation is different. Cash will be adjusted as needed.
Refer to the In-Week Notes under the NFTRH Premium menu at nftrh.com for market talk and occasional trading info, if interested. Also, you can follow on X @NFTRHgt for notice of updates.
NFTRH is not to be distributed to third parties without prior written consent
Notes From the Rabbit Hole (NFTRH) is a weekly market report in which we provide analysis on financial markets. We make every effort to provide accurate and high quality content, but this analysis ultimately represents our opinions and these opinions are provided without warranty or guarantee of any kind. See full terms & conditions of service under the ‘About’ heading in the main menu.

Congrats on the new place, Gary! Take your time moving, don’t rush…