

Summary
Precious Metals (bull market): Correction still in effect for gold, silver and GDX/HUI. Bounce has hit a would-be point ‘B’ of a would-be A-B-C bull market correction, with would-be ‘C’ down still to come. PM complex is still correlated with the broad market. In the short-term it is likely to either decline or rise with the broad. So if broad negates its A-B-C potential, so probably will the PM. Current plan is that gold stocks are nothing special, at best, over the balance of 2026. But reassert leadership in 2027.
US Stock Market (bull market): Correction still in effect. But the limits of ‘B’ up have been hit. It’s decline now or face a failed A-B-C projection. We are in the grips of an emotional news cycle. There are very positive internal indications in play, regardless of whether or not market takes one more dump.
Global Stocks (bull market): Still a mixed bag of relatively strong and relatively weak global markets. On balance, global is bottoming vs. US stock market. Hence, a target for diversified portfolio holdings.
L/T US Treasury Bonds (bear market): No market is more subject to the drama and supposedly inflationary effects of the war than bonds. It’s not inflation, but it has been causing revulsion toward US debt.
Commodities/Resources (bull market): Most will follow gold/precious metals as usual (assuming silver leads gold). Correction still in effect. In the expected H2, 2026 market recovery, commodity-related stocks should play a prime role. We are no longer narrowly focused on the precious metals. Individual commodities are all over the place. Oil is a war-related wildcard. Outliers like uranium are technically intact and appear ready to rally.
US Dollar (cyclical bear market, L/T still a bull market): USD got clubbed last week on rising hopes of a ceasefire/war end. Players had driven into USD not because America is winning (“duh”), but because the tattered reserve currency is where liquidity is found.
Comment: Currently viewing the situation much like the 2025 correction and to a more moderate extent, Q1, 2020. What we need to do is not be thinking like the majority of investors, i.e. the herd. Hence protection and risk management first, capitalize second. That second thing is the more fun thing. Indications are that H2, 2026 will be bullish once the current correction runs its course.
Drama
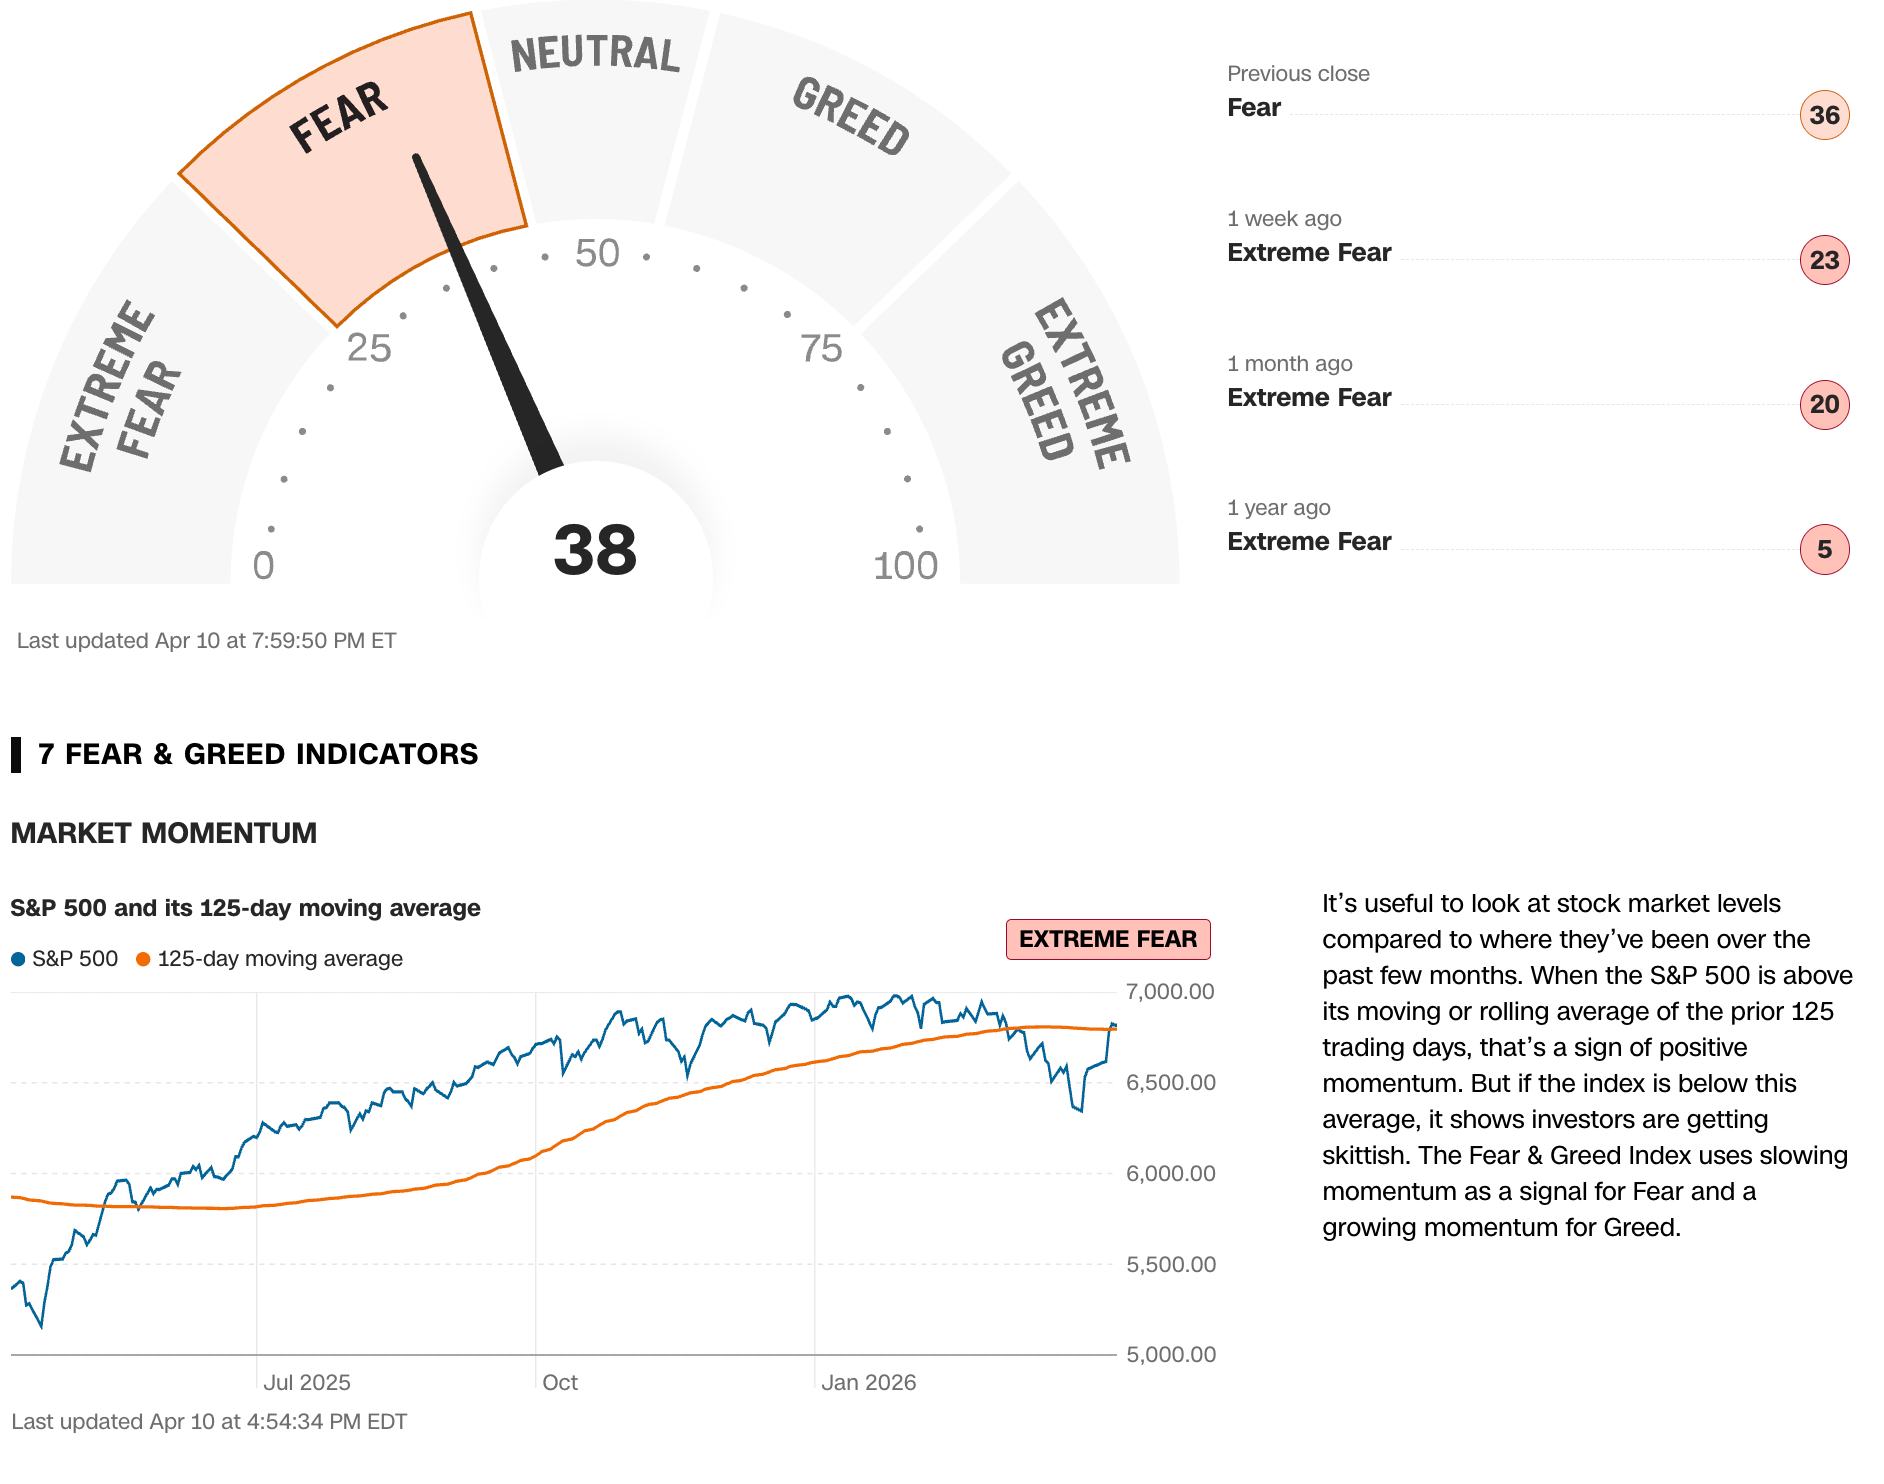
That is a word a successful market manager does not want to embody. Drama is emotion and emotion is twitchy, jumpy and absolutely not a trend. The amalgamated components of the Fear/Greed index are backing off of extreme readings as cease-fire and war-end hopes rise. I guess.
[edit] The above, this segment and most of the report were written on Saturday. Now on Sunday the news is of a non-agreement in Pakistan, with the US delegation on its way home. So yeah, drama.
Once again we note that CNN’s components – one of which is included here – tend to be clumsy. For example, the “extreme fear” noted for market momo is not extreme. It is not even fearful. It is casino patrons raising the stock market to the equivalent of our point ‘B’ of a would-be A-B-C correction. It is rising greed (like, “I don’t wanna miss the big post-war rally!” sort of greed).
As you know, I have a preferred bullish view for 2026. But it has not yet been proven to me that there will not be one more downward slam before the rally gets going. We shall see soon enough.
If you read my X content and/or my lone public post at the website last week, you know that Gary the cold market manager got interlaced with Gary the ‘getting caught up in drama’ guy. Having gotten the Howard Devoto treatment (bonus points if you know who he is), getting “shot by both sides”, criticized for being pro the US military * and called names by pro-Trump robotic morons both at the website and at Substack, I finished the week like ‘yup, what did you expect?’
So I am brushing the political dirt off of me and will stay in market management mode after I make this final comment. It is obvious that I don’t like Trump. I have disliked this manifestation of our popular culture (a tabloid and reality TV figure) since the 1990s. Not for political reasons. Just for dislike reasons. I also posted at X about the robotic Hannity issuing marching orders from his seat at the NeoCon Ministry of Information. It was pretty obvious what that was.
But on the other side of the ledger, I realized that the gang at MSNBC, or whatever it calls itself now, is a Ministry of its own sort of Information. This when I saw them mostly dismiss and lump Tucker Carlson, a guy who spoke so straight last week I feared for his life, in with showman Alex Jones and other lunatics.
Can’t have a heavily followed voice on the far right cutting too large a slice of the anti-Trump pie, now can we, MSNBC? That’s your domain, after all. Carlson also happens to be outwardly critical of the policies of the nation state of Israel (ultimately, a no-no to both sides of the aisle of our 2-party system and established media, apparently). Why is that?
This moving video sticks with me to this day:
Thus ends my foray into politics and the drama behind it. The US is my country I guess, and I can put out opinions like anyone else. But I hate it. Frankly, I got caught up and felt a little lost. That is not NFTRH.** That is me. So now…
Back to work!
* I am as ‘anti war’ and ‘anti’ the military industrial complex as anyone, and more so than most. But I respect the honor of a soldier on up to his/her highest commander. Are there bad actors in the military? Of course. But the institution and those who serve deserve respect, not the relative indignity (IMO) that the draft evader in chief and his side puppet have forced them to operate under.
** But much of it is at least interesting/interfering with our work. Hence I guess why I’ve even brought it up in the first place.
US Stock Market
So SPX has indeed rallied to a would-be point ‘B’, as anticipated.
That point will either prove out the A-B-C correction (target in the 6100s) theory or ruin it. It’s not rocket science.

As noted in an NFTRH+ update on Friday, the SOX index is making a strong case for new highs in the stock market coming promptly, rather than after a big decline. Here is how the leadership chain ended the week.
Semi leadership is super strong, and bullish, indicating a new up cycle to come. The next trigger would be a break upward in NDX/SPX. Of course, we could also wait for nominal NDX and SPX to make all-time highs, but the point is that Semi is predicting that here and now. Still, I am giving it the weekend before considering leaning in fully as a bull.

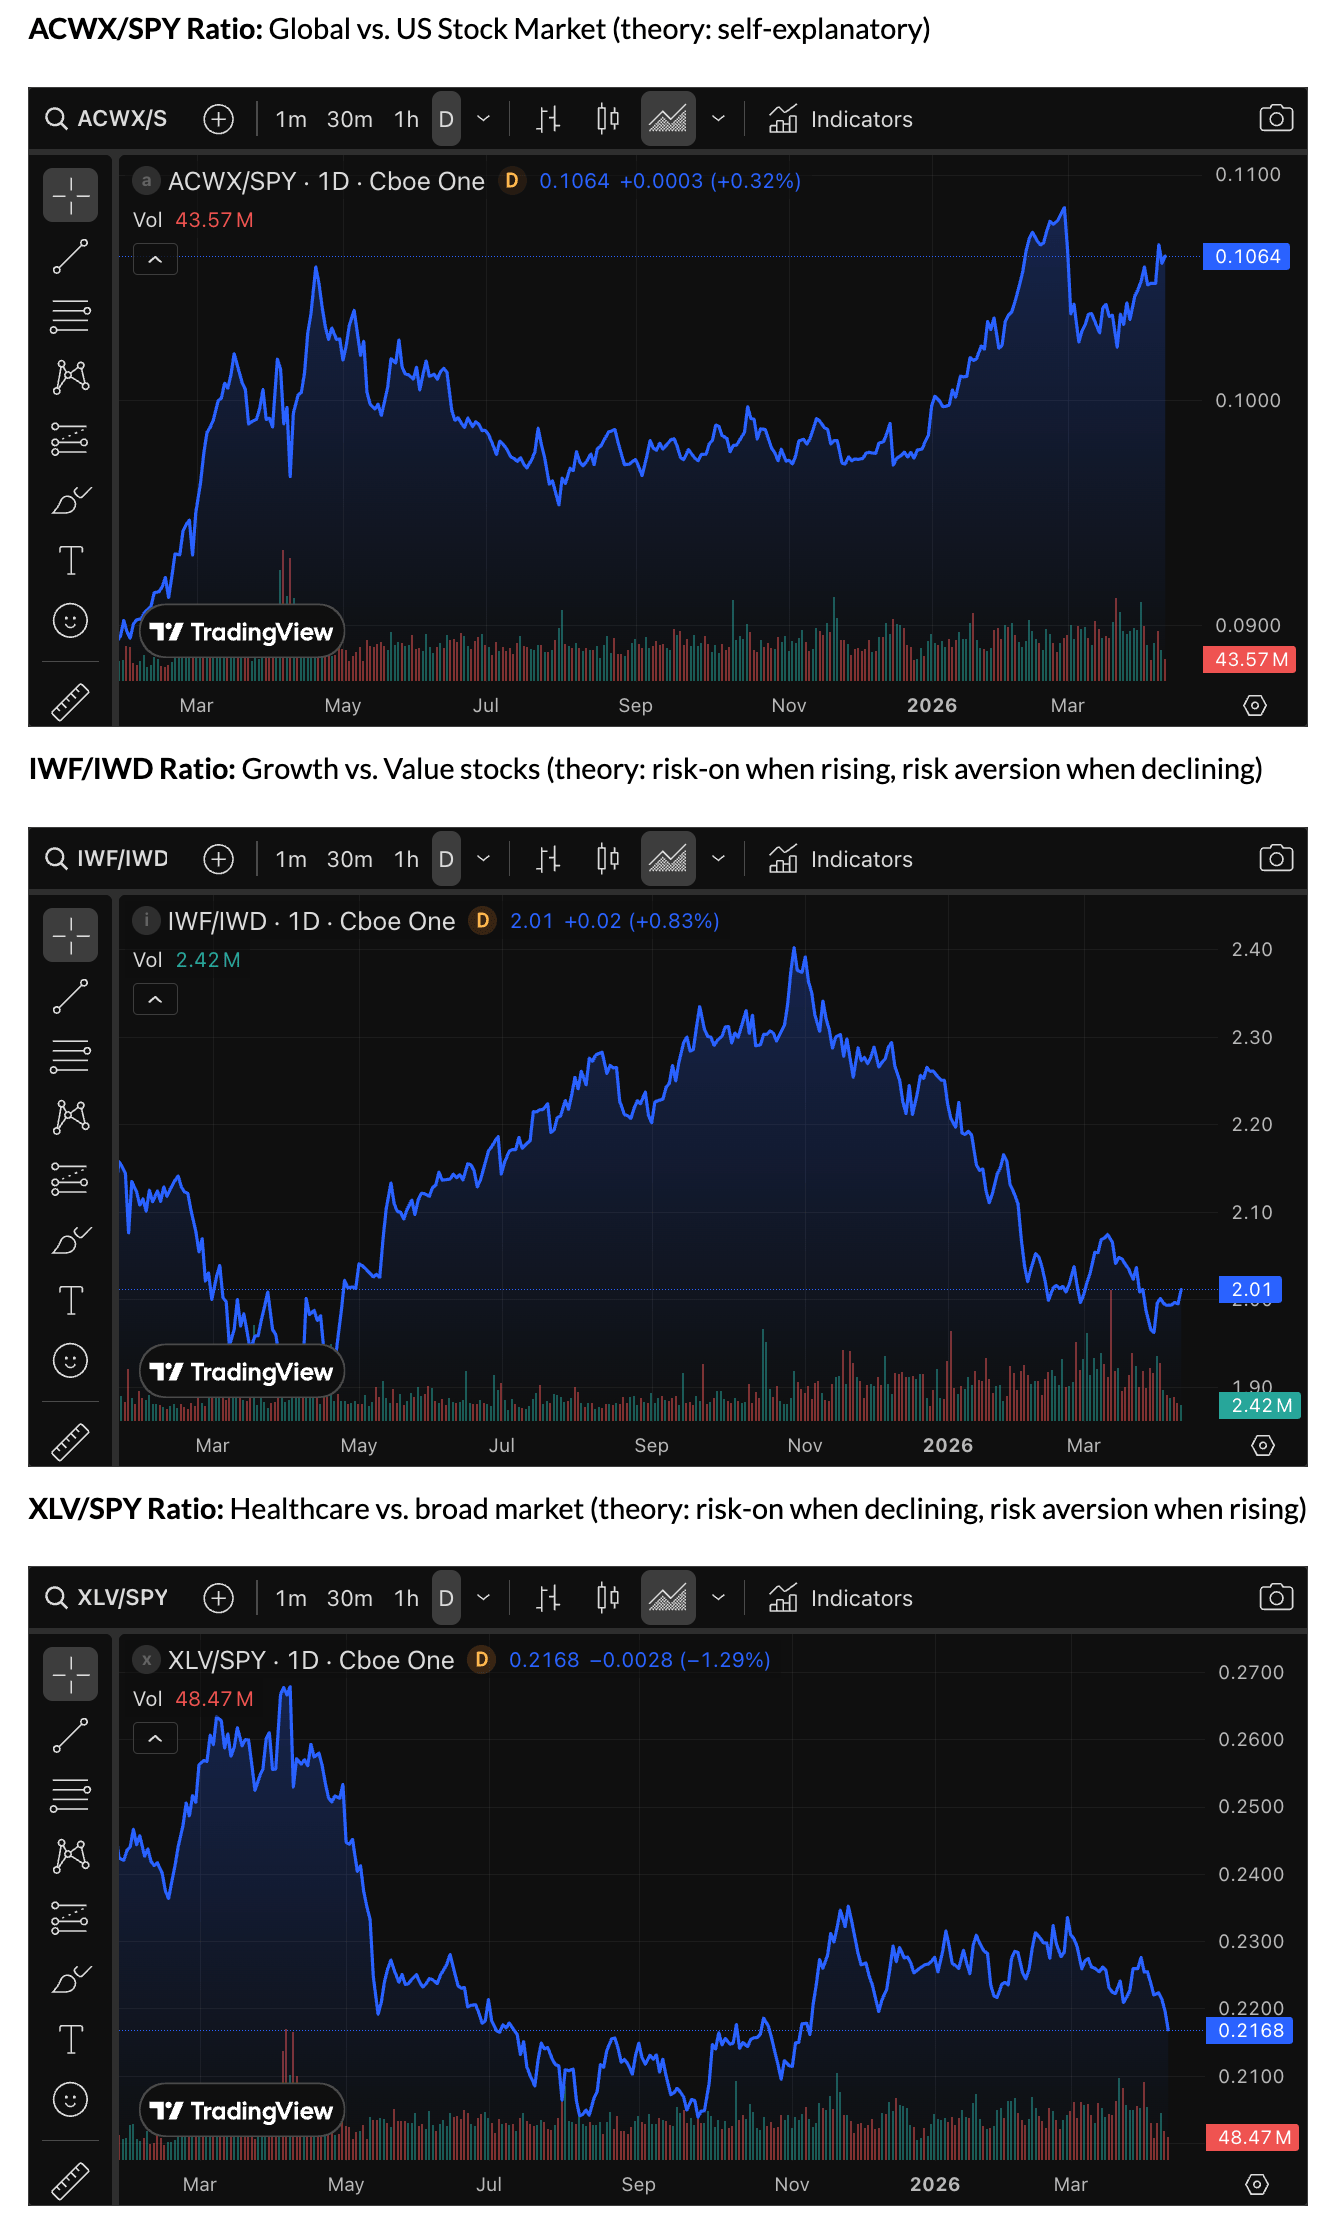
Other internal indications show that while US stocks have been bullish on the relief bounce/rally, global stocks have been more so, on balance (ACWX/SPY ratio).
Much like NDX/SPX above, bulls would like to see Growth/Value bottom and turn up, as it is poised to do (but has not done). On a bull note, the XLV/SPY ratio declined last week. It’s logical to the market relief sentiment bounce. But if it resumes its downtrend, da bulls dey gonna paahhty!
Finally, and most damningly for the bear case, the Junk bond fund, HYG (left), is bull-flagging after hitting new all-time highs (factoring dividends) last week. Its ratio to the Investment Grade fund, LQD (right) is in a bullish looking pattern. The indication here agrees with our 2026 bull view. But it disagrees with a short-term decline to a would-be point ‘C’.

US Stock Market Bottom Line
‘B’ up is pretty much at its technical limits. Market internals favor the bulls, on balance. And they favor the bulls decidedly as it stands now.
Of course, one piece of news this weekend could blow the bull view or send it upward and on its way (Pakistan is hosting peace talks this weekend, after all). Meanwhile, Netanyahu continues killing people in Lebanon. All of it is the drama informing today’s market.
I decided to remain hedged over the weekend, because if those hedges lose money as currently implied, the 2026 bull view (e.g. long-standing SPX target of 7400) should give plenty of unhedged profit opportunity for a diversified portfolio.
As for the news cycle, it is cycling positive for a market seeking justification to rally as of Saturday afternoon.
Ref. edit in the 1st segment.
Precious Metals
And once again, if/as the 2026 bull view enters the scene, the gold mining sector is not expected to be anything special, as it was in 2025. Then it was very special, as it ground upward against the 2025 correction that took down most markets. It followed its metal, gold. Silver caught on and then the band played on. Bull Cacophony in F-minor.
The way things are stacking up, I think it would pay to tune out the inevitable promotions about why gold stocks are still something special among other sectors and markets. That is gold bug obsession. Business as usual. And in that business, you could wind up being the product if you’re not discriminating among your analytical sources. I, for one, don’t know everything or even most things. Hence, I try to be very strict about whom I choose to listen to from an analytical standpoint.
So, GDX continues to decide between its ‘C’ down option, or likely, its rally with the stock market (assuming positive correlation endures). The decision point is at hand.

The GDX/Gold (GLD) ratio shows a positive internal indication. So there is no sneaky negative divergence to the rally.

The GDX/COPX ratio (weekly chart) shows the gold miners easing downward relational to cyclical copper miners. This was discussed last week.

But let’s take it further. Also discussed was that GDX/COPX has made a significant upward breakout from a long base. The operating theory is that the breakout (green line) will be maintained, while GDX/COPX trends downward during a projected 2026 bull fest. When that still theoretical bull fest wraps up, sometime after the November elections? All. Bets. Off.
The 2026 view is “gold miners are not special” (at best). Beyond that, cue Old Turkey: “It’s a bull market, you know.”
How do I know? I don’t. But I have tools that imply it. For example, the BPGDM’s intact bull market trend by its 200 day moving average. Since the bull began in 2016 the SMA 200 (green) has made higher highs and higher lows. That is another way of saying bull market (in this indicator, which provides good “buy” signals when it gets hammered during a bull market trend).
That’s the happy stuff. But I do want to highlight a process that took place after the 2016 low that ended the bear market. There was a big spike upward (like today’s), then a double tap and a triple tap to the downside. So, it’s not always a smooth ride, even in a bull market.

I also want to put picture to a caution we’ve noted lately. The spike in oil prices, regardless of its instigation, is bound to have an effect on the gold mining sector, whether to minor degree, major degree or something in between. Taking the situation at face value, gold miners are currently indicated to be over-valued relative to the Gold/Oil ratio. Over/under valuation like that can persist a long time. But it is a fact of the current fundamentals in this snapshot. Oil needs to tank or gold needs to ramp in order to rectify this.

Let’s get a look at HUI’s big picture using the chart that has guided us through bull and bear cycles for the last decade. If Huey takes a decline to the low 600s in 2026 and if the plan of a failing cyclical economy as noted above takes place in or into 2027, then we’d have a no-brainer buy opportunity for gold stocks. For now, and speaking personally, it’s hold on, baby, and hedge as needed (though I plan to take some profits as well).

Gold’s daily chart could well be looking for a ‘B’ high of its own. It has certainly done enough downside work to be a viable correction ender. But there sits ‘B’ at the 50 day moving average and also, a look at a chart of GLD would show waning volume as the rally persists. In other words, it could be a bear flag.

Silver is also vulnerable below resistance and its 50 day moving average. This despite and okay looking RSI and a deep correction to a low of 61. If the sector corrects, perhaps silver only gets dropped to a test of its uptrending 200 day average (orange) in preparation for future leadership. But the 53 area looks like a magnet, and could be a table-pounding ‘buy’ if registered.

Precious Metals Bottom Line
It’s a long-term bull market, within which the sector is still in correction mode.
In 2026 that bull market may be just another rising asset market, at best. Gold stocks, and energy consuming miners in particular, could hit a rough patch if the Gold/Oil ratio is not promptly remedied to the upside, as the miners are indicated to be over-valued per their relationship to this important indicator.
My strategy will for the foreseeable future be to view the sector as not special, unlike 2025. And I will hedge as needed, or do some selling/profit taking at any time. While at the same time I plan to hold indefinitely favored core items, with exploration stocks and royalties, which do not consume much if any energy, favored fundamentally.
Global Stock Markets
On that last note, let’s view the Canadian TSX-V index in relation to the senior TSX index. For indications on junior mineral exploration, it will be important for TSX-V/TSX to hold the low it made in November, and not make a lower one.

On the plus side, the nominal TSX-V has held the uptrending 200 day moving average and taken out a clear resistance (now support) point. Last objective is to take out the 50 day average and then it’s full-on bullish.

Regardless, the chart aids my personal resolve to continue to hold related items like Cu/Au explorer AE.V/AMEGF and Ni explorer TLO.TO/TLOFF, to name a couple, along with other multi-metal and precious metals exploration names in the portfolios below and on watch.
This weekly chart of the ACWX (world, ex-US)/SPY ratio continues to beg diversity into global stocks. I have done that with premier Semi Equipment stock ASML, did that with Taiwan Semi HIMX, before quickly taking a good profit, and last week adding Chinese large caps via FXI. If this pattern and potential trend change holds up I want to increase the proportion of global stocks, which do obviously include many of my Canadian-listed exploration plays.

Commodities
It appears that market relief is in the bag this weekend. “Appears”, now let’s see that appearance turn to reality.
Again, ref. the news cycle in play on Sunday.
Commodities will probably be volatile as a group because crude oil is in the cross hairs of a would-be relief fest. CRB index was driven to target by the war and its effect on oil…

…and so, if relief is the play, CRB could be pressured.
But the index is more than crude oil. Many other commodities (included in CRB and the less traditional items outside of it) have had solid corrections during war time. One example, which we noted in an NFTRH+ update last week, is uranium.
If the goal is to buy items in bull markets on their pullbacks/corrections, URNM fits that bill. I increased my position and added back UUUU to go with my UEC holding.

Then there is the Lithium patch, and while its chart is not quite as good as URNM and some of individual uranium stocks, I added SLI for Li exposure.
I also want to not be too cute about re-buying REE exposure. First on the list is MP, with IDR on watch. I let former holding LYSDY fly away and folks, that’s the markets; always teaching lessons. UUUU is a rising processor of REE as well.
Due to uncertainty about the market’s next direction, I forced myself to take profits on 2 of 4 copper stocks, ERO and SCCO. Quick profits, booked. Still held are FCX and unconventional copper play, ARREF/ARG.TO.
Because I am Mr. Diversity, I purposely held onto Fertilizer play IPI and Gas play AR, which I think are subject in a negative way to the war relief trade. This in much the same way I held onto several software stocks that have gotten clobbered for the 2nd time in Software AI-maggedon2.
Final Note
This leads to a closing thought.
That diversification is thing, baby. As long as the balance of the portfolios are doing well, I’ll continue that way, while not obsessing on or overly trying to chase the market’s internal rotations. I’ll try to cover as many viable areas as possible, including global. Hedging is part of that balance.
Portfolios
Gold is long-term risk management & monetary value/stability in a balanced portfolio.
Taxable “Savings” Account
In order of position size. Hedged. Generally, this account holds what I feel are more stable items. Mainly, cash and shorter-term Treasury bonds. But also more established gold royalty/mining, and exploration that has track record of drilling success (AMEGF & TLOFF). Exception is PMI.V, which I could only buy on Canadian exchange at time of purchase. This is my only account set up for direct purchase of global markets.
I am not yet letting them force a booked tax loss on me with NOW. Other “bull stocks”, especially Semiconductors, are doing well.

The taxable account carries high cash levels as long as cash and equivalents are paying out. This is considered a savings account of sorts, rather than a speculation or even investment vehicle. The goal is to speculate around the periphery. In another market phase (e.g. post-correction/bear/crash), the account may get more in the game.
Trading Notes
Trading account is patiently all in cash, retaining its 2026 profits and laying in wait for the next perceived ‘no-brainer’. Of course there is no such thing. It’s the markets. But I shall wait like a mother hen if I have to for the next clear, low risk/high reward opportunity. Whether it be bearish or bullish, coming soon or after a long wait.
Roth IRA (non-taxable, no contributions)
The chart
Cash is 19%, short-term and inflation protected Treasury is 39%, long equity is 32% and short/bear positioning is 10%, but effectively working about 2.5 times that level, around 25% due to its leverage. So theoretically the portfolio is biased long, but not by a whole lot. It’s certainly got shock absorbers installed.

Cash & income-generating Treasury bonds are at levels that are right for me and my real-world situation. Your situation is different. Cash will be adjusted as needed.
Refer to the In-Week Notes under the NFTRH Premium menu at nftrh.com for market talk and occasional trading info, if interested. Also, you can follow on X @NFTRHgt for notice of updates.
NFTRH is not to be distributed to third parties without prior written consent
Notes From the Rabbit Hole (NFTRH) is a weekly market report in which we provide analysis on financial markets. We make every effort to provide accurate and high quality content, but this analysis ultimately represents our opinions and these opinions are provided without warranty or guarantee of any kind. See full terms & conditions of service under the ‘About’ heading in the main menu.

Great work as always Gary. As for the politics around Iran. If that represents an energy drain and distraction, then please be careful. In my own experience, no matter how thick-skinned I like to think I am, there is a cost to voicing an opinion online, particularly among people you have relationships with. It can be a little distracting and draining to be called a hater, a fool, and so on.
I respect your opinion very much. And I do so with respectful and polite disagreement. For what it’s worth, my view is simple: people yearn to believe that there is a better alternative than violent action against the Iranian Mullahs and their proxies. But I don’t see what else can be tried anymore.
I think the last fifty years demonstrate that a new way is needed. Perhaps Trump and the USA may fail in its ambitions here. But I appreciate that someone finally is trying to do something different with these psychopathic Mullahs. I never supported democracy building in Islamic countries because I think they are inherently totalitarian because Islam is. Although I don’t dismiss it altogether and feel the Iranians have a chance. But if a Shah-like figure ever emerges over the Mullahs, that is a massive win. It would probably require someone like that to violently suppress the swath of Iranians who are incurably Islamic theocrats. I suspect democracy is not up to the task in such a place but I would love to be wrong naturally.
I write this to show that someone like myself can hate war, see its limits, reject democracy building in the Islamic world, be resistant to meddling in the world while understanding that our withdrawal would only ultimately lead to a worse outcome as totalitarians like China and Russia would expand their influence, yet believe that the Mullahs are sufficiently deadly and evil to take action against nonetheless.
In my view the only real choice is to destroy them unless we want them to continue on as is. If we can embolden Kurds, Jews and even Arab neighbors to take up the fight in a land war against them that would be magnificent and probably the only way to finish them. Probably a pipe dream but if the Mullahs ever look weak enough then who knows. Maybe possible. I just hope Trump has the balls to keep going. I don’t know if he does.
Actors and pundits whose greatest concerns are their image and relevancey have zero understanding of the threats that Israel and its people have faced for thousands of years. Criticize politicians all you want, but if you think a country can’t protect itself from a terrorist regime and its proxies then don’t expect any mercy when that terror is at your door. Israel has given away more land than they’ve won to achieve peace, and the world thanks to Tucker et al, believes they’re genocidal aggressors. With a son serving there I know for a fact they take all precautions to prevent unnecessary deaths, unlike the enemy who targets civilians. The threat they face requires everyone serves, an iron dome, safe rooms and everyone living life knowing it can be taken by a stabbing, a suicide bomb or missle fired by Iran, its proxies or those who’s religion calls for the death of Jews AND Americans. No one wants peace more than Israel so if you think Netanyahu is flippantly “killing more people” like some devil- just know those people are Hezbollah terrorists and some of those terrorists have children studying and living in the US on Iran’s dime. No one wants war- only psychopaths and that’s what Israel and the US is fighting. Unfortunately it interferes with our trading.
Amen Jon. I can see no other possible conclusion to draw. I hope the US and Israel can see this through somehow. The thought of these monsters continuing as is sickens me. They are the worst fiends on earth. There is no comparison to them. No country on earth shares the values of the United States more than Israel. I would argue they are only true friend. I stand with them to the end.
The youtube video you posted ends with: “How can you do what’s been done to your ancestors and yourself, to another people?” I’m not a psychologist, but it kinda make sense to me. Plenty of individuals who have been abused in their childhood become perpetrators later in life. Psychology may be fractal. Trauma’s make us overreact in new situations cause of situations in the past . There were 2000 Israeli’s killed during the Oct 7th attacks, but more than 70,0000 Palestinians have died since (and the vast majority were women and children). Is that an overreaction or justice? I’m convinced that Iran’s regime consists out of fanatics who are responsible for terrorism in the region. I’m much less convinced that you solve that problem by killing a few guilty people, a lot of innocent people, and taking their oil. In fact, it will make things worse IMO. Moreover, in the not too distant future practically all nations will have access to nuclear technology, which cannot be stopped in the longer run.
Sound analysis, Bart.
Iran had not violated their JCPOA agreement before the US president tore it up. You figure if Iran has been building a nuclear weapon for 24 years, they would’ve been done by now. You have to be blind and deaf to miss the obvious geopolitical stake for each entity here. A 1953 CIA coup kicked off all of this. It has been under sanctions for 47 years. This has done irreperable damage to this country.
I mean the masses fell for the Iraq WMD nonsense, it was bound to work again. Propaganda is great at making you hate other human beings and believing they will be responsible for ending your way of life as you know it, contrary to any reliable evidence. Unfortunately, evidence is now in the eye of the beholder and a partisan endeavor
I don’t believe anybody. Certainly not those with an agenda, or those who are just flat out insane. If somebody speaks directly to me and clearly makes their points, I consider them and either agree, disagree or see some middle ground. All too much of what I see flying around out there today is bullshit and robots, IMO.