

Summary
US Stock Market: It is here. The time target is Tuesday (+/-). The SOX > NDX > SPX leadership chain is nearly broken and most indicator signs point to the bear. Perfect setup for a massively bullish outcome during a massively emotional week to come! Just kidding (sort of). I remain firm in the bear view out ahead, but anything can and probably will happen in the short-term.
US Market Sentiment: Biased over-bullish, although the Halloween smack down adjusted the over-bullish readings. That at least opens the potential for a short-term bull move.
Global Stock Markets: Still bullish on balance, but under pressure lately from the USD spike. Still trending down relative to the US on balance (ACWX/SPY ratio). A theme of global rotation to Asia/EM could be in play for 2025.
Precious Metals: Last week we noted… “Short-term pullback not yet technically over.” Still the case. Short-term in pullback mode. Medium-term vulnerable to the broad markets. Long-term, bullish amid a “new macro”.
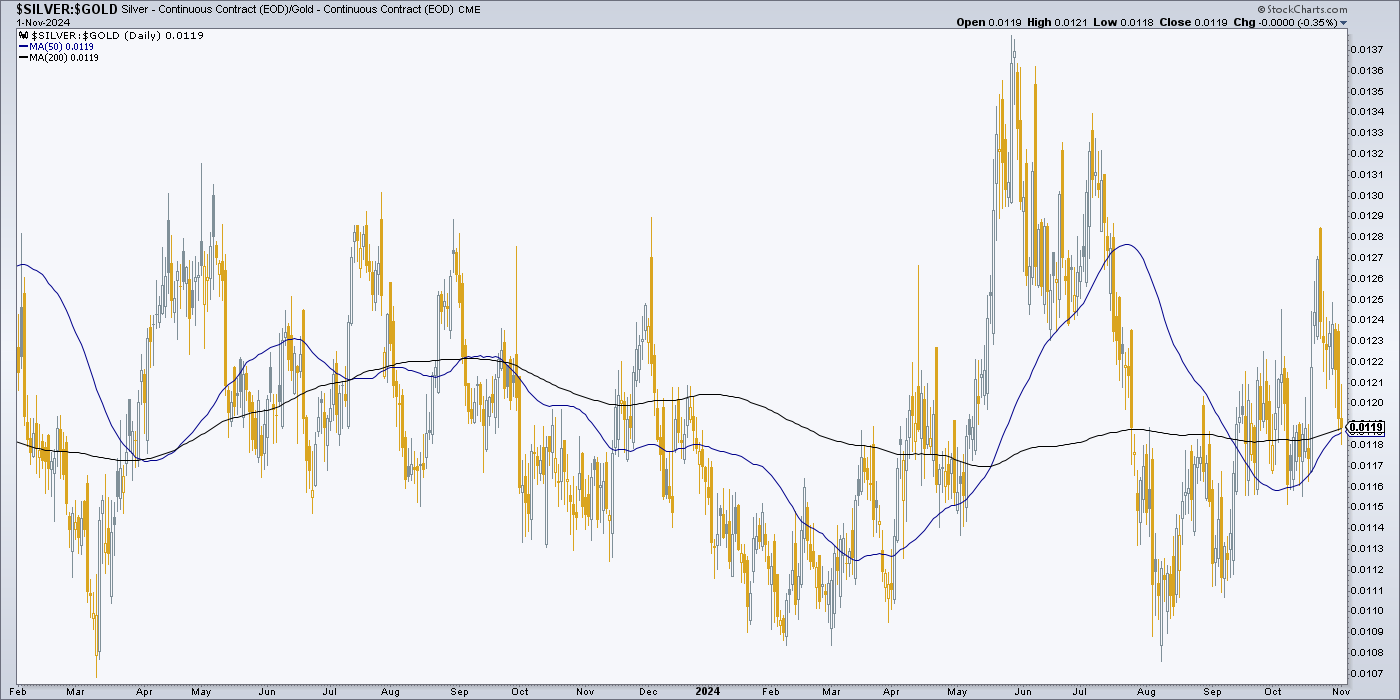
Commodities: Last week… “A continued mixed bag of leaders, laggards, bottoming “catch-up” plays and non-starters. A weakening USD would help here, as would a rise in silver vs. gold, which made a big move on Friday.” This week: Silver/Gold ratio got hammered back down with the end of week market disturbance. It needs to hold here to remain positive for commodities, precious metals and other items that get caught up in the inflation trades.
Currencies: All eyes on USD, as usual. It is the global reserve currency and it is ‘anti’ much of the globe. Long-term bull market, short-term (assumed) short-covering spike at a decision point here and now.
Indicators (as per last week): Everywhere you look, there is risk. Risk in ticking time bomb indicators like the 2yr/T-bill divergence to steepening yield curves, to the sleepy real-time Junk bond spread indicator, to the still depressed but diverging VIX. Risk, baby. The bull market is towing that word around with it every step of the way. With our “to or through the election” time target a clear and present objective, risk awareness is highly recommended.
NFTRH 834 goes free form conversational ahead of a week with a lot of emotional energy built up
T-Minus…
Well, it’s here. Election week. Where a post-hubris nation, “leader of the free world” eating itself from within, will elect one candidate hated by a hundred million (+/-) people or the other candidate hated by a hundred million (+/-) people. What a mess.
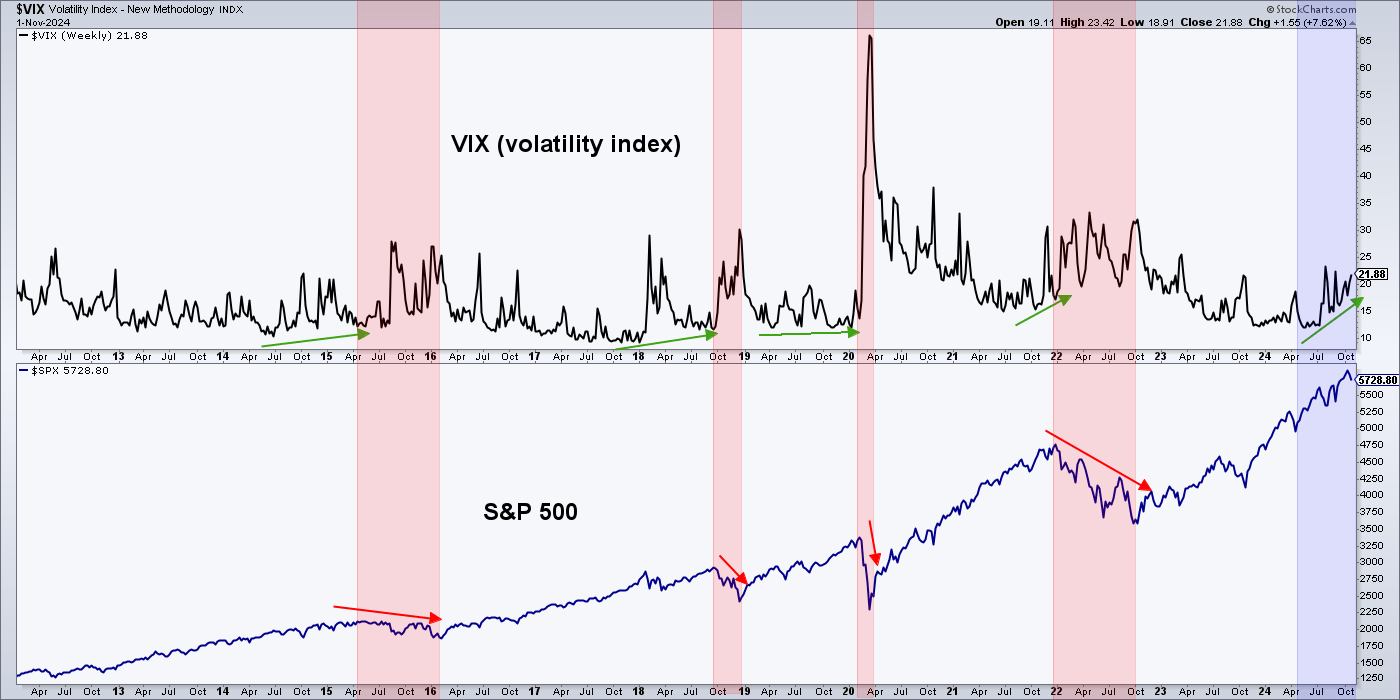
However, here at Market Management Central, we are focused on how it will shake out for stock prices, eh? Eh! I am going to put the VIX divergence front and center and ask whether this time it is lying, or maybe right on schedule? Market experience has taught me at least two things…
- Respect the indicators, and…
- Expect the unexpected, in other words logic can be denied by the markets indefinitely.
In the Greenspan > Powell era we have come to expect full frontal Wonderland in market outcomes. We have come to expect the logical not to happen while of course the illogical happens yet again. Every damn time under the watch of policymakers who can – by their own admission and previous actions – print new bull markets after printing the end of brief and periodic bear markets during the era of intense market manipulation by policy.
They call it QE, they call it MMT (Modern Monetary Theory). I call it TMM (Total Market Manipulation), because that is what the purposeful interference in the bond markets in order to monetize and print is. Interference in what is supposed to be a free market. The largest market on earth. The bond market. Throw in the opportunities for monetary policymakers to eat microphones and tend the public’s perceptions along with always-willing-to-meddle government (fiscal) policy, and there you have it. A manipulated mess, spanning decades.
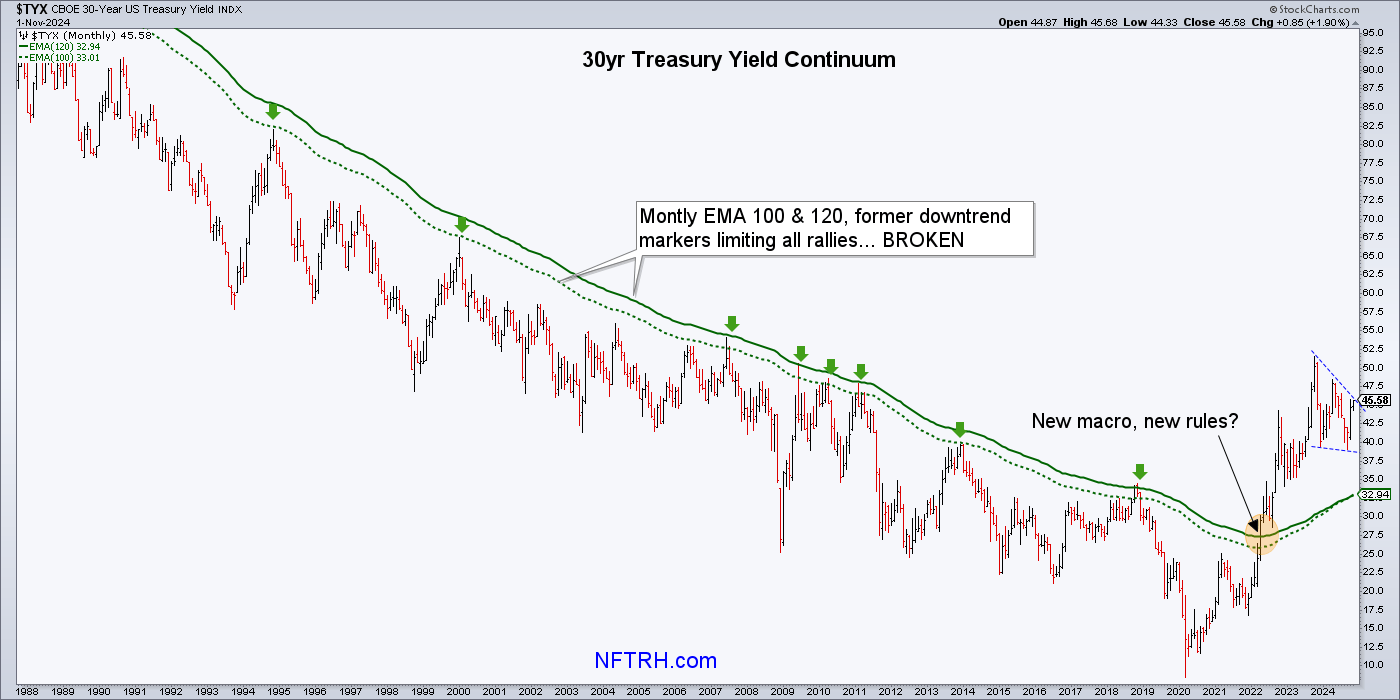
But my theory, in development ever since the Continuum busted the long-term trend in 2022, is that though they will try to save the day as usual on the next downturn, the efficacy of policymakers’ (monetary and fiscal) efforts will be impaired by the ruptured bond market, which suffered a rebellion that began with the 2022 trend break and continues to this day, on the bigger picture.
The Continuum is not the only way to look at the big picture macro, but it is the most elegant and simple way I know of to tell or understand the story. Not Alice In Wonderland. That is a children’s story. Rather, the reality of a break in trend that went back to the 1980s and in my strong opinion, supported all manner of monetary and fiscal policy aimed at benefiting the economy and the markets. Mission accomplished, with a few interim meltdowns… until 2022.
Simply put, at best future bailouts are going to cost more for the government due to higher rates of interest. The Fed can buy bonds and print all it wants, but the post-2020 reaction to the Fed’s inflationary (printing) actions in Q1 of that year has changed the dynamic. The old rules, still dutifully followed by 75% of individual investors, as you will see in the Sentiment segment below, no longer apply, in my strong opinion. Again, I will not claim to know the detailed implications of what’s ahead, other than it is probably not a good idea to operate by the rules circa 2001-2022 (or 1980-2022 for that matter).
At best, credit creation (that is, the creation of the bullish fuel for the 2001-2022 market era) is going to cost more now, unless the break in long-term yield trends is reversed. As the chart above turns the slow-moving monthly moving averages upward, I would not bet on that. What I would do is continue to view those moving averages as support for any renewed yield downturn.
However, with the yield in a bull flag right now, we can be open to a break upward sooner, rather than later. As yet, it has not broken the flag upward and our plan is and has been for the interim pullback in yields to resume. A renewed pullback would come with a resumption of disinflationary Goldilocks (after the recent bump up in inflation signals), or a deflationary liquidity event. An upside flag breakout would represent resumed inflation problems sooner, not later.
Oh and we just happen to have the election and an FOMC meeting this week (a near unanimous .25% cut projected by the CME wise guys), following a poor October Payrolls report. There is a lot in motion. Energy everywhere. That is the sum of the emotions of millions of casino patrons and the machines some of them program. However, despite the creeping divergence by the VIX shown above, High Yield spreads have remained submarined as of October 31. No trigger yet. Speculators are implied to be as cool as a cucumber despite the gathering danger signals.

Or Perhaps, the Analysis is Wrong
Maybe the overwhelming balance of evidence pointing to a coming top in the risk-on, cyclical world is what “everybody knows” and your letter writer is being a contrary indicator. I am not joking about that. I take very seriously my efforts never to be that dreadful thing, a C.I. But we have seen the movie before where, against all odds, our Keynesian policy heroes are able to reset the debt-leveraged macro to positive appearances.
I just don’t think that is what the outcome will be. This week anything can happen, from quite bearish to explosively bullish. Our “to or through the election” target has not officially been registered, after all. I am not discounting the “through the election” aspect. SPX measures higher. Risk is completely ON and momentum can carry itself indefinitely. We do have a dangerous VIX divergence, but we do not have a trigger (like the HY spread above).
We also have a steepening yield curve and the knowledge that while it is a young steepener, eventually economic bust periods ensue during curve steepening.

Sentiment
Market sentiment was over-bullish as usual until Thursday’s sharp drop (Halloween, Oct. 31) right-sized investors’ psyches. Just prior to that day NAAIM were moderately over-bullish (82%), while AAII was neutral at a 1.28 Bull/Bear ratio, with the reading apparently taken on that day after the market’s decline (the reading dropped like a stone from 2.4). Investors Intelligence was at a neutral+ reading of 2.69 on Oct. 29, still down hard from a previous over-bullish extreme of 4.4.
Dumb money took a nose dive as well, putting stocks back to a moderate risk profile from a previous extreme risk reading. The graphic curiously includes no bond data, but at last check risk/reward was extremely positive and that is still the case from a contrarian vantage point (contrary negative for yields). Look who is sporting the highest risk profile. The “safety” asset, gold.

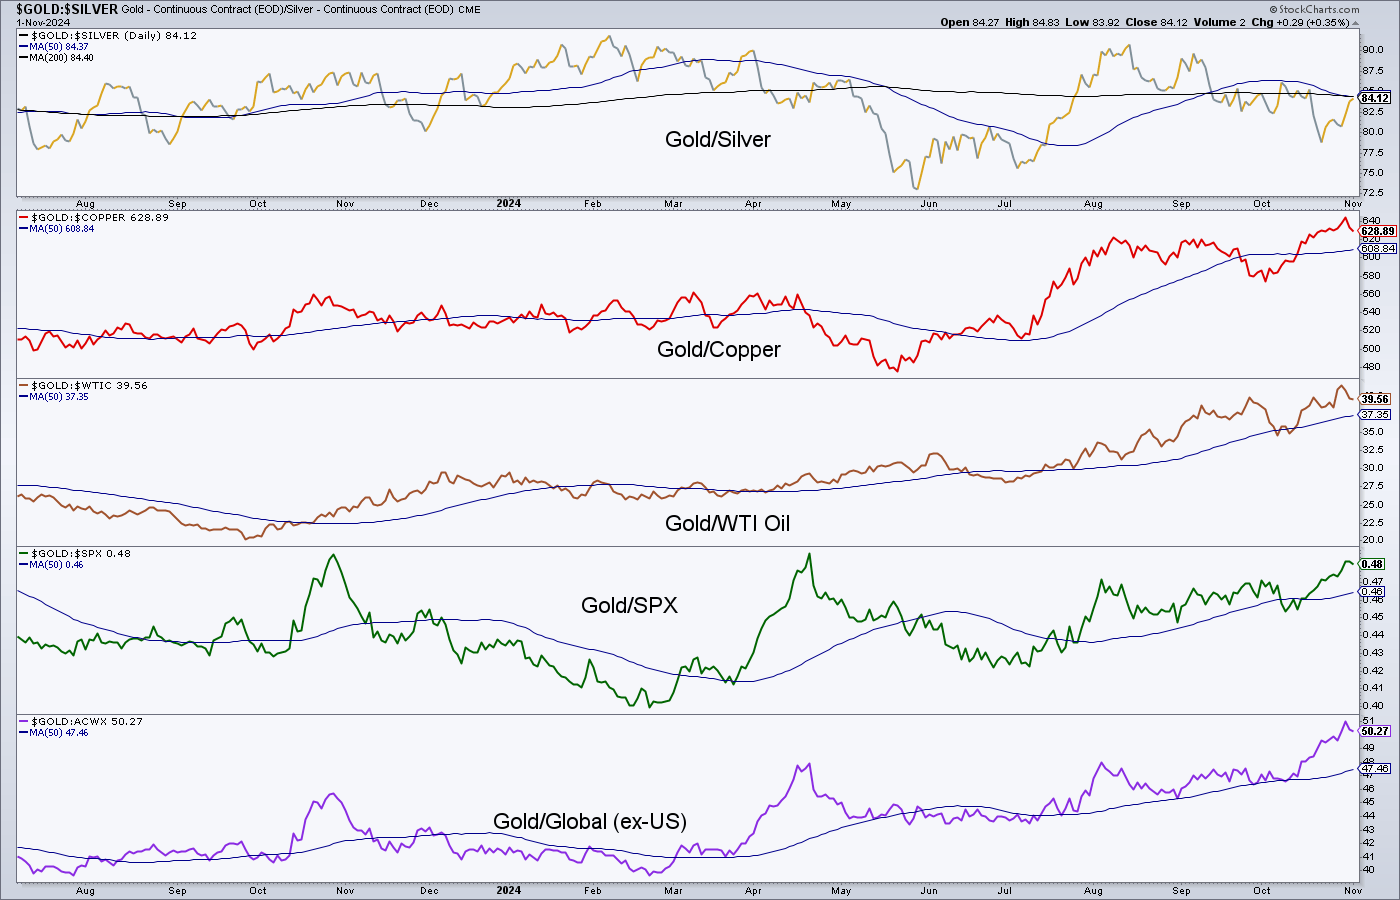
Check this out. If gold is at contrary sentiment risk in the nearer-term, that is not at all the case on the bigger picture. AAII members are fully burnished into the mindset of the last several decades. They do not realize that the macro has changed, as they follow the old rules. See the Gold/SPX ratio chart in the next segment and tell me that stocks are going to thump the precious metals in the next 5 years. Eh, I don’t think so.

Once a sheeple, always a sheeple, I guess.
Charts, etc.
No real technical damage was done to SPX (daily) last week. Indeed, the hard drop on Thursday might have served to clear the sentiment deck for a bullish reaction to this week’s incoming info/data blitz. Lose the SMA 50 (blue) and then we can start talking (at least some) technical damage. I hold my short with no undue hopes for its success at this time.

HUI Gold Bugs index failed its channel breakout and then failed the first short-term support level. The important area to hold is 310 (+/-).

HUI weekly shows the unregistered next target of 375+ and a jigsaw grind upward toward it still in play.
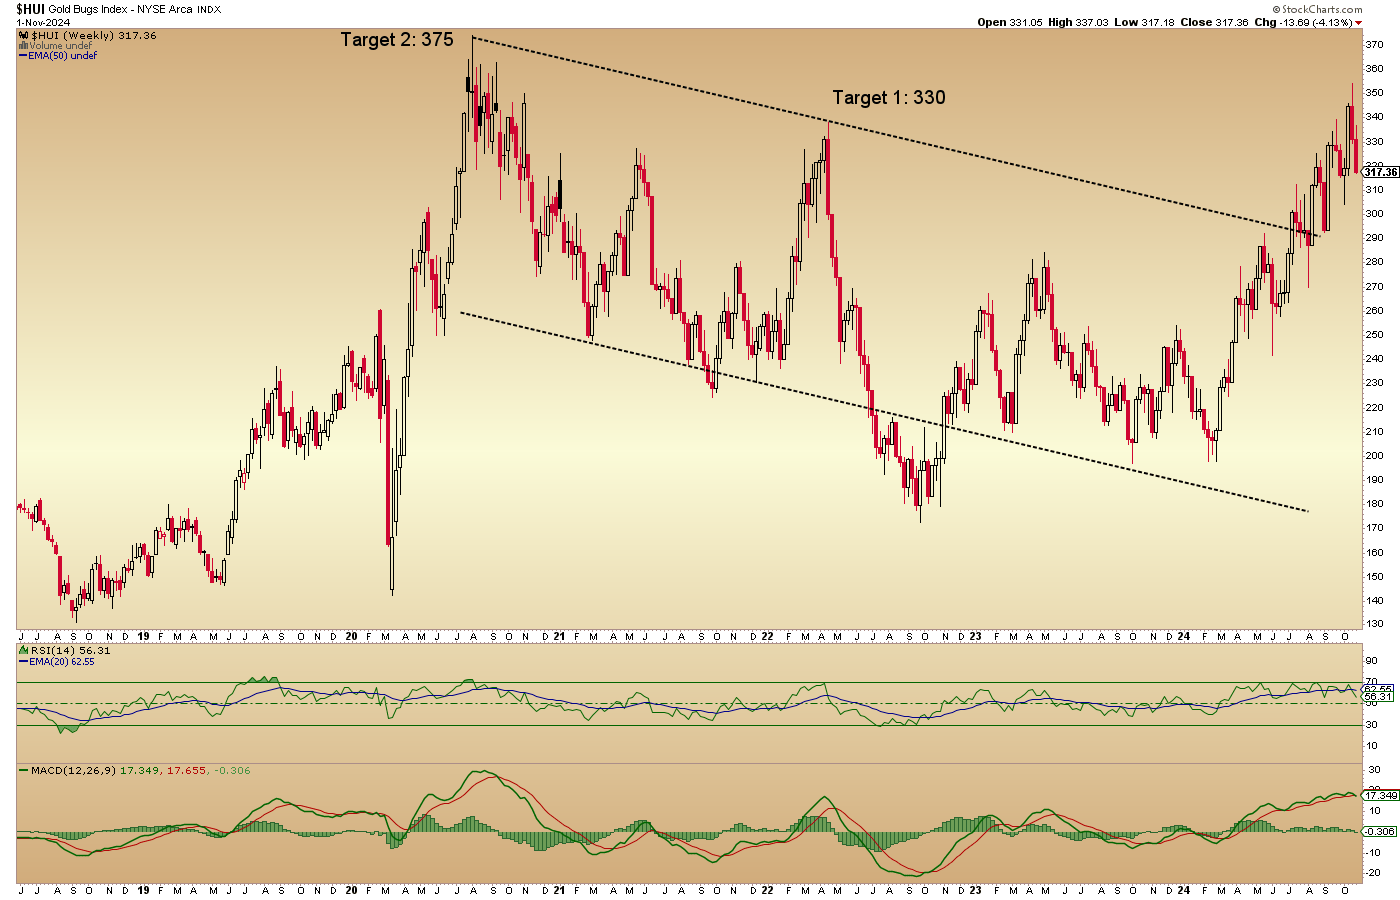
HUI monthly is completely normal and would still be normal, even if it were to drop to test the 200 day moving average (274 and rising, per the daily chart above). That would entail a temporary break of the upper channel line, which could really scare the hangers-on out of the sector, if it comes. But first things first. HUI is intact on all time frames.

The HUI/Gold ratio is a sector internal indicator that should hold right here and now or it will flash a warning signal. The ultimate vulnerability for gold stocks could be their positive correlation with the stock market and other cyclical markets. But at least HUI maintains its out-performance to SPX since March. Not bad, Huey.

Meanwhile, the bigger picture macro obviously favors gold over stocks on a risk/reward basis. How can it not with this multi-year base being built in the Gold/SPX ratio? But individual investors (AAII) favor the exact opposite. Perfect!

On the short-term picture, gold is trending up vs. everybody (except silver), just the way we’d want it for a counter-cyclical macro view and in silver’s firmness, for a still-intact bullish view for the precious metals complex (but fix that HUI/Gold ratio, Huey!).
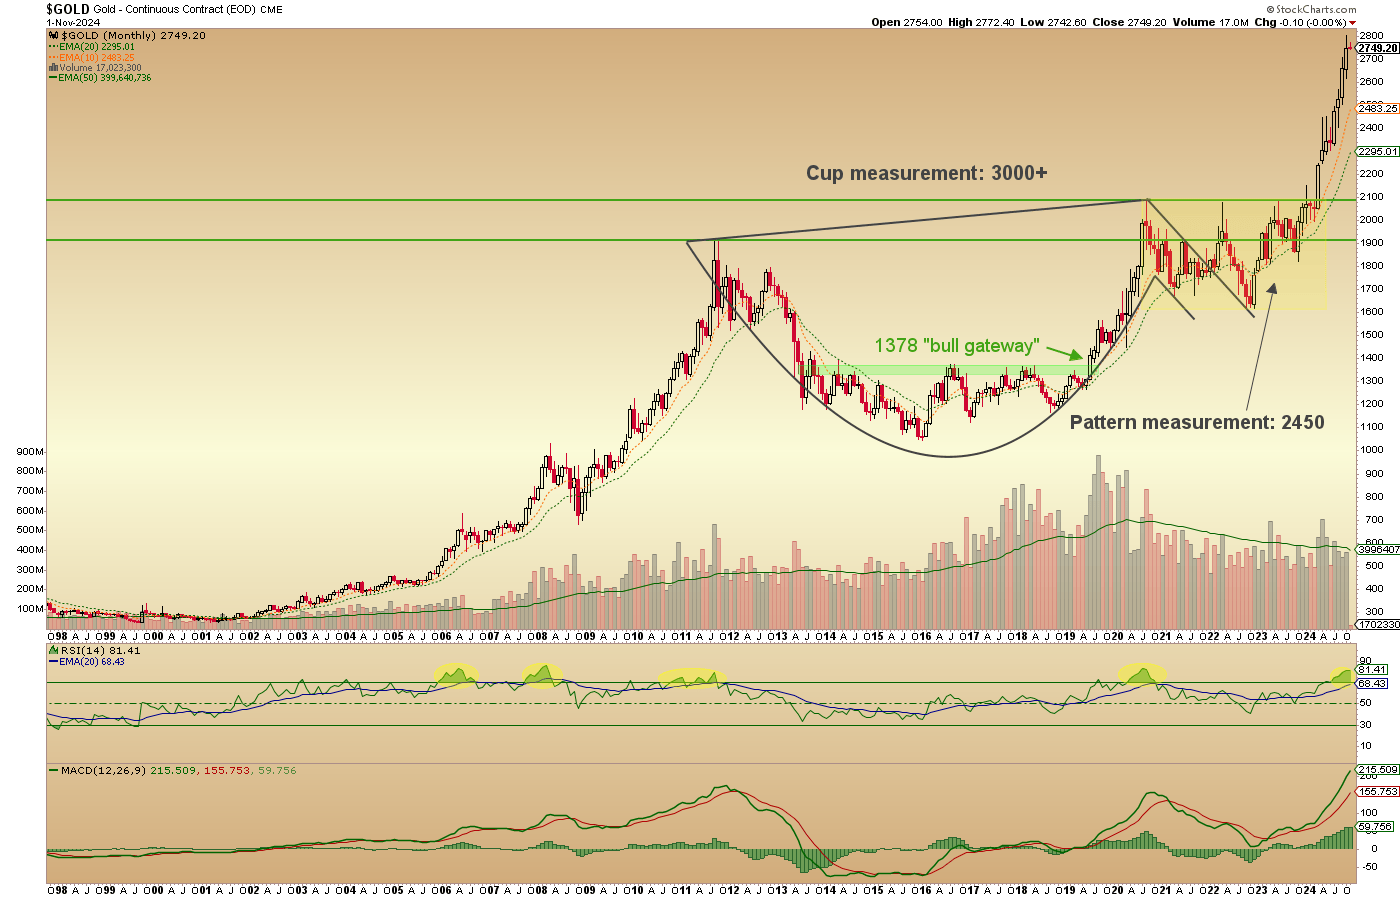
Gold (monthly chart) is within a whisker of the target that was established when the Cup made a higher right side rim than the left side in 2020. Monthly RSI is vigorously overbought and MACD is fairly hysterical. Big relative volume is driving the spike toward target and regardless of the bigger picture macro view, a purely unbiased TA would look at this and think two things: Bullish & Risk.
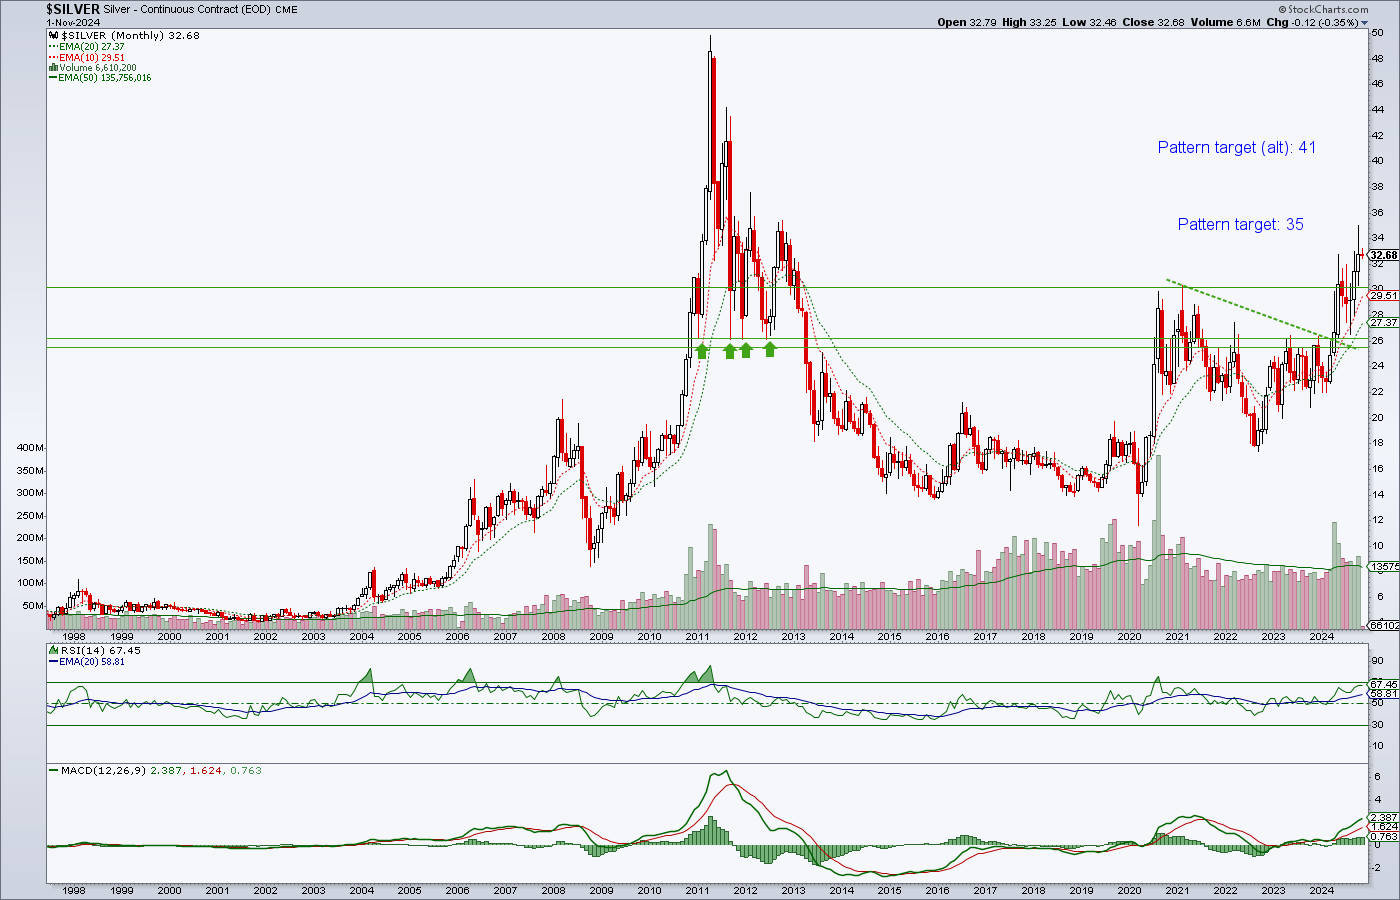
But silver begs to differ (with the implied risk in gold). The monthly up volume is impressive and all things being equal, there is no technical reason to call “rally over”. The 35 target has already been dinged. Question is, one more rally to the alternate target or not before correction?
Global Status
ACWX is still bullish as it has pulled back within an uptrend. But it is also still firmly in a downtrend in relation to the S&P 500. Hence, having more familiarity with the US markets, that is where I continue to concentrate rather than speculate about what may be driving or impeding any given global market. The exception could be if the US dollar resumes its bear phase. Then we’d have interest in Emerging Markets and other anti-USD areas.
Here are some quick thoughts on some global areas:
- Europe: STOXX 600 made a sharp drop last week, is grappling with uptrending 200 day average and is at a higher low. Technically intact.
- UK: UK 100 is in a similar status to Europe.
- Emerging Markets: Looks like a buy setup upcoming after a pullback under the weight of the strong USD. All it probably needs is for USD to fail. Interesting. Perhaps a buy could manifest at the SMA 200. That is the “technical” of it. Not necessarily the “macro” of it.

- Asia (ex-Japan): is in similar shape and China large caps (FXI) and Hang Seng are more volatile versions of something similar. They went up harder and are pulling back sharper.
- Japan: Nikkei is technically neutral right now. But let’s also realize that it has hit and long since exceeded our big picture upside targets. Personally, I’ll leave it alone.
- India: BSE Sensex is in correction from its September high. Current price is 79,724. Uptrending daily SMA 200 is 77,028. Clear support is at and just below 75,000.
- LatAm/Brazil: LatAm 40 looks bad, as it held below its 50 and 200 day moving averages and is turning them down. Brazil, same story.
- Australia: AORD is in a normal pullback within its uptrend. It is chewing on the SMA 50 (8404) now and could drop to the SMA 200 (8107) and still hold its major uptrend.
- Canada (senior): TSX is an even more bullish version of AORD above. It has started to correct its overbought situation, but has not even gotten to the SMA 50 yet. Looks extended still.
- Canada (junior): TSX-V will be a tailwind for the smaller precious metals exploration stocks and of benefit to the commodity/resources trades in general if it holds support and/or the moving averages. If it fails these markers, Captain Obvious says it would be negative.

In essence, the 2024 macro has a play that could see global capital migrate to EM/Asia/China and away from the US. But for now, much of the world is under-performing the US and much like the precious metals, could be vulnerable to a coming bear market in the US because of its generally positive alignment with the Good Ship Lollipop’s markets. But something impulsive went on with Asia/China/EM in September, and a 2025 capital migration is a possibility. Let’s at least be open to it.
US Dollar Index
The US dollar is still the primary global currency, BRICS-related “dedollarization” or not. As we have noted for years, USD is in a long-term bull market that began in 2008. However, the daily chart shows what looks like a short-covering spike within a newer series of lower highs and lower lows. Until USD breaks above the April high of 106.52 the lower highs/lows should be respected. If it one day takes out that high, I would hate to be long a majority of the macro.

Bottom Line to NFTRH 834
Commodities are not included this week because they are a tag-along to everything else during an emotional week. If the markets hold firm and the USD tumbles, commodities should do well in their usual non-uniform way. If it goes the other way and markets implode, so too should commodities.
Since March, the precious metals have been a leader of the broad 2024 rally, with gold, silver and HUI leading SPX, which is leading the balance of the world. If things go negative, I’d expect the PM complex to come under pressure due to sponsorship of people also bullish on stocks and perhaps, commodities.
USD is extended on its spike within an intermediate downtrend, which itself is within a long-term bull market. Everybody hates bonds again, and that could be their salvation (for an interim rally, at least). That could signal disinflationary and bullish Goldilocks or it could signal deflationary and bearish liquidity crisis. We’ll just have to see how it all shakes out because I for one, am not going to be caught guessing (and thereby putting readers in danger of my ego’s bias). The long-term downtrend in yields (uptrend in bonds) has been broken, after all.
Hence, I am hedged, temporarily at least. Gains have been made and a little temperance into an incredibly dynamic week sounds right. In theory, at least. We, especially we Americans, are going to exist in a different world on Friday than we begin the week existing within.
Portfolio
Gold is long-term risk management & monetary value/stability in a balanced portfolio.
Taxable Account
In order of position size.
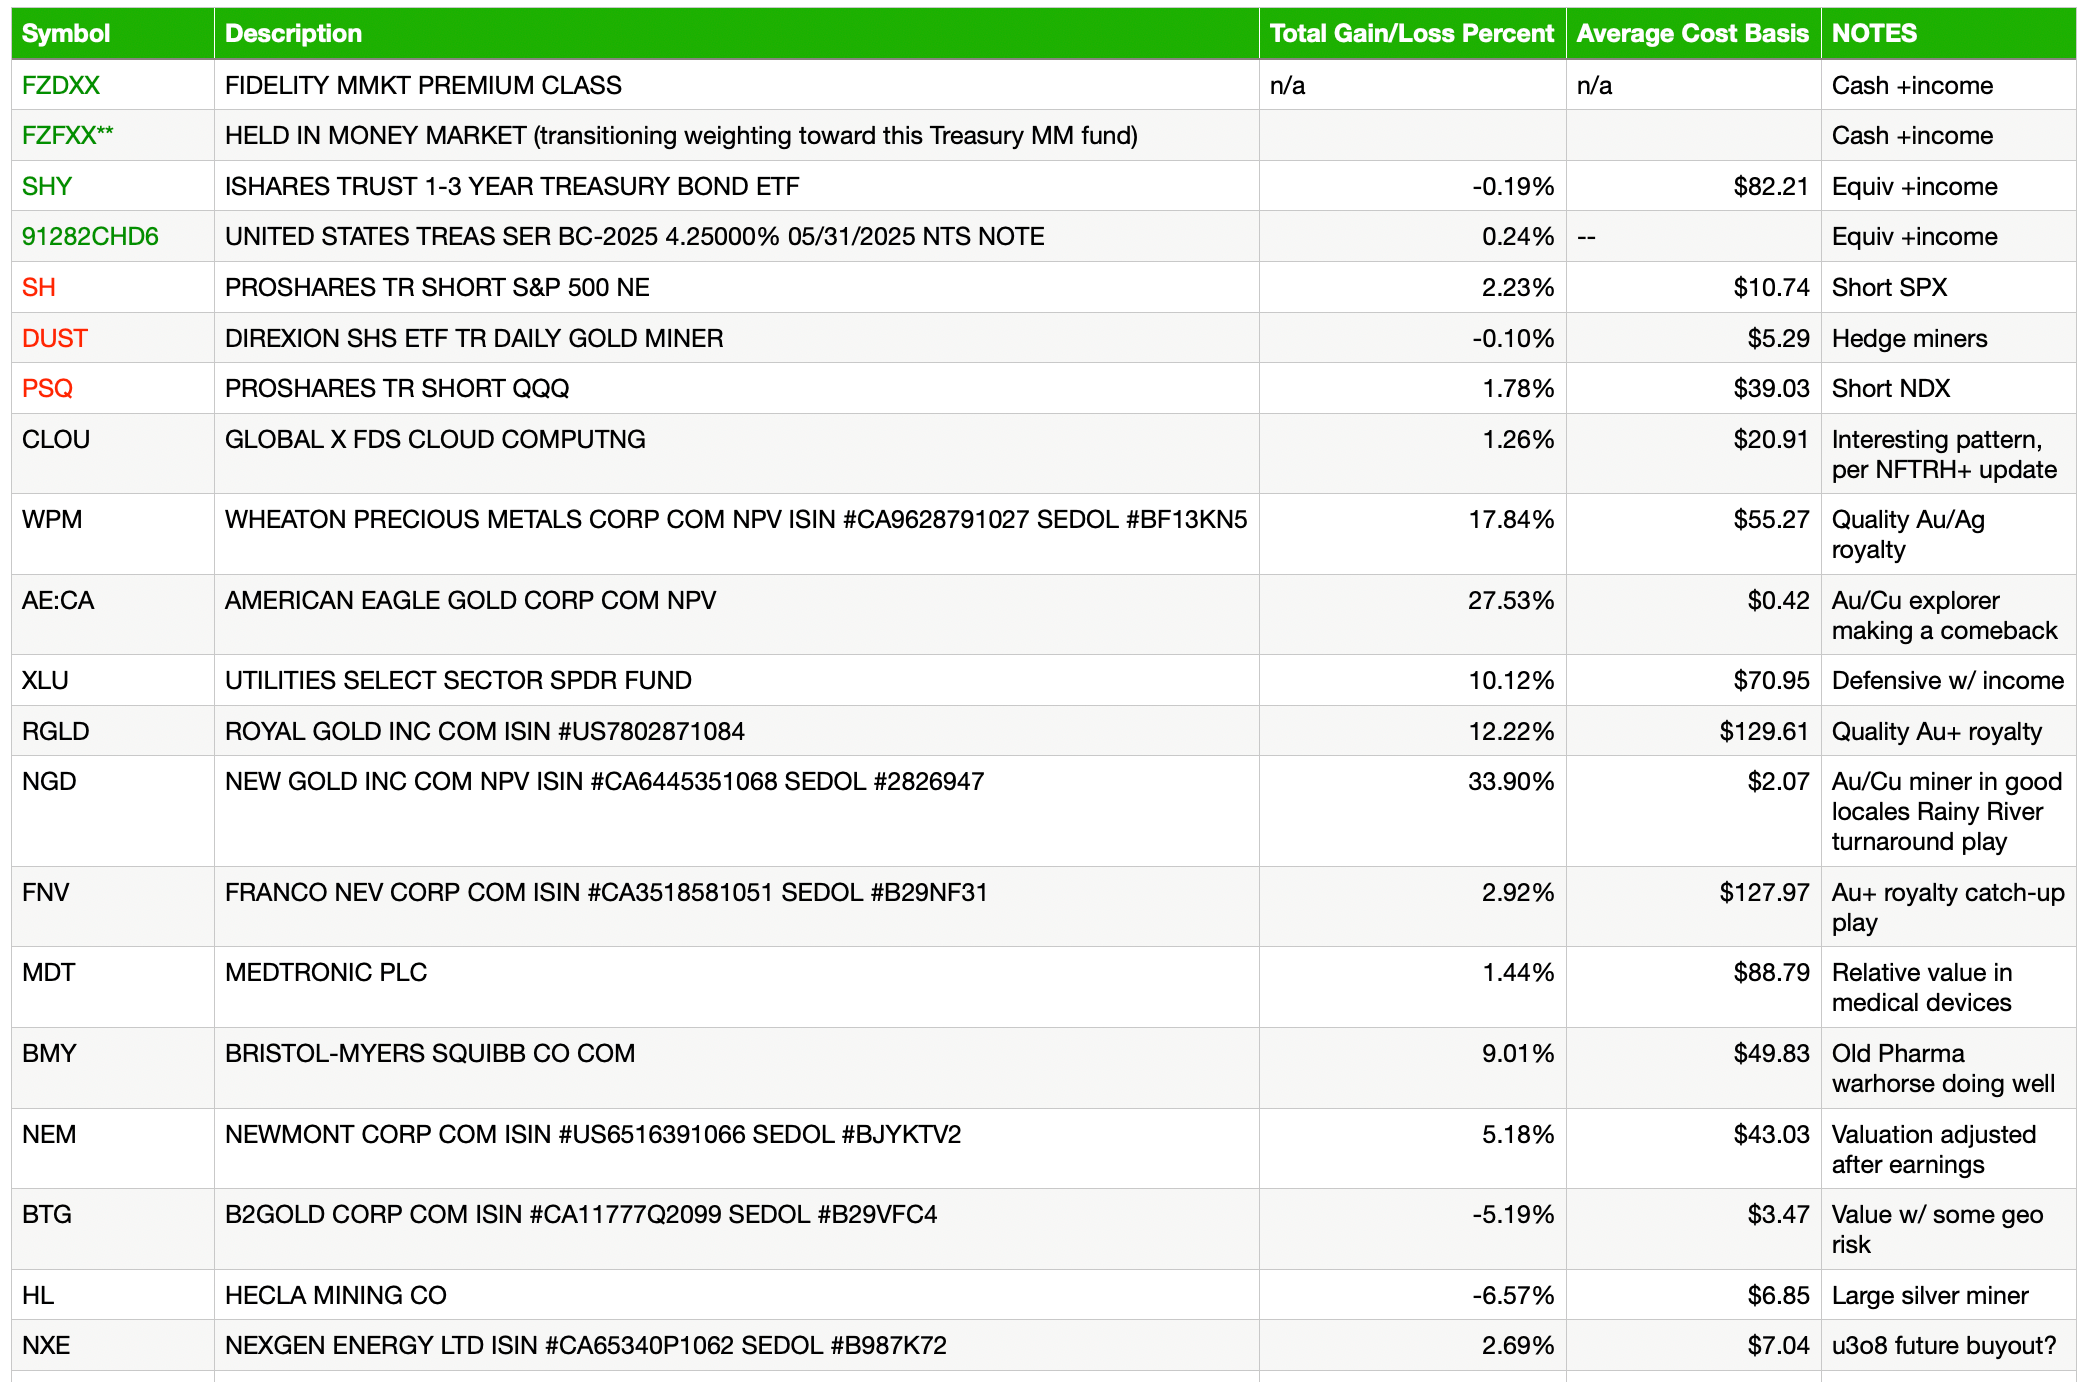
Locked down with a ton of cash and a few long positions offset by shorts.
Roth IRA (non-taxable, no contributions)
It looks like I’ve got a failed channel buster of my own going on here. There is no way I am going to willingly ride down to even the bottom of the uptrend channel. Hence, hedging until I get a read on how this week is going to shake out. Election on Tuesday + FOMC on Thursday = excitement (either negative or positive, but emotion nonetheless).

Cash/equiv. are at 78%, but that includes a decent amount of short/bear positions. So this portfolio is also in lockdown heading into what could be a crazy week. That craziness may resolve either way. So the only logical thing to do (in my case, at least) is to be in the middle and have patience.
I am not a gambler, after all. I forced myself to stop feeling impressed with myself and take profits on some big winners (e.g. LAC) last week. Also, as usual I will limit losses on speculations.
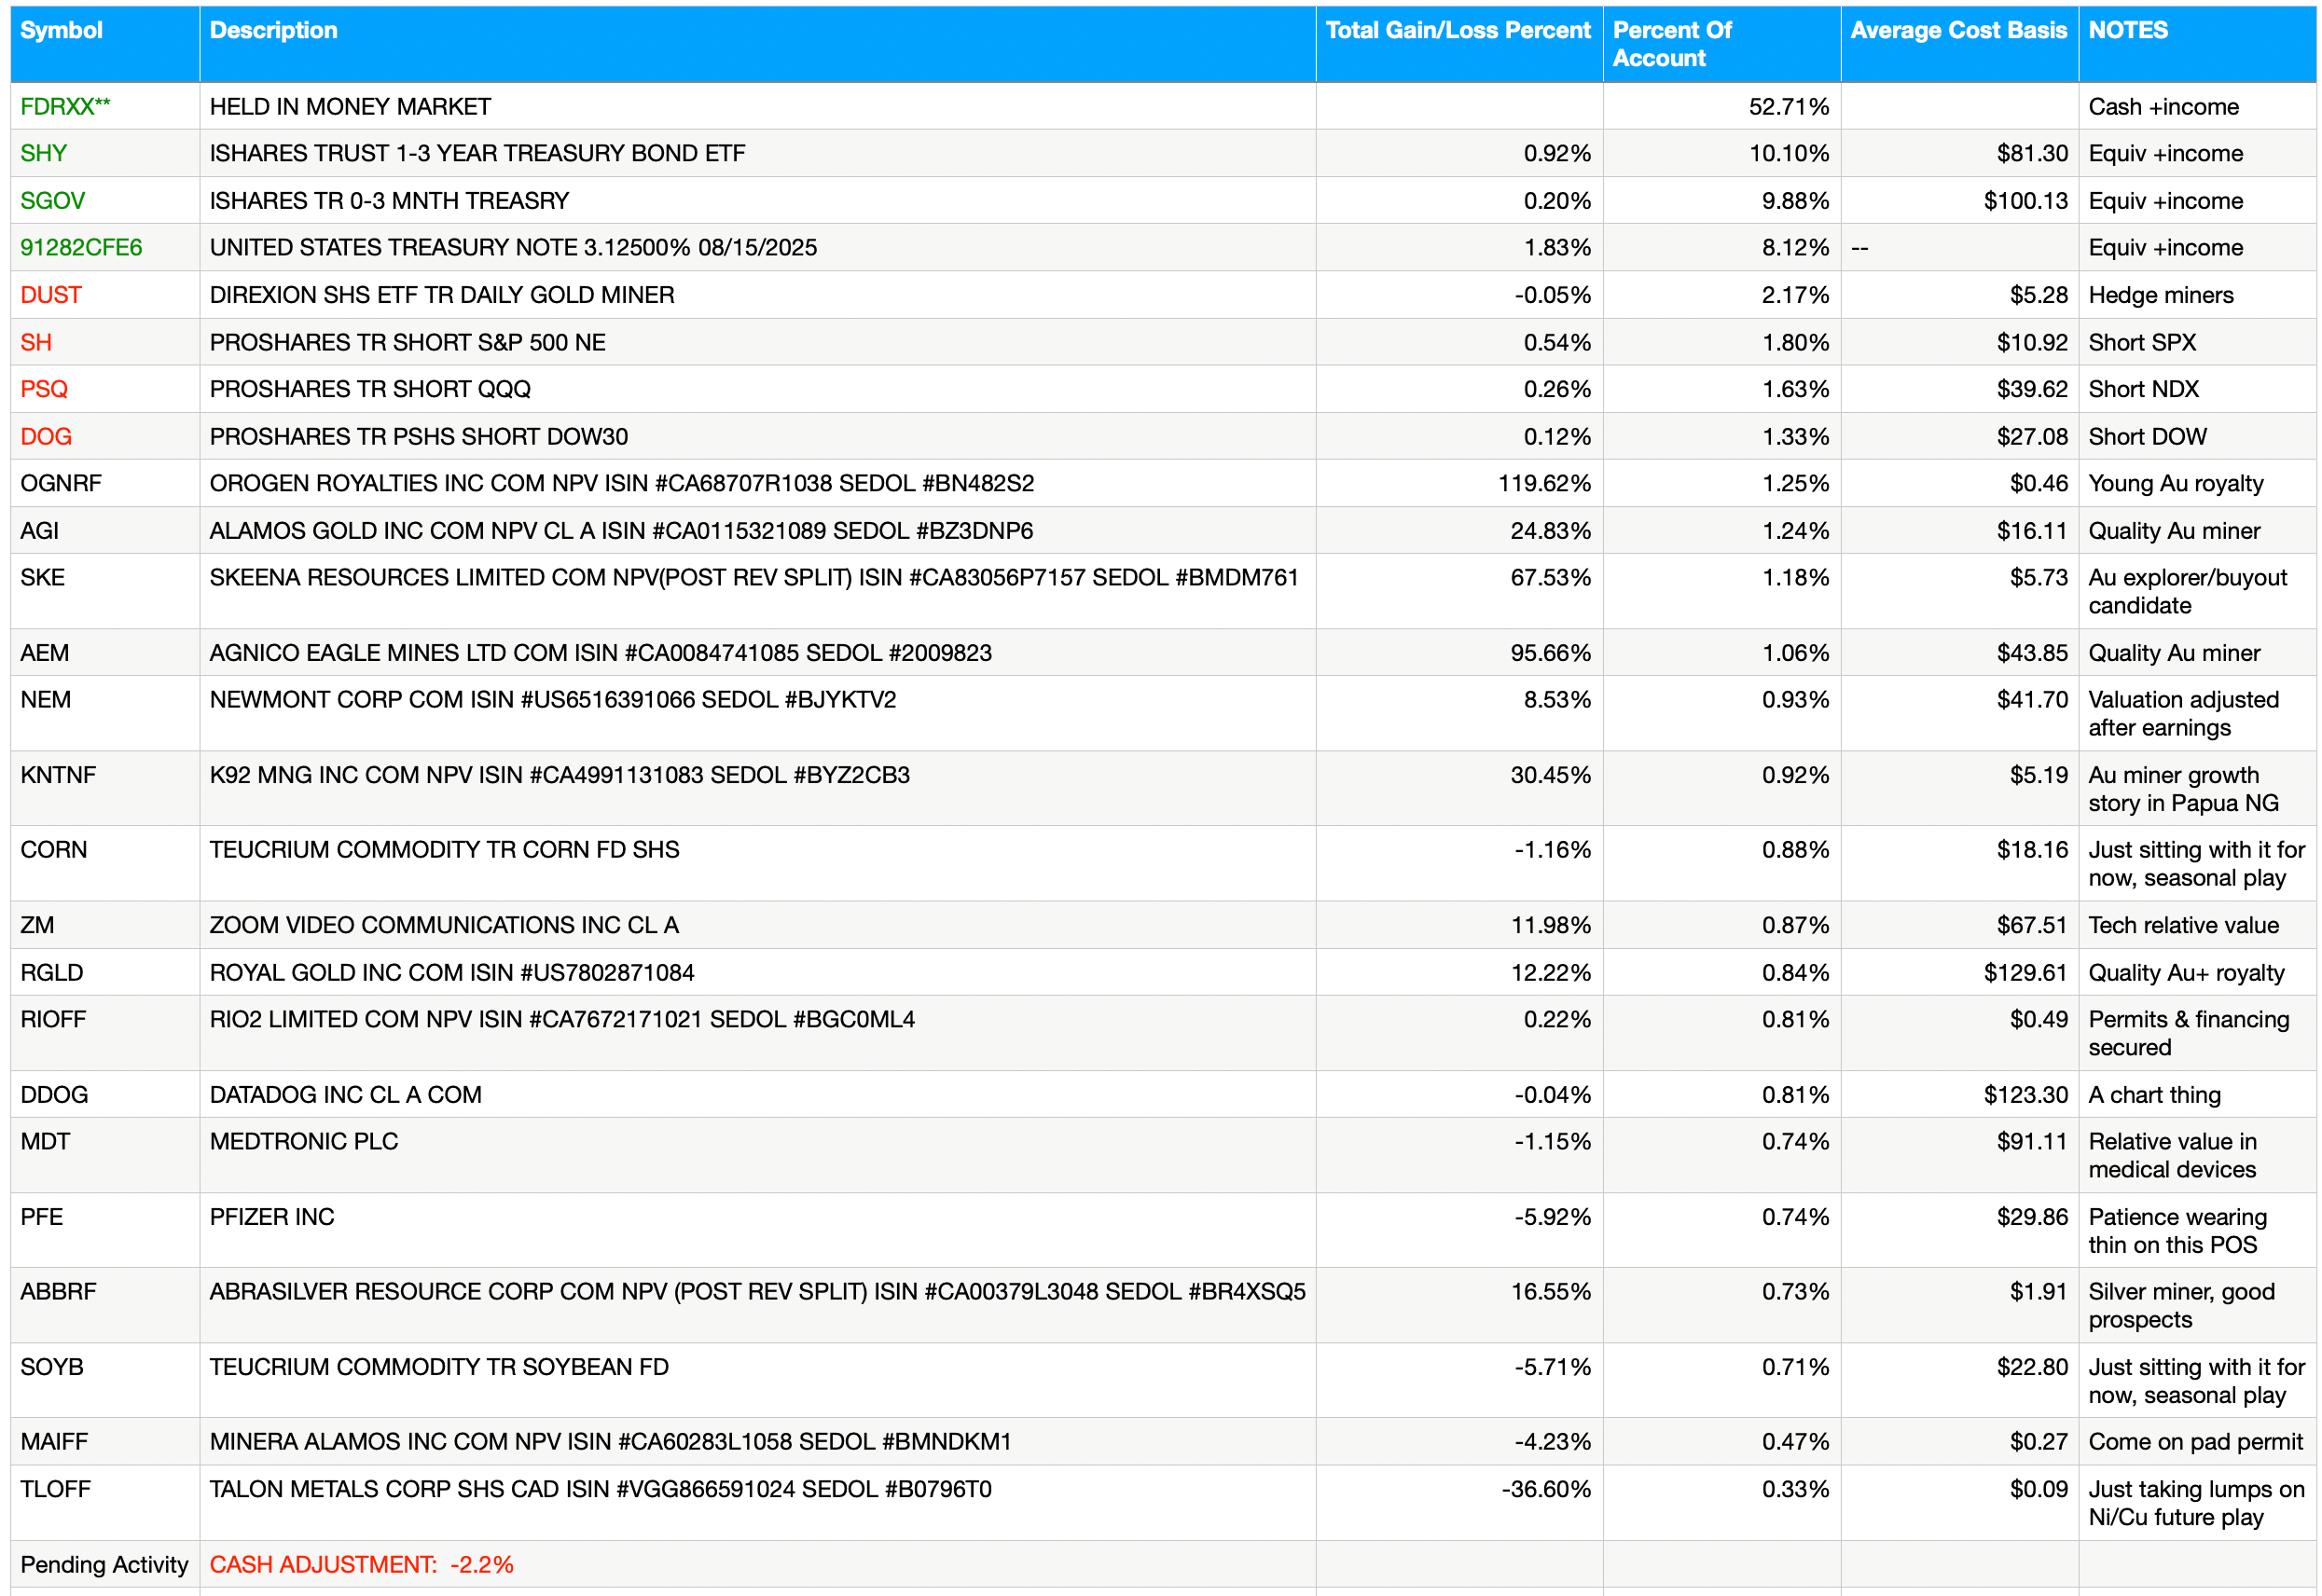
Cash & income-paying Equivalents are at levels that are right for me and my real-world situation. Your situation is different. Cash will be adjusted as needed.
Refer to the Trade Log under the NFTRH Premium menu at nftrh.com for trade info, if interested (not that you necessarily should be). Also, you can follow at Twitter @NFTRHgt for notice of updates.
NFTRH is not to be distributed to third parties without prior written consent
Notes From the Rabbit Hole (NFTRH) is a weekly market report in which we provide analysis on financial markets. We make every effort to provide accurate and high quality content, but this analysis ultimately represents our opinions and these opinions are provided without warranty or guarantee of any kind. See full terms & conditions of service under the ‘About’ heading in the main menu.
