
Summary
US Stock Market: Thus far normal technical pullback as new year profit taking kicks in. There is potential for significant additional pullback within a still technically bullish structure. Of note, Semi > Tech > SPX leadership got dinged but is intact. Similarly, warning ratios like XLV/SPY have bounced but are still trending down.
US Market Sentiment: Gross over-bullishness is being addressed by the market. Sentiment has pulled back to the “micro twitch” degree that could eventually spring a new rise. That would be less healthy or sustainable. More healthy might be a harder pullback to fill downside gaps and a harsher sentiment clean out.
Market Indicators: A mixed bag as the Yield Curve consolidates its new steepener while still inverted. Expect it to de-invert and cause some damage in 2024. Gold/Silver ratio has a bullish look which, in combo with a bullish USD would wreck most items in the macro. But as yet USD is only bouncing as projected, and GSR needs to be watched. VIX and High Yield spreads perked up a little with the market turbulence and each are high risk conditions for a market top. But that risk is not yet realized. The 2yr Treasury yield divergence to Fed proxy T-bill yield is an ongoing bearish signal that is also a condition for a top, but a poor timer as it is a big picture view.
Inflation/Deflation: This week we get off our laurels and realize that projecting a disinflationary 2023 was the right call but that oh yeah, it is now 2024. We introduce a view that could see increasing inflation signals in the interim to any deflationary event, which could push out to post-election. I just don’t trust the PTB to quietly stand by with a divisive (and IMO depressing in its two likely candidates) election upcoming. Regardless of what I don’t trust, the indicators will tell the story and with the 30yr Continuum’s yield having dropped to 4% it’s time to keep an eye on those indicators. Speaking of indicators, the currently bullish look of the Gold/Silver ratio is the main argument against this inflation trade thesis.
Global Stock Markets: Anti-USD on balance, hence mainly in uptrends as the USD takes what is thus far an oversold bounce, as anticipated. At such time as USD may do something more, caution on most stock markets would be advised.
Precious Metals: Have been rallying in lagging fashion and generally ‘anti-USD’ with most everything else as just another sector, not anything special (yet). The fundamentals that will matter for a real and sustained bull market are not yet convincingly in place. But on the bigger picture we see stock markets in a mature rally and gold stocks grinding out of the lows. In my opinion they are setting up for out-performance in 2024. But “it don’t come easy” and much patience is required. Successful gold bugs will tune out the noise, manage interim risk and be ready when the sector becomes unique.
Commodities: We have a very preliminary theme developing that could see an interim up tick in inflation signals. Considering how far bond yields have dropped, there could be room for an interim inflation trade featuring commodities and resources. This is a very preliminary view and is in part the product of your letter writer checking himself from becoming ‘perma’ in his disinflationary/deflationary view.
Currencies: USD is on a bounce. It will remain just a bounce below the daily SMA 200. Above it, things would start to get uncomfortable for the cyclical macro. Conversely, global currencies are pulling back within intermediate uptrends. Bitcoin is bullish and supportive of the speculative and cyclical macro.
US Stock Market; Sentiment Twitch
We have in past years noted times when an over-bullish stock market would take a little negative “micro-twitch” in order to reset sentiment on the very short-term. In other words, to take some of the froth off the top and sustain the market for another leg up within an ongoing broadly over-bullish and negative contrary structure.
The question today – after an unsurprising opening week of 2024 that cracked the markets right out of the gate – is whether this is a micro-twitch or the start of something bigger and badder? Dumb money is fading from an extreme and smart money is eating the market.
To my eye there is no effective way to tell if this was a top. It could be part of a top making process, which could still include new highs in stock prices. What we can say is that a condition was met for a meaningful top. But TA on market indexes will help manage the question more effectively as the situation unfolds.

First, let’s note the state of some other usual sentiment suspects.
- Investors Intelligence (Newsletters) had spiked to an extreme over-bullish Bull/Bear ratio of 3.32, above the summer extreme, on January 2. It’s not at all surprising this was met buy a market pullback.
- AAII (Ma & Pa) had already popped to an extreme above the summer high around 2.6 Bull/Bear ratio and as of January 4, let out a collective “Ruh Roh!” and recoiled to 2.07 with the market pullback now in progress.
- NAAIM (Investment Managers) had similarly started recoiling on January 3, dropping from a slightly leveraged over-bullish extreme at 103% (matching the July extreme) to 71%.
The bottom line on sentiment is that last week’s reaction was bound to happen as the market opened up the year to profit taking, keeping realized gains out of the tax man’s hands until next year. Now the rubber meets the road with respect to the nature of the pullback. My guess? It’s a pullback to refresh prior to a resumed and over-bullish rally. However, given the gross sentiment excesses that led to this point I’ll continue to manage with caution as risk/reward has been and still is poor and the next major move, in my opinion, will be to the downside.
US Stock Market; Technical
There is a scenario in play that may have seen SPX (bottom panel) make a literal double top and the leaders, SOX and NDX, make ‘bull trap’ overthrow double tops. Note that the DJIA (not shown here) is still in blue sky as it receives a relative ‘value’ bid vs. the sexier indexes.

The SOX (SMH) > NDX (QQQ) > SPX (SPY) bull leadership chain (daily chart) got cracked but not broken last week. SMH/QQQ in particular looks like something I’d buy (I held on to SMCI and added AMAT).

Healthcare is a more defensive sector and it has bounced in relation to SPX/SPY on last week’s market disturbance. As you can see, the daily chart trend is still down for the ratio. If/when that changes we’ll have a bear market indication.

The long-term monthly chart provides perspective on this. It is clear that Healthcare outperforms the broad market during, but not necessarily into, bear markets. It’s not a good forward looking indicator, but it is a reactionary indicator. So if the daily view above were to break trend above its down-sloping SMA 200 we would have an abundance of caution.

Gold may be turning back upward vs. the median stock (of 1700 stocks). If so, it would be an ongoing negative divergence to the stock market as it too indicates a shift to a defensive mindset in the market’s broader areas.

Back to our excessively busy daily management chart of SPX we find an index, turning down from a double top as it is, with a paradoxical combination of a pure uptrend, many layers of support, and yet also gaps galore to the downside and RSI and MACD turning down from overbought levels.
SPX sure does look like it wants to tap the area where support meets the uptrending SMA 50, at least. A harsher correction would fill gap #1 and test the uptrending SMA 200. As for the bear market technical caution marker, I’ve raised it to the October low of 4103.78 from the March low of 3808.86. Traders may wish to speculate on a continued pullback, but NFTRH is more concerned with the ending phases of the current bull and the next bear market than calling day trades (although we may have some of that in NFTRH+ updates).

Bottom Line
A high risk market is realizing some of that risk in the new year. Completely logical and expected with the US dollar’s bounce. I think there is more short-term downside potential but it is within the structure of an uptrending market. Hence, a committed and active bearish orientation is not yet indicated. One may want to trade nimbly bearish and/or bullish in this situation.
More Indicators
The Gold/Silver ratio is poised bullish and should be a warning to broad markets, including potentially the precious metals. As it stands now it is in support of the USD and its ongoing bounce. But as long as neither the GSR nor USD get impulsive to the upside the markets could simply continue to correct until such time as the 2 Horsemen of the Liquidity Apocalypse (USD & GSR) settle down again.

The VIX shows extreme complacency and much like the sentiment indicators noted above, is a condition that is in place for a market top, should that be what is in play.

High Yield spreads are also indicating a currently calm backdrop as there is no rush out of junk bonds (and their high yield income) in favor of quality bonds. It is no coincidence that the VIX and the HY spread look very similar. Last week could have been the start of something bearish, but there is no proof of that in these charts.

The 10yr-2yr Yield Curve implies risk of an oncoming economic bust, which is what a steepening would typically imply. The 2020 steepening implied inflation and an oncoming inflationary economic recovery. In this election year government and the Fed could try another inflationary operation, which would probably benefit only select assets/markets. But if it is a deflationary steepening it would not benefit much of anything other than an eventual positive “post-bubble” macro view for the gold mining industry.

Checking in on the 30yr Treasury bond yield Continuum we find that it has corrected hard, as anticipated, right to a clear implied support area (30yr T bond bounce at resistance). Thus far the pullback has been attended by Goldilocks/Fed relief/soft landing sentiment. January has not surprisingly seen the markets pull back while yields held 4% and elevated to 4.2%.
A continued bounce in yields, if it happens, could see markets go bearish, could see continued rotation to favor ‘value’ and defensive positioning, or heck, it could unleash an inflation trade. But if the yield loses 4% out ahead with a weakening economy and increasingly dovish Fed, the deflationary pressure could ratchet up. That would come in tandem with a steepening yield curve per the above (curve can steepen deflationary, inflationary or a combination of both).

Could government spending (and increased government employment), embedded healthcare services and the still leisure seeking American consumer serve to stoke inflation fears back up for a while? They could, and that would likely see a continued bounce in yields. But as yet, the 10yr Breakeven Inflation Rate is still depressed.

Yet still I cannot help but think about how in 2021, 2022 and 2023 everybody KNEW that inflation was the clear and present danger and now everybody KNOWS that inflation is all done, Goldilocks is here and a soft economic landing awaits. Here, especially in an election year, might not government have some fiscally inflating tricks up its sleeve? Might we – who were well ahead of the disinflation phase – also look ahead to the next inflation phase, even if it is only interim to eventual deflation?
The Gold/Silver ratio and other indicators are not yet implying that outcome, but that is why we watch the indicators week to week. Things change, especially in remotely managed gerrymandered markets like we have in the modern era of aggressively intrusive central banking and political stimulation/interference.
Let’s leave the segment with the biggest picture view we have been staying aware of. The implication is deflationary but in our bizzaro investing world, we might want to keep in mind that the process could grind on, include an inflationary squall as implied possible above, and then liquidate later, maybe after the presidential election. Just spit ballin’ here, churning ideas and possibilities. Please take it all with a grain of salt (and call me on anything that seems outlandish).

Currencies
I never get tired of this chart because it is so reliably guiding us as to USD’s inverse relationship with US and global stock markets. USD popped, stocks dropped. Period.

USD popped to our preferred bounce objective at 102.50, made an attempt at the next objective at the moving average convergence at 103.40, recoiled and closed back below 102.50. All of this on Friday’s December Payrolls noise fest.
USD has bounced enough to relieve the oversold condition that put us on alert for the bounce to begin with. But that long wicked candle implies indecision on Friday and that, I suppose, is what Uncle Buck will do; make a decision about whether 102.50 was a good target or whether a test of the 103.40 target is in the offing. Personally, I don’t want to guess. I want to remain vigilant with risk management.

Meanwhile, Bitcoin continues to trounce gold and this implies risk is still ‘on’ in the wider macro. The centuries old dumb monetary anchor dug out of the ground in barbaric fashion by inefficient companies that carve up the land shows no sign yet of rising vs. the speculative money alternative that exists inside computer server networks, the product of a complex system of hardware, code and bits and bytes. The key here is that the implication is still macro risk ‘on’ by this measure.

Nominal BTCUSD is actually overbought by weekly charts after the strong move to take out our original upside target in the 30000-32000 range. But the daily chart has reset RSI and MACD very nicely as they are coiled and in a posture to support new upside as the price consolidates in a volatile way above the SMA 50.

We have not reviewed global currencies in a while, so here is the daily chart. As you can see intermediate uptrends began in October and November and despite the pullback with USD’s bounce, those trends remain intact.

Global Stock Markets (daily charts)
Please take due note that local currencies play a role in market performance for global citizens. NFTRH being American, cannot get too far afield managing all those moving parts with my simple charts. So global market comments and charts are for reference.
The world (ex-US) is similar to US indexes as it turns down from a marginal high for the cycle, possibly prepping for a test of the daily SMA 50 and/or SMA 200. Europe: similar.
UK, Canada and Australia are varying degrees of a similar situation.

Japanese Nikkei continues to look buyable from a daily chart point of view. Our long-term base breakout target has been 35000, but in reviewing a long-term monthly chart Nikkei now appears to have its eyes set on challenging the all-time high of 38915 set back in 1990. Interesting.
Hong Kong (and the China large caps, FXI, that trade in its wake) is still purely trending down. Maybe 2024 will change that, but as yet there is no hint of it. India, along with Japan, is still leading the global picture in a strong bull market.
EM and Asia (ex-US, AAXJ), which share some common holdings and trade similar, are stronger than China and attempting trend changes.
The small Canadian resources trades are still alive for the seasonal (post-tax loss) play as the TSX-V is thus far still in a stair step uptrend from November. This could be a beneficiary of the potential interim inflation trade scenario discussed earlier.

Brazil is consolidating within a bullish trend, Argy remains bullish and may be returning to its old, overbought ways after some volatility and a maintained uptrend. Mexico does not seem to do anything gently. It corrected hard, rallied hard and is now knocked down a few pegs. The trend is up from November.
Africa ETF is posturing to break its robo-downtrend and Frontier ETF appears to have already broken its downtrend. It’s in a bullish pattern and is above both of its key moving averages (SMA 200 not shown). Frankly, I am interested (in FM, EM and select parts of Asia) for a little global diversity, pending USD remaining ‘bounce only’.

Precious Metals
Let’s start out with a simple picture of gold. The line chart strips away the noise and indicates that gold made a new all-time weekly closing high. It’s not the be all, end all. But it is technically bullish.

Gold is still floundering vs. stock markets and thus the miners are not yet unique. It is still worth considering, however, the effects on the industry of the rising in the Gold/Oil ratio that will be factored in quarterly results soon to be reported. Gold/Commodities, including Copper implies that cyclical inflation issues have disipated, and that has been logical with Goldilocks and gold’s under-performance to many stock markets.
If gold rolls over vs. silver and turns down vs. commodities the inflation trade speculated above would be on. However, that is not happening. Not yet. So, steady as she goes pending incoming info.

Gold vs. the Inflation Expectations gauge is pulling back and so too in dutiful fashion, is the HUI Gold Bugs index. All normal here and in line with the gold mining sector’s best big picture fundamentals, which would be deflationary. As a side note, it would beg the question about how the miners would do if an inflation trade – as speculated above – were to manifest. But first things first, that is not happening at this time.

Other sector considerations:
- The Commitments of Traders (CoT) situation for gold and silver is still stretched, although not necessarily terminally so. However, it sure is not screaming contrary bullish in any way.
- Gold Miners Bullish % (BPGDM) is moderately overbought but not near an extreme. Thus more upside for the the gold mining sector is implied in the near-term.
- Gold is still in pullback mode vs. global currencies, but generally maintains a longer-term uptrend.
- HUI/Gold ratio is in pullback mode but not broken from its structure of having bottomed.
- As noted recently, the seasonal averages are now up for the precious metals complex, especially for silver. As also noted, any given year can deviate from the norm. However, the seasonal combined with the likes of the Gold/Oil ratio above keep me in the game as long as the gold stock sector’s technicals stay in the game.
On that note, let’s take a look at the simplified chart of GDX that we used to originally imagine a bottoming pattern before seeing it actually play out back on November 13 at the price bottom. The pattern became activated, dropped to test the SMA 50, doinked a new high and is now testing the SMA 50 again. Very orderly, I’ll give it that.
The issue with this inherently volatile sector is that it often does not do the normal technical thing. It often does the abnormal, limit-testing thing. However, if it is going to stay normal it will hold last week’s lows at best and hold the December low at worst, per the video update on January 3. If it stays normal the next target is 33-34 with an eventual and potential upside to 40+. But first things first; normalcy is needed this week.

HUI’s bigger picture monthly chart is unchanged since last reviewed. The bounce came to a resistance area that is still being dealt with. Our game plan, assuming that the gold stock rally resumes in line with the seasonal and still intact daily technicals, is for a rally as high as the top of the downtrend channel. That would be a solid trade. Depending on what the macro would look like at such time we’d either have to call ‘sell’ or perhaps something less severe if the sector’s fundamentals have engaged by then.
The next major target for the bull market is 500. But again, first things first, eh?

With reference to the TSX-V chart in the global segment above and the post-tax loss seasonal play it would run with, I would like to pop in a weekly chart of MAIFF (MAI.V) as an example of something constructive to look for.
MAI, a position I increased last week and may increase again, held long-term support and has now spent 6 weeks above long-term support nesting upon the EMA 10 and EMA 30, which are about to cross upward in what many TAs would call a buy signal. RSI and MACD look nice and so does relative volume.
The reason MAI became a non-priority item for me is that it is awaiting a permit to expand its operation. I am going to come right out and admit that I generally cannot stand politicians and hate it when they infect my investing. Rio2 was impaired for 1.5 years at the hands of politicians. The MAI situation is nothing so drastic, but the point is the same. I don’t like politicians in my pockets. That said, if/when approved the stock may tear ass and not look back. For now, I am playing it as a seasonal tax loss spec, but that could well change.

Gold’s daily chart shows more noise than the calm weekly that opened the segment. But it is trending up and while I’d like to see better contrarian signals coming from the CoT, the situation is still bullish despite the volatility.

The log scale monthly chart offers no reason not to think that this consolidation will eventually lead to a breakout to blue sky. The question is whether or not another tap of the lower trend channel line would be in the offing. If so, gold’s potential downside has risen nicely, to the 1900 area. Not bad.

Silver (daily) barely avoided making a lower low to the November low of 22.78. To keep it comfortable it should continue to hold that low. Meanwhile, silver bugs absolutely do not want to see the November low of 21.92 violated.

Silver weekly checks in to taunt us with its Siren’s song about an inverted H&S and a pattern target of 35. That possibility – if the seasonal plays out – is not off the table. But nor is it active. So… it’s merely for reference.

Silver monthly reminds us that it don’t come easy and it won’t come easy, if it comes at all. I am no silver bull by nature, but I am someone who can see a chart above clear long-term support that has made several attempts to break upward. Silver has not broken out but also has not broken down.

Meanwhile, the silver seasonal does this on average. So it definitely has my attention.

Bottom Line
Seasonal positive. Fundamentals mixed (with a possible boost to sector fundamentals by the Gold/Oil ratio during Q4) . Technicals intact. Sentiment is middle ground, at best. We’ll use technical support to either maintain the bullish view or negate it. Right now it is maintained.
Commodities
It is quite possible that crude oil has just made a low in relation to gold. That would be all the more reason to eventually call gold stocks a ‘sell’ if they get a strong rally off of Q4’s rise in Gold/Oil (decline in this chart). The ratio is postured at a potential ‘W’ bottom in the making. Add to that the reasons for bullish potential (long-term support, seasonal and sentiment) noted in the December 6 NFTRH+ update and it seems all the more realistic.

Last week I added XLE to my oil holding, USO. It broke bullish above the moving averages, got hammered on Thursday and held up. With RSI and MACD positive and the trend biased upward I think it is worth a shot for possible rotation into the sector.

Meanwhile, oil had been driving the CRB index downward out of its bearish pattern. Now both are bouncing, but even oil is below clear resistance. So, much work to do. Gas is rallying but still suspect. On the plus side, the recent lows once again tested long-term support going all the way back to the 1990s.
Copper and industrial metals have been correcting but can still put on a seasonal rally, if it flips toward the inflation trades (watch the Gold/Silver ratio among other things). The Ags are simply bearish with individual components doing individual and not always bearish things. Little interest now that I’ve released the Corn fund.

Palladium continues to be worth keeping an eye on. I took a good initial trade on it, took the profit, missed the big spike upward, bought back too soon on the drop to the SMA 50, sold again and now await a fill of the lower gap. A reminder that the December low came as the metal had finally dropped to long-awaited long-term support per this NFTRH+ update on November 10.

Meanwhile, I am now out of the Uranium sector taking remaining URNM profit as a couple of components weakened. Is UUUU simply testing support with its significant decline? Could be. DNN in a normal consolidation? Could be. CCJ due to get back above the SMA 50? Maybe. But I decided I did not like the implications of the downtrending URNM/SRUUF chart we reviewed last week. The sector is still bull trending, but profits in 2023 were good and maybe it’s time to look elsewhere for a spell.

Like in the patch of beat downs we’ve been tracking. All of these items took seasonal bounces to varying degrees before pulling back lately. LTHM merged with ALTM, which is the new symbol.

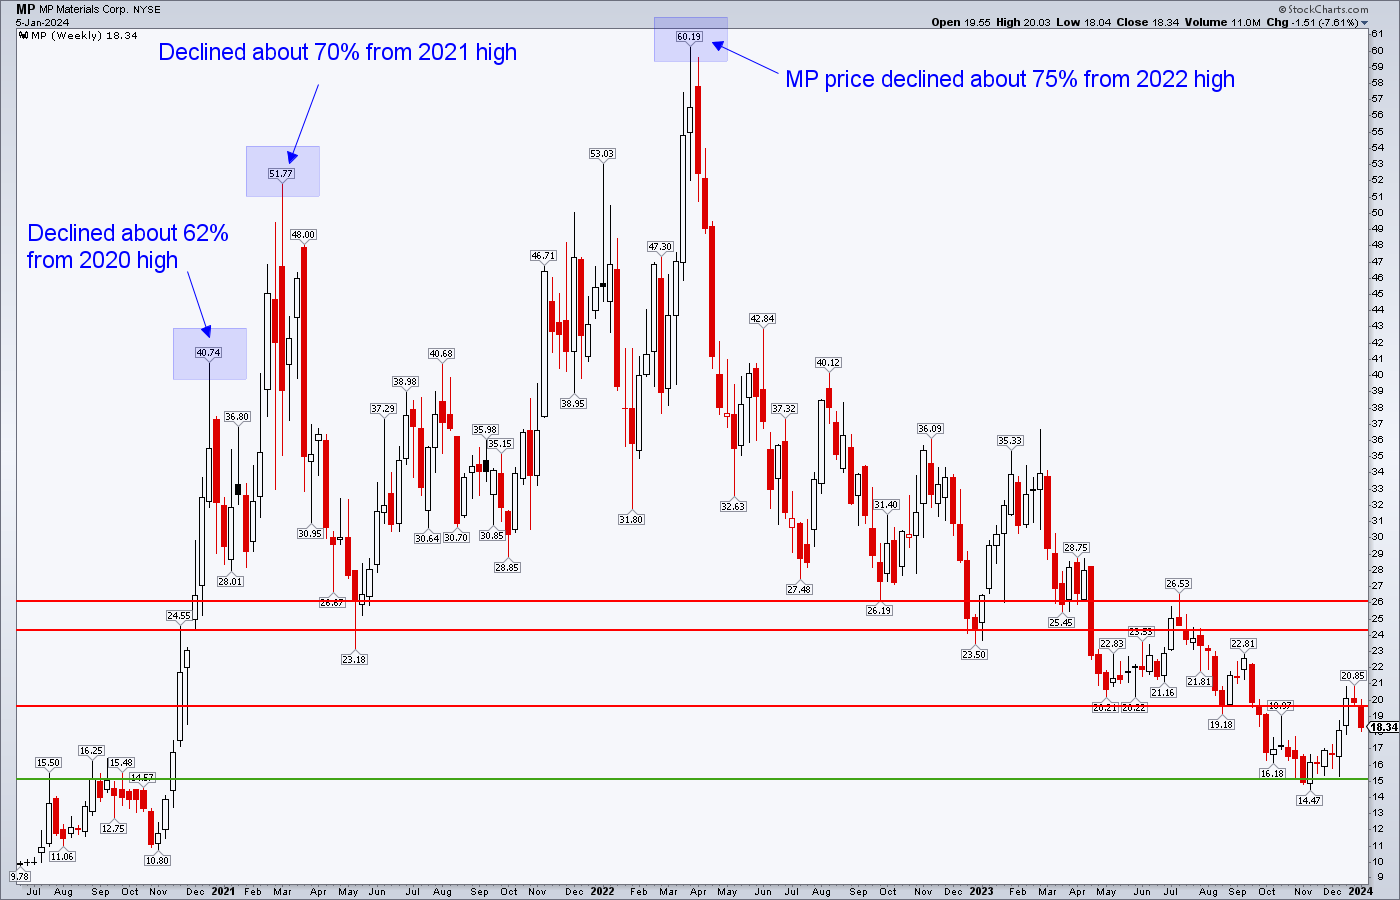
With respect to the chart above, US REE producer MP continues to be my stock of choice. It was sold on the rally and is very much on watch for buy back. Ref. NFTRH 786 for details about why the price decline in MP seems overdone in relation to individual Rare Earth Elements. In summary, most RE materials dropped in 2023 but have significantly increased in price since 2020 while MP declined heavily from 2020. It was identified and traded as an opportunity and it still appears to be just that. It is a priority watch list item.
Portfolios
I have eliminated the “savings balanced by gold” and “trading account” headings for 2024, since they never seem to do anything. Savings is savings and gold is a lump of long-term value. Maybe I’ll include words here about it on occasion.
As for trading, I am going to reserve that small account for myself to either do nothing with as usual or perhaps even take great gambles (like my fantasy of buying ‘crash put’ options against the S&P 500 at the exact right time. Ha ha ha… but still. I don’t want the trading account acting like it is some helpful component of NFTRH because it is not. Trading is gambling in my opinion. NFTRH is actual research and market intelligence.
Roth IRA (non-taxable, no contributions)
Cash is 79% and the favored sectors continue to be Gold Mining, Semi, BioPharma, Energy and potential interest in ‘value’ stocks in general.
If the speculation about potential interim inflation trades noted in the report above comes into view I’d expect to increase commodity/resource related holdings. The thing is, we absolutely nailed the disinflation of 2023. But I don’t want to be sitting around feeling satisfied by that if another contrary play starts to brew going the other way; even in the interim. Right now it is one part gut and one part a hazy few signals I see. Arguing against it would be if the Gold/Silver ratio follows its currently bullish look and moves upward even more.
Week to week, baby.

Cash & income-paying Equivalents are at levels that are right for me and my real-world situation. Your situation is different. Cash will be adjusted as needed.
Refer to the Trade Log under the NFTRH Premium menu at nftrh.com for trade info, if interested (not that you necessarily should be). Also, you can follow at Twitter @NFTRHgt for notice of updates.
NFTRH is not to be distributed to third parties without prior written consent
Notes From the Rabbit Hole (NFTRH) is a weekly market report in which we provide analysis on financial markets. We make every effort to provide accurate and high quality content, but this analysis ultimately represents our opinions and these opinions are provided without warranty or guarantee of any kind. See full terms & conditions of service under the ‘About’ heading in the main menu.