
Summary
US Stock Market (per last week): Seasonal remains positive. Trends are up. Gaps are below. Given the sentiment note below, risk to this rally – or at least the risk of an interim pullback – has increased markedly. In other words, even if the seasonal rally is to continue (favored), a better opportunity (than at current levels) to buy it could be ahead. NEW: Or the darn thing could just accelerate into termination with the “soft landing” tout gaining more airplay.
US Market Sentiment: Over-bullish sentiment is becoming dangerously over-bullish sentiment.
Indicators: Some degrading, like the steepening (but still inverted) yield curve. Some still asleep (though high risk), like junk bond spreads. Some flashing future danger like the 2 year yield divergence to the t-bill yield. M2 is still bloated but rolling over (future danger). Gold/Silver ratio and USD have flopped (positive for now). Real yields dropping from October high, implies softening policy and S/T positive as long as Goldilocks holds sway. VIX has been hammered, complacency abounds. It’s positive now, very much not so later. All in all, indicator land is what it has been for much of the year, flashing forward warnings aplenty but still stable in the here and now.
Fiscal Inflation View (as per recent weeks): In my view, this comes later. Perhaps at the trigger of a deflation scare.
Global Stock Markets: Global is quite biased to short-term positive side with the seasonal party and with the weak USD in its sails. Individual markets will do individual things for discrete reasons, but generally it’s anti-USD and bullish.
Precious Metals: A little too much “gold breakout!” noise for my liking on X. But bullish is bullish and gold is once again attempting to take out blue sky resistance. Not bad. The seasonal is generally positive for gold and silver until February, pending a little near-term chop and grind. The miners have risen in relation to gold in the short-term and if that continues the rally continues. Regardless, I do believe the macro is slowly shifting in favor of the counter-cyclical sector. See segment just below for much more detail.
Commodities: CRB and oil are lame and beckoning for daddy OPEC+ to come to the rescue. Copper is making a move to join the seasonal party, the Ags may be basing for a bounce. Uraniums are still trending up their 50 day averages and it is time to evaluate seasonal tax loss candidates, which we do in the segment.
Currencies: USD flipped bearish as the bull trap played out. It tested the breakdown, failed again, dropped below the daily SMA 200 and bounced to test that breakdown. USD is short-term bearish until proven otherwise by taking out said SMA 200. As for other currencies, my main interest in them is that gold is trending up vs. the whole lot of them. Bitcoin is once a spec, always a spec in my book. It is an anti-USD spec that ticked a new recovery high on Friday.
Note: This report starts out atypically and continues that way. It’s one that will flow where it takes me rather than me feeling like I have to include form segments.
On the HUI Target of 500
A subscriber requests further info about why my target for HUI is only 500 (per monthly charts as often noted over the last few years, most recently in Thursday’s public article), given the fundamental correlation to the 2001-2003 period when HUI rose approximately 600%. Allow me to clarify. A target of 500 would double the price from the current level, but it is not necessarily an ultimate target. It’s just a target at clear resistance with significant (100%) upside from today’s level.
The 2001 bull market began from an index price (and bear market low) of 35.31. The 2016 low, which I believe already started a current bull market, began from a bear market low of 99.19. So Huey has theoretically already traveled the first 150% of the bull market to today’s level. Of course, much of that was cobbled against poor fundamentals (unlike 2001-2003), which is why the volatility of this bull has thus far been epic (and painful to a perma-bull orientation).
For all I know, it could put on 600% in this bull market from the time the fundamentals shift. But to get to the point of the 2001-2003 fundamental backdrop a critical mass of market participants will need to be acknowledging a sharp economic deceleration, not this seasonal party animal crap touting a “soft landing” (a form of Goldilocks).
600% from the 2016 low of 99.19 is 693. That would also be a great trade and would tick a new all-time high above the 2011 high. But first things first. While daily charts are starting to get overbought, they are bullish and activated (see GDX below). Monthly HUI shows the index at a resistance area. But I think there are much better than even odds that Huey is going to at least ding the upper line of the downtrend channel (300 +/-) before this trade ends. Beyond that, bullish objectives for 2024 are the old high at 373, which should get taken out if the channel is broken, and then resistance at 500.

That is what I see on the chart and so that is what I report. I also do macro fundamental work that looks to flip positive in 2024 and pending any pressure on the miners if the broads go into a bear market, that would be the time to start looking upward at some jaw dropping targets. But right now, I want us to be grounded. 500 it is… but before that 373 and the channel at 300 (+/-) it is.
Now recall that our target for GDX on this rally leg is 40+ and a gap fill. That would be just below the April, 2022 high. With reference to HUI above, that falls in the 320+ area. However, the 40+ target is simply due to a daily chart gap up there. It’s a reasonable target. But the implication for HUI is a test of the channel’s upper bound. So let’s call the target 300 to 320, the upper end of which could easily be dinged before HUI would hypothetically reverse back into the channel.
Note the word “hypothetical”, because that is all I am doing; hypothesizing and enjoying the work all the while. As for refining the analysis, much will depend on the macro actually shifting within the preferred view, which is and for a year now has been disinflationary Goldilocks followed by deflationary liquidity problems. I am finally able to be bullish the sector – with a patient forward orientation – for possibly more entrenched fundamental reasons after decades of the fundamentals being routinely foiled by our heroes in (inflationary) central banking.
Here is the daily chart of GDX showing a short-term overbought situation developing and clear resistance overhead at 33.37. Above that is the target, the gap above 40. As a side note, it is recommended that you know who you are as a trader/investor. If you are a trader you have good profits and should consider taking money off the table around 33. Personally, I am going to see how things play out and evaluate. With the break above the SMA 200, I have a pretty good level of confidence in the 40+ gap target. Finally, and as to the resistance at 33+, note that the Inverted H&S pattern target (now that it’s been activated) is around 34. Nice confluence!

But speaking of the 2001-2003 phase, that, a 600% move, is the kind of thing that can leave you on the sideline if you don’t know and accept that you are a pure trader willing to miss parts of an extended bull run. I am not that guy. I am the guy managing the macro and envisioning a potential career maker (okay Gary, calm down). If we have a sector that has been downtrodden for so long against a bubble in inflated, cyclical markets why not sit back and let the market do the work? While, I will probably trade something here or there, if the view of a fundamentally positive post-bubble backdrop is a good one, I want to sit back and let the miners accumulate profits (hello HUI 500).
Meanwhile, back on the short-term, when I first drew the arrow on this chart it was fantasy. Then the right side shoulder formed perfectly with the projection and it became plausible. As the chart originally noted “activation would be above the SMA 200”. Well, it’s activated. This breakout triggers the upside targets, regardless of any volatility to come, as long as it holds the SMA 200. That’s not me talking. It is TA talking. There are gaps to be concerned about below the SMA 200 but an option for 2024 is for a perhaps gut wrenching decline along with broad markets. That could be the final buy before an extended bull market.
For now, the sector is doing as projected and as long as it does we’ll view the upside targets (up to 40+) as next in line prior to weighing potentials for a 2024 correction.

Let’s check in on some of the sector’s internal indications.
HUI/Gold ratio is still rising from the November low, which we’d speculated was a double bottom. Positive progress for gold mining.

Gold/RINF ratio is our rough map of gold’s progress against the almalgam of inflationary inputs manufactured by the Fed and government. It looks impulsive to the upside, which also means that the inflation play is on its last legs and could be an early indicator of Goldilocks’ future turn toward deflation. Quite positive for gold mining.

BPGDM (Bullish Percent index) is chugging northward toward a coming overbought reading. But it took a long time for a bull phase to manifest from the extreme low ‘buy’ reading. So let’s not overreact when BPGDM reaches the two previous highs. It’s just an overbought indicator, not a bearish one. The monthly EMA 20 has (barely) held the stance of an ongoing bull trend at a higher low, and if the current rally is what I think it is, it will turn up here. Think of that slow mover as a backbone of a new bull market phase. The index itself is spiky and volatile. The EMA 20 smooths that out.

Commitments of Traders shows that as of Nov. 28 sure, large speculators were eating the metal and commercial traders were increasing net shorts. As you can see, there was still a way to go before the situation can be called high risk. Of course the end of week action probably pushed the blue line higher and the black line lower.

A word on the CoT. I’d advise tuning out the stuff you’ll hear out there about how the “smart money” commercial trades (black line) are laying in wait to fleece naive gold bugs while the large specs and especially small specs are dumb money.
In my opinion, this garbage is concocted by those who also want to sell you on ghost stories about evil cabals of bankers laying in wait to rob you, poor dear gold bug, of your rightful riches in the monetary metal. The Commercials include banks, bullion dealers and gold miners. In essence, it is their job to hedge. Is there grift, even criminality in the mix? Who knows? Probably. But the point is that the Specs are going to be right for long stretches of time as they ride with the trend and the Commercials are going to suddenly appear right all at once when the price tanks from an extreme CoT alignment.
So the point is, hedgers hedge. Speculators speculate. CoT is almost always going to see rising spec longs during extended rallies and increasing commercial shorts as well. That is the nature of CoT. Turning points come when the gold price turns. Voila, suddenly the evil “smart money” gets smart and fleeces the poor gold bug whose preordained right it is to ride a value instrument’s price to da moon! What I am saying, to the general Bug-o-Sphere, is grow up.
Folks, it’s just business. I hate to always be the guy poking the eye of my own industry (financial market reporting, newsletters, TA, opinion/fairy story making) but those warning naive bugs against the evil entities laying in wait to attack poor old gold and take your money are selling a promotion. It’s either a promo of ignorance or one of fear and angst, which sells. When the data show extremes (ref. the red and green dashed lines I’ve drawn in) it’ll be time to consider risk management. And even then CoT is not a very good timer. It is a sentiment based indicator of risk/reward.
Moving on, let’s slap silver’s CoT in here as well. It too had a way to go to reach a concerning extreme as of Nov. 28. Silver is a leader, and this picture says that it can do just that for a while longer.

Sticking with silver, I have not touched this monthly log scale chart created back in 2021. It was originally a novelty, showing an Andrews Fork (black) and long-term trend lines (green). Well, it held the trend lines and tapped the fork in 2023. It’s cool looking and as a novelty, it’s also bullish.

Here is the linear scale of the same chart. As you can see there is work to do to overcome the very clear resistance traffic from 2010 to 2012. Silver tried to take it out coming out of the pandemic, but it was so overbought and ran out of gas along with the entire precious metals sector. However, it is worth considering that hard down in 2022 may have been a fuel stop as clear long-term support took a heavy, and ultimately successful test. RSI seems to be begging for breakout.

Gold Ratios (daily) are on track to a counter-cyclical theme despite the seasonal party going on in cyclical and risk ‘on’ markets. As a committed gold miner bull you’d want all of these ratios rising well.

Gold Ratios (weekly) shows an unchanged picture from when we last reviewed it (I have not touched the chart). Gold is still slithering sideways vs. the US headline index (note however, that gold is moderately trending up vs. beneath the surface markets like the Equal Weight S&P 500 and Small Caps).

It is also trending up nicely vs. XVG, the Value Line Geometric index (weekly chart), which is the median of 1700 stocks. This tells us that gold has been rising vs. broader measures of the stock market (as opposed to headline indexes driven by the usual over owned and over hyped sexy stuff), in this case since late 2021.

Gold has been in a nominal bull market since 2019 (1378 bull gateway). It is also in a bull market vs. the average US stock since 2021. This is stealth because the headline stuff driving SPX, well… it gets the headlines! I’d say we’ll be ready for the best of the bull market as gold takes leadership over SPX, NDX, SOX, etc.
Seasonally, what was good for the goose (stock market) appears to be good for the gander (gold). Despite a theoretical pullback starting now, gold is bullish in December and tops in February (on average).

Silver appears on schedule with its seasonal as well and if it holds true (and it usually does not in a close manner) silver would chop and grind into year end, then ram upward into February and again in April.

Final Thoughts & Strategy
For many extended periods over the last 20 years I’ve had to talk about the risks to the precious metals and especially to the precious metals mining industry. That was unsatisfying because I am a long-term investor in and believer in gold. What’s more, it’s just a lot more fun to actually be able to state a bullish view than it is to so often have to give reasons for caution.
For snippets in time (2001-2003, Q4, 2008 to Q1, 2011, Q1, 2016, H1, 2020) I was able to be bullish and proclaim so. During the 2004-2008 phase I was bullish as a TA while noting the degrading fundamentals in gold stocks. But the decades of disinflationary bond market signaling generally allowed our heroes over at Policy Central to print, manipulate and inflate at will to keep the bubble going. That kept the anti-bubble under wraps.
Today we look ahead to all of that changing. Our visual representation of that change is the 30yr Treasury Yield, which has had its decades long continuum of downtrending yields reversed, utterly smashed. Something changed and in my opinion those changes will present in a way that relatively shackles the bubble makers compared to their previous all-powerful remote management of markets. The anti-bubble should do just fine in that case and as long as gold’s ratios to cyclical and risk ‘on’ assets are rising, the gold mining sector should find that elusive thing known as positive leverage.
The best of the bull has either already started or it will start in 2024, pending a broad washout. We began this rally noting that the GDX target of 40 could be a ‘sell’ if the sector is rising along with a broad party atmosphere. We’ll stay with that view. But charts like the one directly above show that gold is already making headway vs. a world of markets and here let’s also recall the Gold/Global Currencies charts, which are purely bullish as we evaluate just how bearish the US dollar may go before it theoretically rises impulsively one day in a broad market liquidation.
Okay, I am killing you with details here and there are still so many more to cover. My strategy will be to analyze the rally from both technical and macro fundamental standpoints. While I don’t want to suffer a liquidation and lose paper gains, I also do not want to miss what could be an outstanding (if improbable to a majority) bull market by trading out of it. I will be expressive every step of the way about what I see and why I see it. Hopefully that will help shape and clarify details in an ongoing way.
Bottom line: Bullish, and possibly for head spinning heights in the coming few years. Interim volatility will certainly arrive. That is part of a bull market.
Seabridge Gold
While I pretty much had enough gold stocks (for my purposes) before the next buying opportunity materializes, this one jumped out at me, per this daily chart included in Friday’s trade log. The chart shows a pattern that I just love the looks of, both nominally and in ratio to gold.

The featured asset is its KSM Gold/Copper (future) development project in British Columbia. SA has no current production but is a company focused on growing its resources. I see SA as the type of company that speculators call an option on the future gold price, especially considering its other exploration stage projects. It’s going to take a big pocketed partner for development, much like Pretium or Great Bear and others.
But for me it’s a chart and its an exploration/future development story. It may or may not be an investment. At this time it’s a trade because I bought it primarily for the chart pending further analysis.
3 Gold Stock Tax-Loss Seasonal Amigos
In a similar vein, I added three stocks I’d been watching for tax loss season. But I got impatient as I saw several TSX-Venture types starting to pop. Had the post-tax loss play come early? Possible. But you know these little fellers. It takes but one fund buying or dumping to push them around in either direction. These three, MAIFF (MAI.V), AMXEF (AMX.V) and LGDTF (LGD.TO) are shown here in order of position size (they are the 3 smallest positions in the portfolio, but as a group make up a solid position comparable with other gold stock holdings).
It can be difficult to buy this stuff that has perma-trended down forever once they get moving. That is why I wanted to get ahead of it and not have to worry about missing out. See the trade log entry on the day they were added.

Today the Amigos are up approximately 19%, 13% and 16% respectively and I’m just holding. As per the note above, I’ll have a lot of patience, both in trying not to sell and in not adding to the positions at this time. I include it here because it is an illustration of the silly season we appear to be entering.

Meanwhile, favored gold stock holdings continue to be AGI, OGNRF (OGN.V), WDOFF (WDO.TO, as a turnaround play), AEM, EQX, WPM and SILV.
Watch list includes BTG (I want Sabina, but I don’t want the Mali gov. in my pocket), NGD, KGC, possibly FNV (although a big caveat about Panama politics), RGLD and GOLD.
Remaining tax loss seasonal spec on watch: SMDZF (SMD.V), although it jumped on Friday, right out of my hand.
On With the Report
Well, the opening segment has set us on a coarse for open ended free style report. So let’s do that, as the writer simply goes where he feels like going rather than slaves to normal report segments.
Palladium
It is a time to be looking at prospective seasonal trades. There have been several recently, including the buy (and subsequent sell) of Palladium right in the long awaited long-term support zone. Now PALL is dropping back to fill a gap and test the low. I have my eye on it for a potential buy-back. This daily chart obviously cannot show long-term support, but the November low stabbed down into that area. This retest could be an opportunity for a would-be Pd bull or seasonal player.

MP Materials
In the trade log I noted that this report would illustrate the rationale for my buy of Rare Earth Elements producer MP Materials (MP).
- MP is US based, a compelling strategic positive in a global market dominated by China.
- As yet, MP still relies on China for processing, a negative. We’d like to see this aspect on-shored as well.
- As for REE, they are critical materials. Not rare materials, but when processed they are critical elements to many progressive industries.
- In an ever more contentious world, the US needs to secure its supplies of vital materials. Enter MP in the REE space.
Here is the weekly chart advising how far the stock’s price has dropped since the 2020, 2021 and 2022 highs.
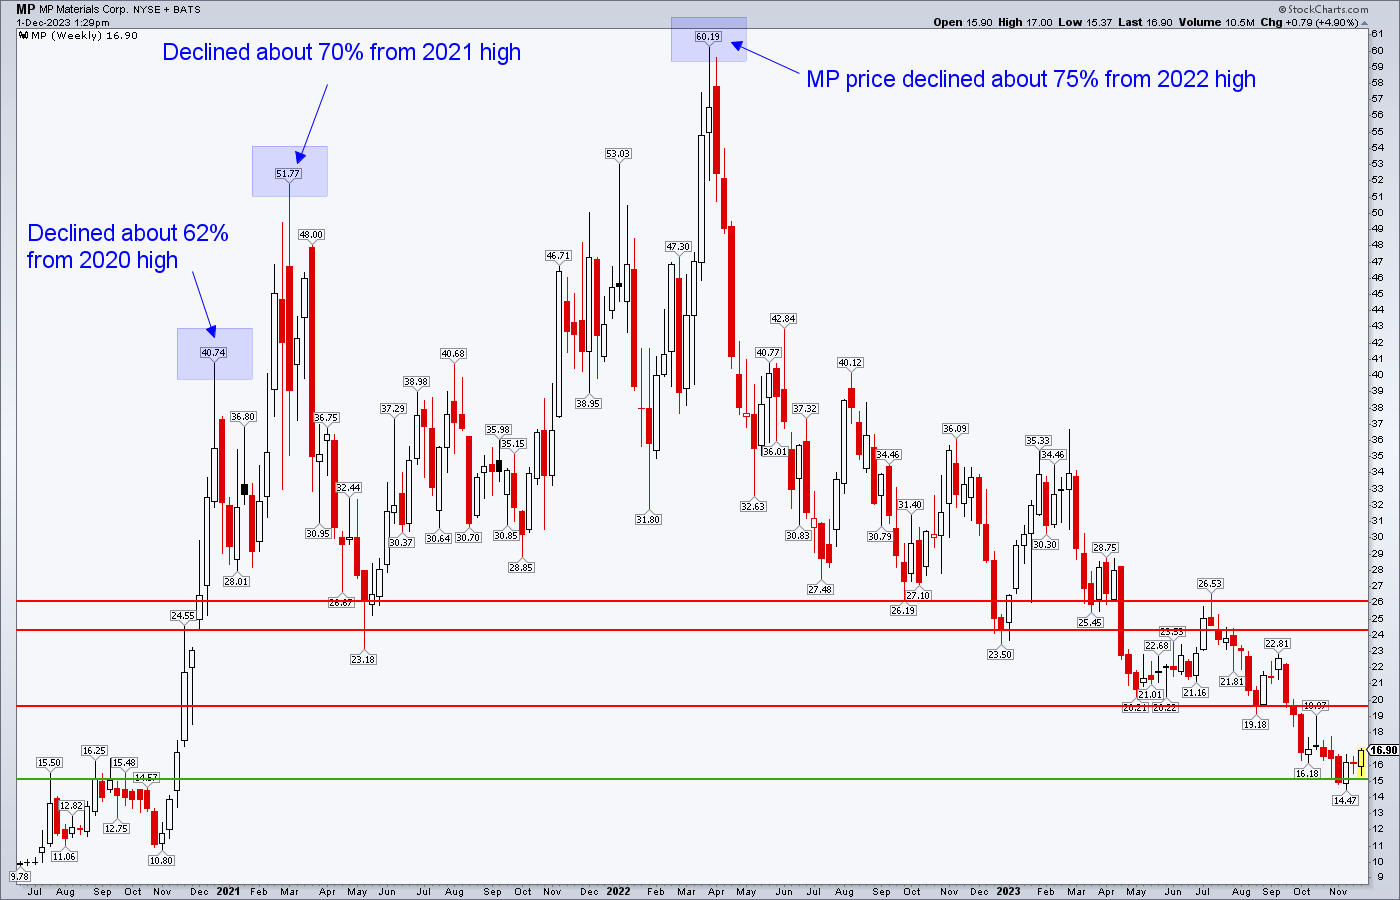
Now consider that heavy decline in MP stock with REE prices, some of which have dropped significantly year to date, but all of which have risen more significantly since January, 2020.


The data are from the Strategic Metals Invest website.
More information from the MP website.


After that promo, you must know that if I am wrong in my timing I’ll undo the trade. NFTRH is not a stock promoter, a trading service, a “buy/sell” caller. It is a macro manager and idea digger. You must always do your own final research. Otherwise, there are services out there that will be more than happy to pick for you and tell you what to do. I shall not. Just illustrating what I did and why.
US Stock Market
I will plan to highlight certain individual stocks during the week in NFTRH+ updates, as applicable and if/as the seasonal party moves forward. I hold a couple of BioPharma in ABBV and GILD. Have an eye on smaller ones, DVAX and CDTX. For whatever reason, Biotech and Healthcare correlate better with declining long-term yields than rising. It’s probably due to a shift toward more defensive positioning as declining bond yields indicate economic easing (as well as inflation easing).
The Semi > Tech > SPX chain wobbled last week but it is not broken. All of this stuff could continue to party through the seasonal. Risk be damned, eh?
SPX is knocking on the door of the July high and if it slips through that door we’ve got a potential test of the all time high in play. That test can slightly exceed the all time highs and still only be a test. Would it not be quite something if the “soft landing” noise grows right along with stock prices to a test of the highs? FO freaking MO, baby.
Contrarian sentiment is no friend of the bulls. Dumb money is eating itself some stock market. Starting to gorge itself, actually. Sentiment, complete with the “soft landing” promo is getting dangerous.

- NAAIM (investment managers) have sprung to 81% bullish from just 25% bullish in late October.
- Investors Intelligence (newsletters) are moderately over-bullish, jumping from 2.3 to 2.6 bull/bear ratio.
- AAII (Ma & Pa) have put on a big spike to exceed the July high. This one deserves a picture as it should be quite concerning to stock market bulls who understand contrarian sentiment.

Market Sentiment Bottom Line
If you are a bull you are running with an abundance of sentiment risk. The party can drag on, but if these signals remain in play or become even more extreme it will add another positive factor to our view that this is a FOMO-driven, emotional (happy days are here again, soft landing!) suck in of the innocent (or is that ignorant?).

With Respect to the Above
This chart continues to stand in contrast to the happy view that financial media are peddling. What do you supposed might help SPX build its secondary high and double top? Anyone? Bueller? Promos like the one directly above and the new one noted on Friday if they gain enough traction.
The stock market is literally betting that it will be different this time and a fade in the 2yr against a still firm Fed is not indicating economic deceleration. Right now, amid Goldilocks/disinflation, the market chooses to believe a soft landing will come about. But the Fed was tardy in taking up the battle against “transitory” (ha ha ha) inflation and it is likely tardy today in easing off the hawk. They will stop being tardy when the market forces them to stop, just like they stopped talking “transitory inflation” and got on the hawk only when the market finally forced them to stop dallying. It was a no longer deniable inflation problem that forced them off the “transitory” shtick. I expect it will be a deflationary problem that does the trick this time in the opposite direction.

Global Stock Markets (daily charts unless otherwise noted)
Please take due note that local currencies play a role in market performance for global citizens. NFTRH being American, cannot get too far afield managing all those moving parts with my simple charts. So global market comments and charts are for reference.
I have gone a little overboard with some segments above, and need to step it up to complete the report. Here are the global charts. Please just use them for reference of trends. It’s a mainly constructive to bullish picture on the short-term as the US dollar continues its correction. Exceptions are the downtrending UK and the firmly downtrending Hong Kong, which also reflects the state of large cap Chinese stocks. Canada’s TSX-V continues to bounce, indicating that the tax loss seasonal play in small resource stocks and scams alike, may already be in progress.


Commodities (daily charts unless otherwise noted)
Doctor Copper (weekly chart) decides to join the seasonal party. He’s sent the office staff home early, popped a cork and sneaked Wayne and Garth in through the side door. Strong resistance in the 4.20 area. Meanwhile, some copper miners could do well as long as the seasonal persists. I’ll keep casual tabs on SCCO, FCX, etc. but prioritize ERO, which popped away from me on Friday but is down to the 13s from a summer high of 24 and is a tax loss seasonal candidate.

I heard some buzz last week about tight copper supply and policy easing in China. But the aforementioned China large caps are in downtrend/tank mode. More often than not bullish copper prices travel with bullish China hype. Not now, not yet. I do wonder if FXI components may provide a seasonal ‘tax loss’ type trade, however.

With respect to last week’s highlight on ‘Fert’ stock MOS, it continues to hold the SMA 50 and support and is still a prospective seasonal ‘bottom feed’.

CRB index and crude oil have been thrown out of the party for previous over indulgence on OPEC+ stimulants. Both items are trending bearish, with the caveat that OPEC+ could change the picture if it is able to get its members in line with output cuts (code for price manipulation).
Gas is still in correction after breaking down from its base, while the industrial metals index is looking prospective for the seasonal (led by Doc Copper). The Ags could be basing for a bounce.

Uranium stocks have been relatively stellar performers within the commodity complex. I continue to simply hold the ETF, but am also casually watching usual suspects NXE and UUUU. But for now, URNM it is. The blue lines are the 50 day moving averages, which I want to see continue to hold for me to continue to hold.

Finally, our laggard chart showing some of these items starting to take out their downtrend channels and/or wedges. Notice how REMX and favored REE play MP have sneaked out of the upper line.
Give me a reason to even get a clue that Lithium may get played again and I’d take up LTHM, which is also sneaking out of its channel. Stuff like this is the embodiment of a would-be post-tax loss seasonal play. What’s more, Lithium Americas (LAC, not shown here) has been utterly bombed after spinning itself into two different companies. Insiders began buying in October after selling heavily through September. Might be worth a speculative look.
As for SBSW, I’ll probably continue to er on the side of Palladium rather than spec on its producer. But SBSW fans will note the deeply sold and partial bounce back condition after a recent ill received financing.
Finally, Nickel prospector TLO could be a good seasonal tax loss play and is still a potential forward investment as well. But with these resource stocks you could get a perma downtrend until one day they just tear ass. Tough racket in its potential to compound losses and gains alike. Time wise, it’s mostly losses. :-(

US Dollar
Let’s quickly slip in the US dollar index before wrapping up. We noted that it was bouncing to test the breakdown from the SMA 200 in an NFTRH+ update on Thursday. On Friday it poked through, probably on some Fed hawk/soft landing hype. But then it quickly reversed back below and remains in a bearish posture. USD: short-term bearish until proven otherwise (by taking out the SMA 200).

Portfolios
Savings balanced by gold
Trading Account: No positions
Roth IRA (non-taxable, no contributions)
Cash is 80%, which feels about right for my needs right now. It’s seasonal party time but I have a good level of concern about that over-bullish and quite contrary bearish sentiment profile developing on the US stock market. As always, cash will be regulated up or down, possibly with great conviction, as needed. It’s now been a pretty good year and I don’t want to screw that up. That includes my dear gold stock sector. It’s just that with gold stocks, I’d rather hedge (as needed) than sell.

Cash & income-paying Equivalents are at levels that are right for me and my real-world situation. Your situation is different. Cash will be adjusted as needed.
Refer to the Trade Log under the NFTRH Premium menu at nftrh.com for trade info, if interested (not that you necessarily should be). Also, you can follow at Twitter @NFTRHgt for notice of updates.
NFTRH is not to be distributed to third parties without prior written consent
Notes From the Rabbit Hole (NFTRH) is a weekly market report in which we provide analysis on financial markets. We make every effort to provide accurate and high quality content, but this analysis ultimately represents our opinions and these opinions are provided without warranty or guarantee of any kind. See full terms & conditions of service under the ‘About’ heading in the main menu.