
Executive Summary
Now that I’ve settled in to the preferred presentation format (online, convertible to PDF, as opposed to creating using Pages/PDF documents) I want to go back and revive one aspect of the old format that I think has a place here. That is a quick reference executive summary for your review.

US Stock Market
SPX came close to losing the little short-term bear flag but on Friday afternoon came the kick save. Why again am I not prepared to be bearish until the December low (3764.49) is lost? I don’t think we need to spend much time here. The market clings to intact status and folks, if there is any relief play out there using ‘BANK RELIEF!!!’ as an excuse, currently over-bearish sentiment could ignite this pig. If that were to happen, the next and possibly best target is a gap fill at 4219 up to around the 4300 area.
Bottom Line: Hold here and SPX resumes the Q1-Q2 portion of the rally. Drop from the would-be bear flag and take out 3764.49 and it’s “bear on”, baby.

Let’s have a look at the leader, big Tech, in the form of NDX. The index halted at a potential short-term double top juncture. The only slight reason to question its bullish situation is that it has not (yet) taken a hard drop after the “Golden Cross” of the SMA 50 above the SMA 200. But that may be over-thinking it. It’s a bullish situation currently.
NDX is targeting a test of the August high and a gap fill, as would be SPX above if it holds its December low. Personally, I took the profit on CRWD but in light of the situation in global markets, probably should have eliminated TSM and/or ASML instead. But it’s no biggie.
As a side note, much like the gold stock ETF GDX, NDX has some higher gaps. Those would come into play if the less favored (but viable) scenario of a US stock market test of the highs comes about. Imagine the FOMO that would instigate!

Meanwhile, Semi (SOX) is still leading the leader (NDX) and thus the US market leadership chain is fully intact with no divergence.

US Stock Market Sentiment
AAII (individual investors): Very bearish, which is contrary bullish.
NAAIM (investment managers): On a hard pullback in enthusiasm with the banking situation, and contrary positive.
Investors Intelligence (newsletter writers): Not gripped by despair, but certainly not enthusiastic. Contrary constructive at least.
Smart/Dumb money indicators: Contrary bullish.

Global Stock Markets
Going back to the global picture relative to the US stock market, let’s observe some degrading looks.
Europe/US is in a potential trend change, but struggling for all of 2023.

Germany/US is better than Europe as a whole, as it continues to ride the intermediate uptrend.

UK/US has taken a hard dive to test its major uptrend. This as GBP/USD pair has been going bullish lately. Makes sense in the paper currency game of macro Whack-a-Mole.

Canada/US is not looking good as the ratio has broken below the major uptrend marker, the SMA 200 after not making a higher high to last June.

Canada Junior/US has been making higher highs and lows since Q4 and is interesting in its potential to help a relief trade in the wider inflation trades. Hmmm… the Gold/Silver ratio has been declining lately and that fits with this little uptrend (within what is still a larger downtrend).

Australia/US is similar to TSX/SPX (except that it did tick a higher high before the downturn). Coincidence? Probably not. Both are ‘commodity/resources’ countries and these views are contrary to the one in the paragraph directly above.

Japan/US is neutral with a bullish bias. The recent pullback has come with the Yen rising, however. If risk goes hard ‘off’ and Yen ramps up, I’d expect Japan to under-perform. If relief sweeps the world Japan could regain leadership. It’s a theory, anyway.

Hong Kong/US is neutral at this time as it slides along the now sideways SMA 200. Much of Asia is similar.

EM/US is bear biased despite the weak US dollar. That does not seem sustainable. At some point we’d expect either EM to rally or USD to rally, this being a generally anti-USD segment of the global markets.

Brazil/US is flat out awful. If this were a stock chart I’d be short. It is also a negative indication for the inflation/reflation/resources trades, when taken at face value (though I am far from any sort of authority on Brazil).

India/US is another that a short seller might look at, were it a stock. Indeed, maybe it is time to look at some global shorts vs. US longs still held. Maybe, but probably not since cash/equivalents are working so well.

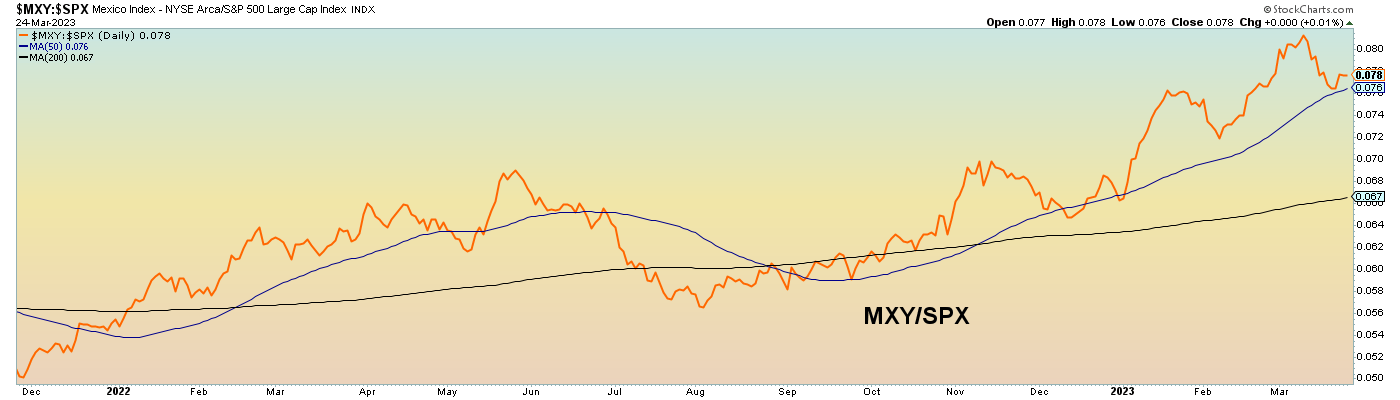
Finally, Mexico/US is still on the relative bull move noted when we last checked in on these relational views.
Bottom Line
Global stocks on balance are of little interest even as the US Tech-led Q4-Q1 rally limps on. In fact, several global markets have broken bearish in relation to the US market.
Precious Metals
Gold has been doing what is is supposed to do amid alarming systemic threats (in this case the supposed banking meltdown). I have little doubt that the gold cult “community” is touting the bank meltdown headlines as the big one, but the proof is not yet in the Gold/Silver ratio or its fellow liquidity destroyer, the US dollar. Although the yield curve has started to steepen with a deflationary flavor. So bank headlines or not, the process toward economic contraction and a market liquidity issue could be starting.
But markets don’t go where they are going in a day, week, month or sometimes a year. Gold dinged round number 2000 and halted there last week. Silver has been leading, which is curious given the would-be ‘end of the world’ message coming from the banking headlines. Gold was covered in this public post (apologies for having to wade through my unprofessional ‘Larry’ stuff, but it was a public post after all and Larry is Larry, after all) and silver was covered in this update. There is no status change.
But here is the interesting thing. Silver’s rally in gold terms is coming amid the banking crisis and its would-be liquidity implications. But why? Silver is more inflation sensitive, more cyclical and more of a commodity than gold.
As of now, the Silver/Gold ratio (SGR) is in a little pattern lurking at the junction of the daily SMA 50 and SMA 200. Fail here and it’s likely risk ‘off’ and real trouble ahead. But break through here and we could have the making of a final phase of the broad global asset market rally, this time including commodities and a wider swath of markets/sectors than the Tech leadership to this point. But why don’t we wait to see if the SGR breaks through or not before setting a view in stone?

If SGR were to break through I’d lean toward the precious metals rising and leading the final phase of the broad asset rally. It could be quite dynamic. Then we’d watch for a top in the PM complex that could lead a broader failure.
But now we are getting into crystal ball reading and mine is a hazy one. Always has been because in fact there are no gurus, swamis or seers of the future. There just aren’t. I don’t care if they are using cycles, the moon, the stars or Tarot cards or fancy toilet paper; there just aren’t. There are only hard workers using whatever their discipline may be but with a mind to adjust, adapt or alter as needed.

That said, there is potential now for a relief driven tale wind to the broad rally and there is further potential that the inflation trade stuff could participate, if not lead. Remember, markets move on inconveniently long time frames and a renewal of spirits in the inflation trades could come within an overall journey toward deflationary impulse out ahead. So let’s continue to keep a close eye on silver, not only for silver investors but also for macro managers.
The Miners (daily charts)
Generally, I think there is higher to go in the near-term and as of now, I am watching the gold stock sector as a canary for a future top in stocks. Remember, the gold miners have been a leader in the broad rally out of Q4, 2022. I would look for a higher high to the January highs (generally) as a target for this leg. Then if things go logically, we could get a pullback in the miners that could precede a resumed bear market in broad stocks. It’s a theory.
GDX whipsawed at and ultimately held the SMA 200, gapped up (let’s keep this gap on watch for the future), filled an upside gap and now would seek a higher high to January. But with RSI and MACD green and not overbought, I’d like to see GDX fill not only upside gap #1, but also #2 at resistance surrounding the 36 area.

AEM (I hold it) held logical support, rallied and will now try to take the SMA 50. There is a gap above and I’d like to see it tick a higher high to resistance before the next pullback.

BTG (I hold it) is similar, except that its correction broke through support I assume due to the acquisition of Sabina Gold & Silver (which I am in favor of). Again here, I’d like to see it tick a higher high to resistance.

HL (on watch) is a silver miner that took out AXU and has a gold component as well. It also intends to acquire ATAC Resources. Resistance is just above and with RSI & MACD just ticking green it could take out resistance and perhaps fill the April 2022 gap at 7.

KGC (on casual watch) is of interest because it is a senior miner (again, I am favoring miners over royalties at a time when gold is outpacing mining input costs) and because it bought out my former holding, Great Bear Resources (hat tips to Scott and Michael). But that is well out on the horizon. KGC is eyeballing a gap at 4.60 and resistance in the 4.80s.

MAI.V (MAIFF, I hold it) is still going southward. Period. It’s a downtrend. But I am holding it for the future, which will hopefully include more conducive weather and which does include quality management (IMO).

NEM (I hold it) has been a laggard, and that is fine. I bought it due to its laggardship and its status as a primary large miner. Apparently it made an acquisition that some question, but I’ll go by the chart. It was a bottom feed and I’d like to see it take out the downtrending moving averages and pop to at least fill the upside gap around 52.

ORLA (I hold it) took out long time underachiever stock Gold Standard Ventures and maybe with GSV folded into the company its operational performance and future prospects are in line. The market certainly seems to think so. That is big post-earnings volume. A side note is that ORLA did not correct with the rest of the sector in February. That means ‘strong hands’.

OGN.V (OGNRF, I hold it) is a small royalty sloppily flagging sideways lately. But a weekly chart would show a sneaky bullish looking situation. This is a chart that is just waiting for news to send it somewhere; hopefully up.

SSRM (casual watch) is a laggard and former leader. I cannot recall what operational or geopolitical issue may have sent it to laggard status but it could be worth looking into.

SILV (profit taken, back on priority watch) has butted its head up to the neckline of the “complex inverse Head & Shoulders”. If you know me, you know I am making fun of TAs with that statement. It’s actually a mess, but if this mess breaks through it would target a measurement to the 9.50 area, which just happens to have a gap up there from April, 2022. Hmmm, I may need to buy this one back. I did not consult the chart in any depth before selling it.

SKE (casual watch) is something that more learned miner watchers than myself had interest in last year. I have no clue what the valuation/fundamental status is currently but am always open to bottom feeding. SKE is dealing with resistance at the SMA 50, but has taken out the SMA 200.

WDO.TO (WDOFF, on watch) is another fallen angel, that has taken to disappointing the market. But it is also another potential bottom feed and it is in the right geo location. Could be an eventual takeout target. It’s looking at clear and firm resistance right now. There is more at the downtrending SMA 200.

Finally, a new one, OSI.V (OSIIF) was added last week and quickly pumped itself in the right direction. This is an Africa based potential takeout (notice a theme here and in several items above?) target according to Jordan Roy Byrne, who covers this stock. As for me, I liked the chart as it nested above the SMA 50 but will consider selling it if it dings 1.20. We’ll see. A lot depends on my sector view at any given time with this and several others.

Commodities
With reference to the Silver/Gold ratio above and the idea that the relief rally has the potential to spread to the inflationary/reflationary stuff with a potential trigger being relief from the banking crisis headlines (which have helped ram home our deflationary view, but which gives me caution on that view, near-term) I am open to taking some temporary commodity related positions (Copper, REE/critical materials, Uranium, Energy, etc.) should that relief play start to engage.
But as of now, the status is…
CRB Index: Trending down and bearish after a breakdown through support and away from the SMA 50. Currently on a little bear flag to test the breakdown.
WTI Oil: Very similar status to CRB.
NatGas: Post-crash, still bearish but also of note it is once again probing very long-term support dating back to the 1990s. Trying to form a little pattern with positive divergence by RSI. It’s going to bounce at some point. And when Natty moves, it tends to tear ass.
Copper/Industrial Metals (GYX): Copper has risen from support to test the underside of the SMA 50. On Friday it held below. But it’s worth watching the good Doctor to see if he may prescribe a wider commodity rally. GYX is still bearish but it did take back the SMA 200, has triggered MACD and has the look of something that could bounce.
Uranium: u3o8 price tracker SRUUF is near its lows dating back to Q4, 2022. That is about all we can say about it; it’s been driven down to what would be a buy area for ardent long-term bulls. The sector (URNM) and many components are at a similar status. Bearish charts, but levels that true believers would consider adding to positions.
REE/Critical Materials, Lithium, Palladium & Platinum and Nickel: REMX has been beaten down to the lows of its ongoing downtrend. Watch item MP is down there as well and very much on watch if the commodity/resources view improves (for a trade). MP is a stock I want to hold long-term, but said long-term could be after a broad bear market plays out and they start rebuilding Ukraine and other war torn places. Battery materials Li & Ni are tanking and at support (after a decline), respectively. Watch items ALB & LTHM (Li) are at the low ends of the last year’s range much like other commodity stocks. All of this stuff appears a candidate to bounce if any relief from the deflationary grip of the headlines comes about. Nickel watch item TLO.TO (TLOFF) has tanked to the support of the 2020 highs and for that reason, I am going to consider adding it back. But much like MP above, this is a stock I like long-term strategically as well (Tesla Ni offload agreement).
Agricultural (GKX): If there is one commodity segment I’d avoid if I get a good feel for a coming bounce/rally, it is the Ags. The chart of GKX is just plain bad. Daily, weekly, you name it. Watch items MOS and NTR are bad too, but like many commodity/resources producers they are bombed out and would probably bounce if broader commodities and inflation trades do.
Currencies
USD and the Gold/Silver ratio (daily chart) are each technically suspect and vulnerable. Why is this happening amid the terrible headlines and over-bearish sentiment? Should not each of these have risen with that kind of backdrop? Yes, they should have. Or perhaps the banking thing is over blown or going to be at least temporarily papered over.
This could also be a sign of market players projecting the Fed to roll over dovish. Regardless of the ‘whys’ USD needs to take back the resistance at the SMA 50 to get out of trouble and the GSR needs to hold here. If they do not, our developing view of interim relief – including the inflation trades – takes a step forward.

Global currencies are reflecting the compromised state of USD except for the commodity currencies (CAD & AUD). If those were to recover and join the bounce-a-thon it would aid the commodity bounce view. As yet, it remains a negative for the commodity view.

BTCUSD (weekly) is still investigating the bounce target resistance at 30000. The range can extend up to 33000 or so.

Porfolios
Savings balanced by gold.
Trading Account: no positions
Roth IRA (non-taxable, no contributions)
Cash is at 85%, which seems about right for me at this juncture. If we start to get incoming signals for a relief rally, I’d probably lever in and if such a rally includes the inflation stuff I’d look at bombed out items REE (e.g. MP), Uranium (URNM, NXE, UUUU) and maybe even a copper stock (e.g. FCX) or energy stock (NOG, AR, CVX, XOM, etc.) or two.
As for gold stocks, I am going to assume they can continue to lead (up to targets noted above), but with a caveat about what any banking relief play might do to gold.
But this is all shorter-term stuff. The big play as it appears to be shaping up is for a resumed bear market in broad stocks that could hit the gold miners, which might then be bought for a longer-term and dynamic bull market.

Cash & income-paying Equivalents are at levels that are right for me and my real-world situation. Your situation is different. Cash will be adjusted as needed.
Refer to the Trade Log under the NFTRH Premium menu at nftrh.com for trade info, if interested (not that you necessarily should be). Also, you can follow at Twitter @NFTRHgt for notice of updates.
NFTRH is not to be distributed to third parties without prior written consent
Notes From the Rabbit Hole (NFTRH) is a weekly market report in which we provide analysis on financial markets. We make every effort to provide accurate and high quality content, but this analysis ultimately represents our opinions and these opinions are provided without warranty or guarantee of any kind. See full terms & conditions of service under the ‘About’ heading in the main menu.
I’m loving SKE at these levels – big high grade resource with reasonable capex. Should be taken out before mine build. I’d like AEM, but they already have a lot of acquisitions to digest.
Thanks Steve. Bears looking into. I appreciate the input on it.