Here on Fed day I want to talk about things other than the Fed and its upcoming .25% rate hike.
We have not reviewed sectors relative to the S&P 500 (SPY) in a while, so here is an updated look at the daily chart status, including a new chart that takes a look within the metals complex.
Financials have obviously tanked in relation to the broad US market. Energy has been gently rolling over. Healthcare, has not acted defensively in 2023 and that is actually an indication that the Q4-Q1 rally is still intact. Industrials do not look good. Same holds true for Materials. These two are cyclical “reflation” sectors, so that also makes sense. We are favoring Goldilocks currently, insofar as we’d be bullish on the stock market.
And speaking of Goldilocks, there is Tech in the bottom panel doing as it should do for this phase, leading for all of 2023 so far.

Real Estate is brutal, even with interest rates likely having topped out. That sure is not a cyclical positive. Utes? Not very defensive and looking ugly relational to SPY. Another sign of an ongoing rally in risk ‘on’. Transports are flashing a neutral (at best) look for the cyclical markets. Biotech, which I frankly had expected to take up some leadership, has not. It’s an ugly comp to SPY. As I was reviewing Amgen’s fundamentals the other day I did notice ‘drug pricing pressure’ in the mix.
A former market leader we used to watch frequently, the Medical Device sector, is wallowing now. Medical Device is a defensive sector in that the industry is relatively immune to recessions. But as we’ve noted often in the past, valuations are an issue here and much of the 2022 bear market phase was about valuation compression. Eh?
Retail vs. broad is another bad cyclical indication.

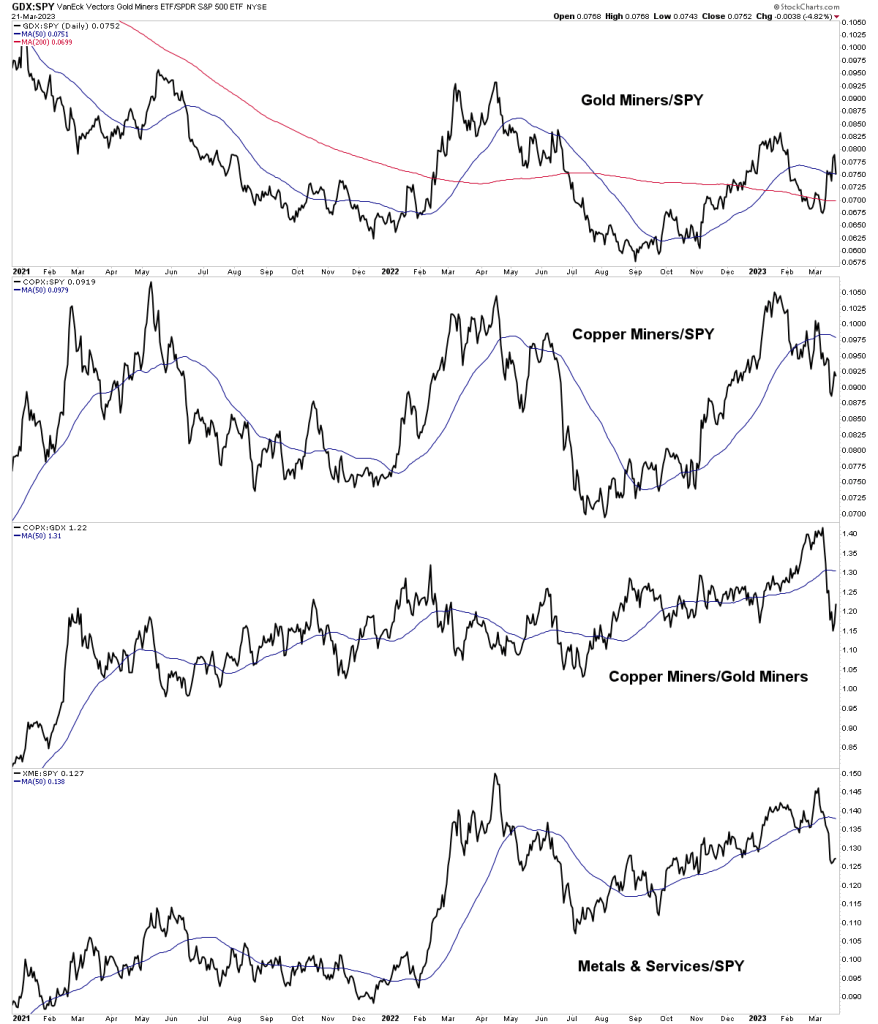
So if we are mentioning the word “cyclical” so often above and showing what looks like its failure, we should take a look at the counter-cyclical gold mining sector. As you can see, it has not changed to an uptrend vs. SPY but there is that potential after leading from the September low, taking a hard pullback and now trying to re-take the 50 day average.
Another would-be negative cyclical indicator is copper mining vs. SPY. There is a short-term top and potential for further downside. But it really gets interesting when you look at cyclical copper miners vs. counter-cyclical gold miners. That is a hard crack down to at least compromise the uptrend by ticking a lower low. If the markets gain relief in the near-term COPX/GDX can continue to bounce, but that hard plunge to a lower low could be a scout for the future.
Finally, the metals complex (including a few gold miners, many base metals producers, specialty materials and associated services like metals service centers (in essence, distributors) is still in an uptrend vs. gold miners [edit] SPY (higher low to September), but that is a hard crack as well and can be watched for future breakdown.
