The copper price (futures); suspect at best, ratio to gold at a limit area
Copper is back below the 50 and 200 day moving averages after failing to get above resistance at 4.45. RSI and MACD suck and we may soon hear about a malpractice suit by wide eyed cyclical inflationists against the good doctor who, along with his legions of commodity/inflation-centric promoters, have been guiding their herds upward to the high metallic heavens.

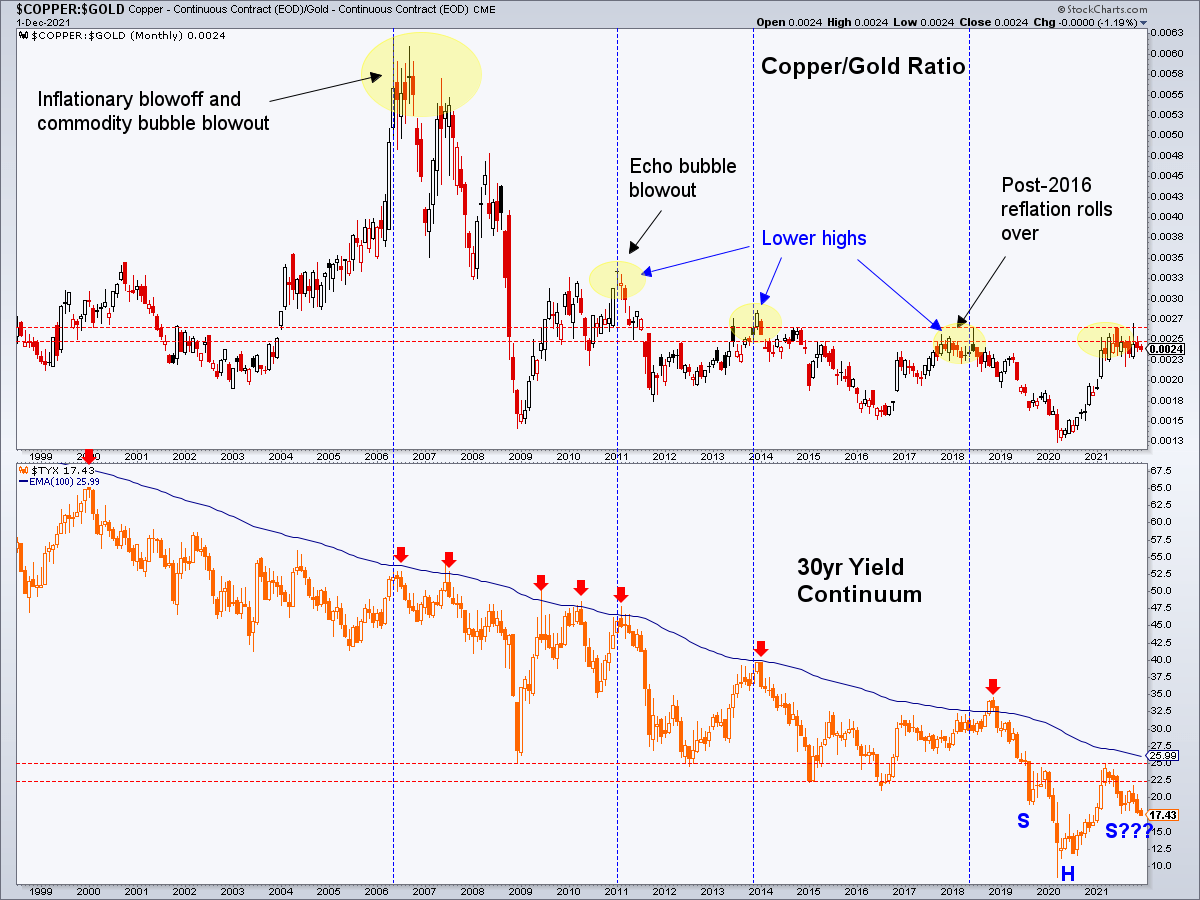
I ask you to ponder this chart and tell me what potential you see. And I don’t mean potential for gold (just yet), but in a macro sense. Beuller?
For “best of breed” top down analysis of all major markets, subscribe to NFTRH Premium, which includes an in-depth weekly market report, detailed market updates and NFTRH+ dynamic updates and chart/trade setup ideas. Subscribe by PayPal or credit card using a button on the right sidebar (if using a mobile device you may need to scroll down). Keep up to date with actionable public content at NFTRH.com by using the email form on the right sidebar. Follow via Twitter @NFTRHgt.