I’ll start this brief update with a question. How damaging was that #silversqueeze promotion to inexperienced, gullible true believers, anyway?
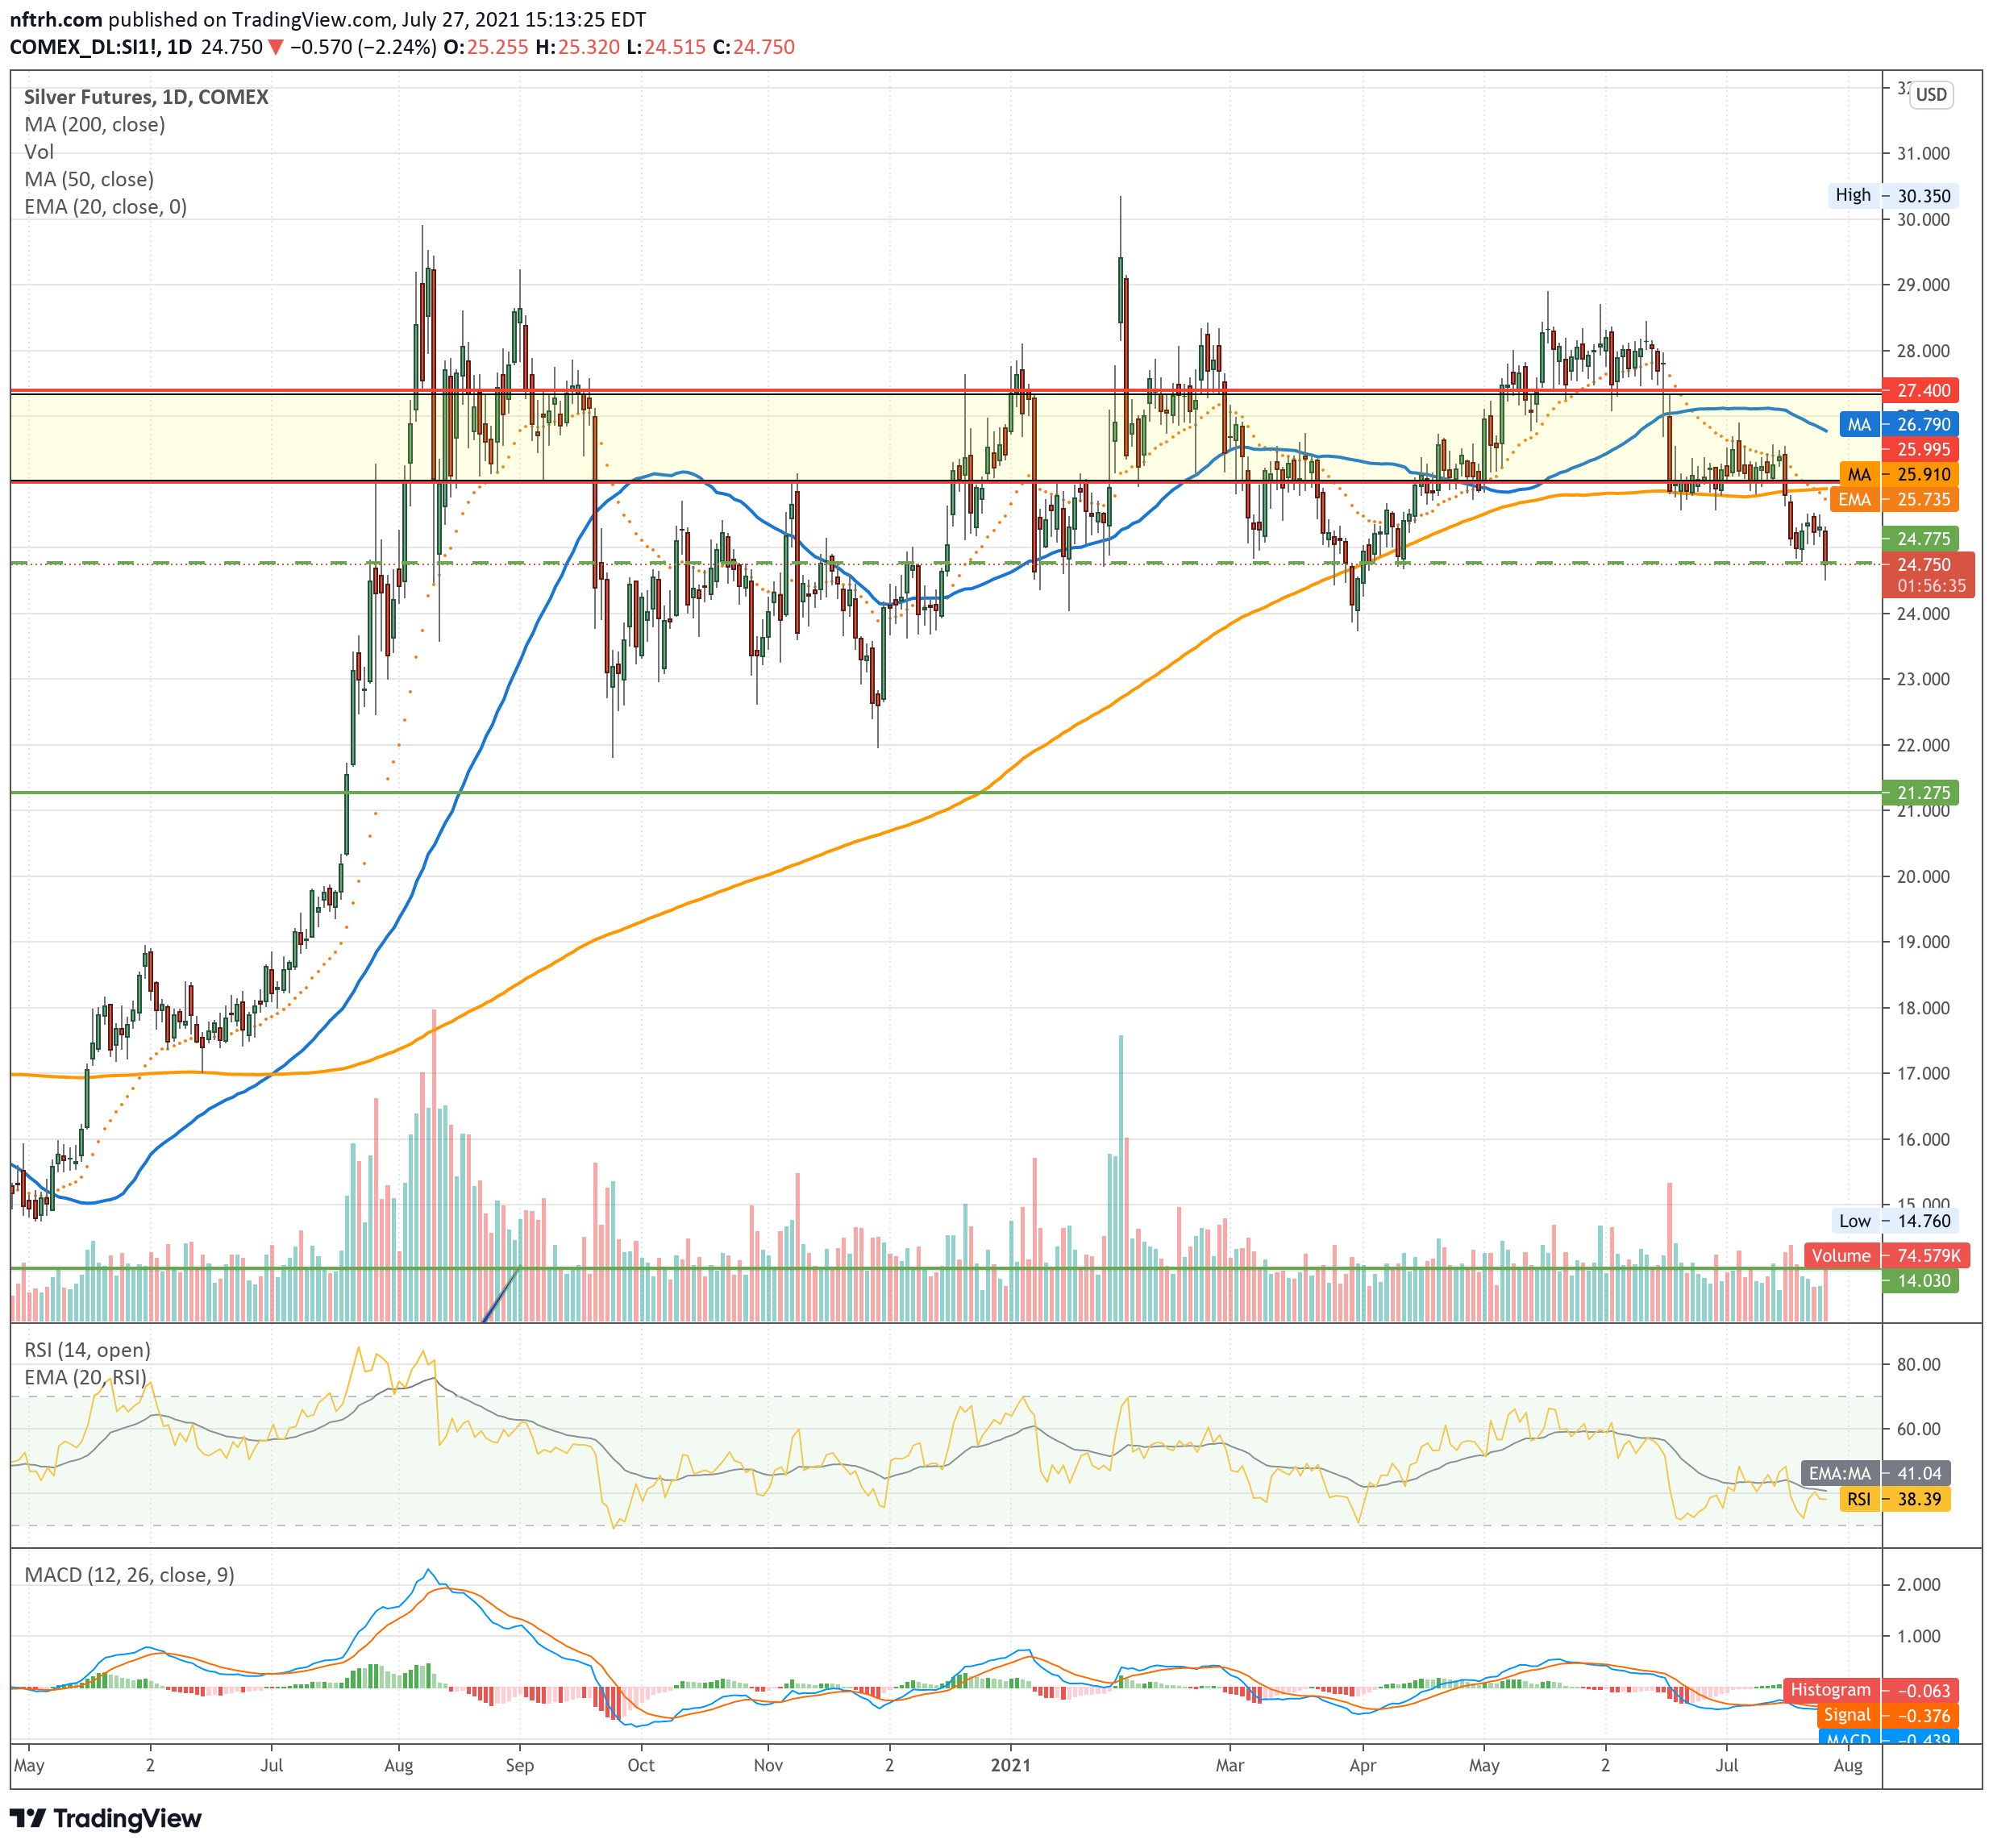
Silver’s daily chart has dropped out of the little bear flag noted in NFTRH 665 and is now at a lateral support area. After making a lower high to the #silversqueeze hype spike on February 1st it should avoid a lower low to the March low to avoid a complete breakdown. In other words, it is at an important support level right now. It’s important, but also suspect with the price below the SMAs 50 and 200.
If silver loses support there does not look to be much support until the long-term bull market breakout point of 21.23 (yes, that old target is back in play).
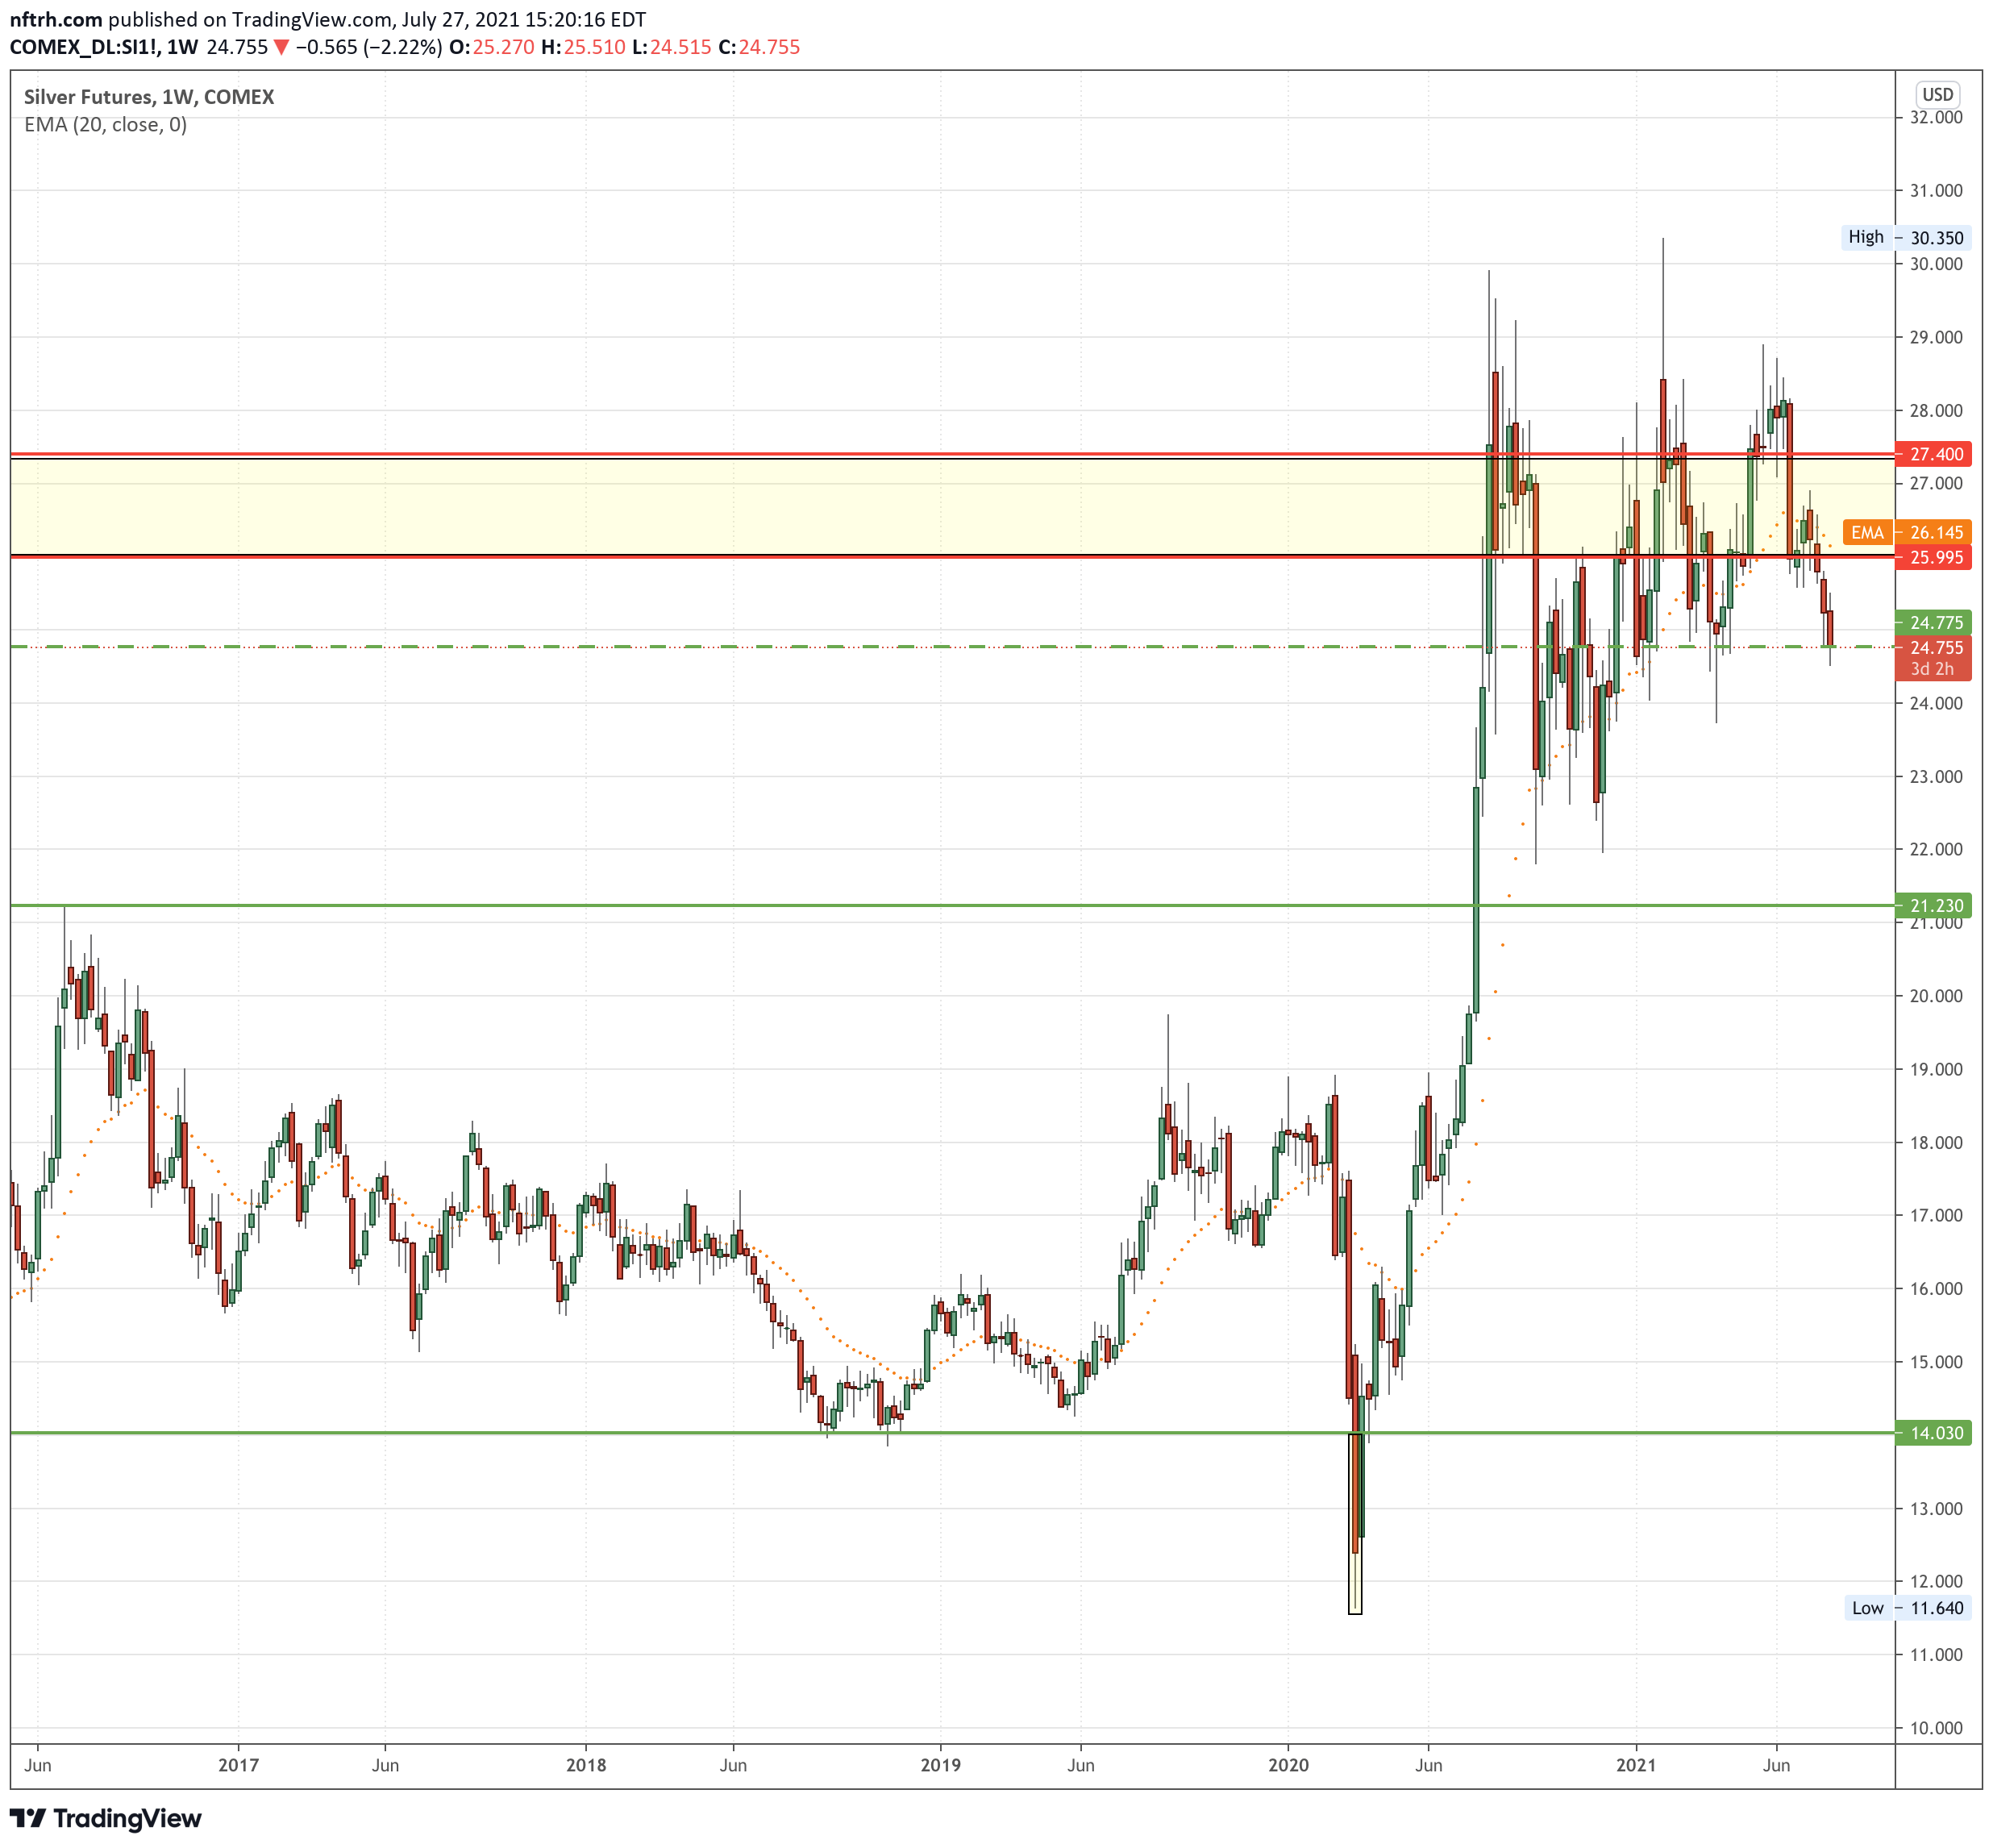
Here is the weekly chart showing the breakout point at the 2016 high. Lose today’s level and the chart says it’s not likely to be pretty in the near-term.
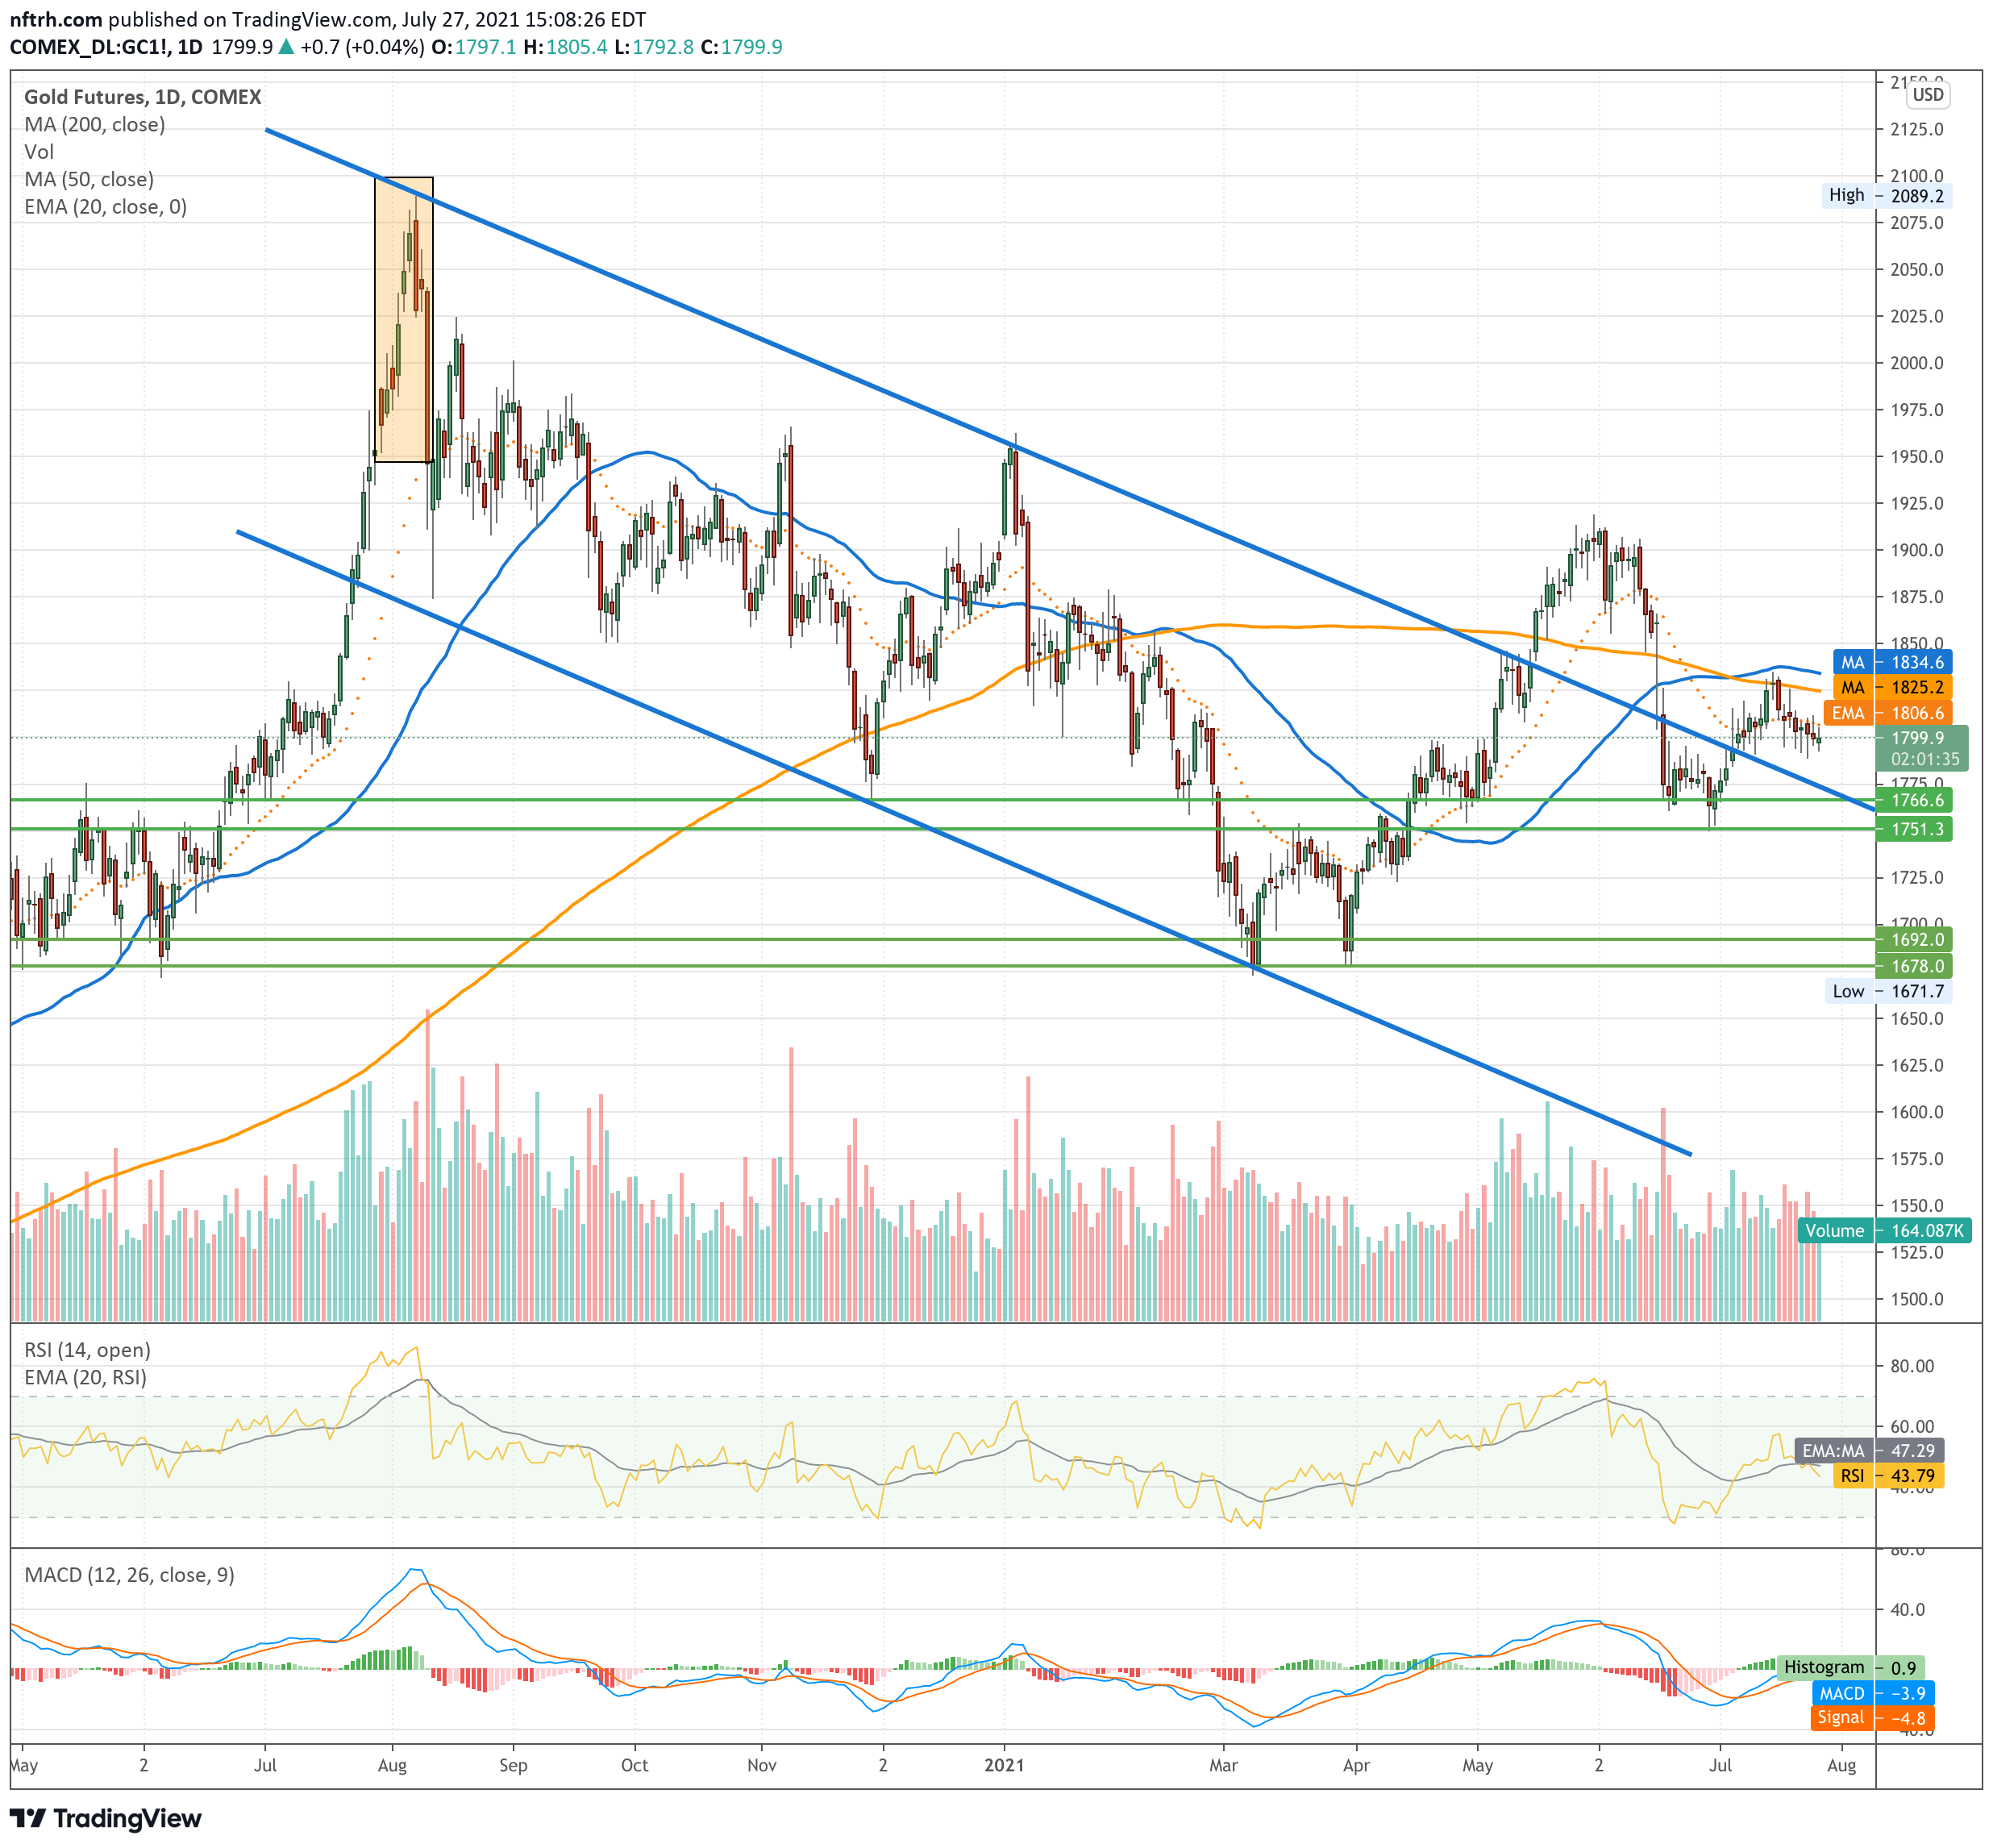
Gold’s daily situation is still in channel breakout mode. That is also the handle to a bullish big picture Cup. But let’s curb any enthusiasm unless gold clears the SMA 50 and SMA 200. Still, it’s in better standing than silver. The wider implication of this is that if the Gold/Silver ratio continues to rise there would likely be trouble in the inflation/reflation markets.
The weekly chart shows the alternate and less favored inverted H&S scenario. It’s even less favored now but as long as gold holds the 1750-1760 area support it’s a possibility, especially if something goes wrong on the macro.

Just trying to call the metals as I see them technically, at this time.