Let’s clip just a little bit of NFTRH 564 having to do with the state of Commercial Hedgers of gold and silver prices, as part of the overall Commitments of Traders situation (graphs by Sentimentrader, mark-ups mine)…
Gold’s CoT structure is generally thought to be extreme, and it is. Commercial Hedgers are as net short now as they were at the [gold price] top in 2016. But the areas highlighted in orange show similar situations; an initial thrust in commercial hedging. But then the entire 2001-2011 bull market was spent with hedgers increasing net shorts. That is normal because that is what hedgers do. I don’t worry about the absolute level of net shorts being so much more extreme than at the start of that bull market because we are talking about nearly 2 decades of time having passed. Who can quantify the changes in internal dynamics of the gold market? Certainly not me.
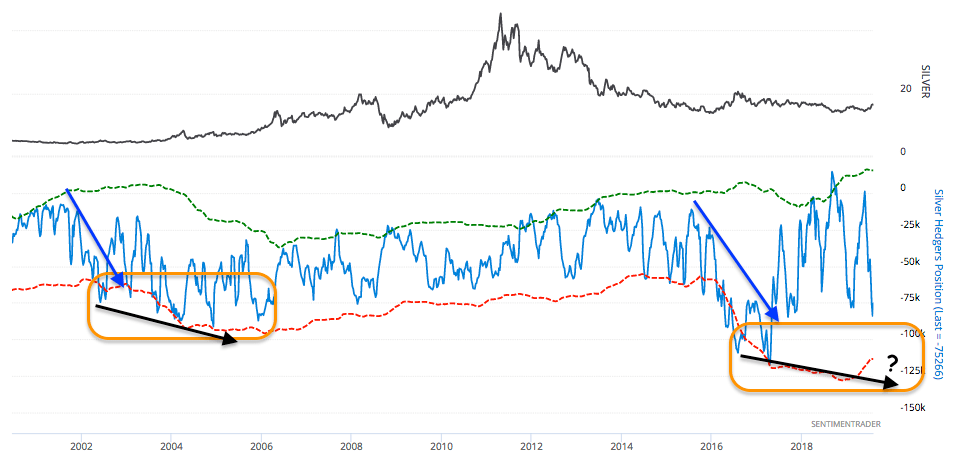
Silver is interesting because while it, as with gold, is not in a low risk posture the blue arrows note an initial surge in net shorting by hedgers and the 1st black arrow notes increased shorting as the bull got going in the early 2000s. If we are not dissuaded by the absolute value of net shorting we can note that a correction can come at any time but that a subsequent bull market can easily come out of this setup.

Subscribe to NFTRH Premium (monthly at USD $33.50 or a 14% discounted yearly at USD $345.00) for an in-depth weekly market report, interim market updates and NFTRH+ chart and trade setup ideas. [Note: the subscription rate to the value-priced NFTRH service will increase near summer’s end, so if you are considering a subscription don’t wait to lock in the current rate]
You can also keep up to date with actionable public content at NFTRH.com by using the email form on the right sidebar and get even more by joining our free eLetter. Follow via Twitter @NFTRHgt or StockTwits.