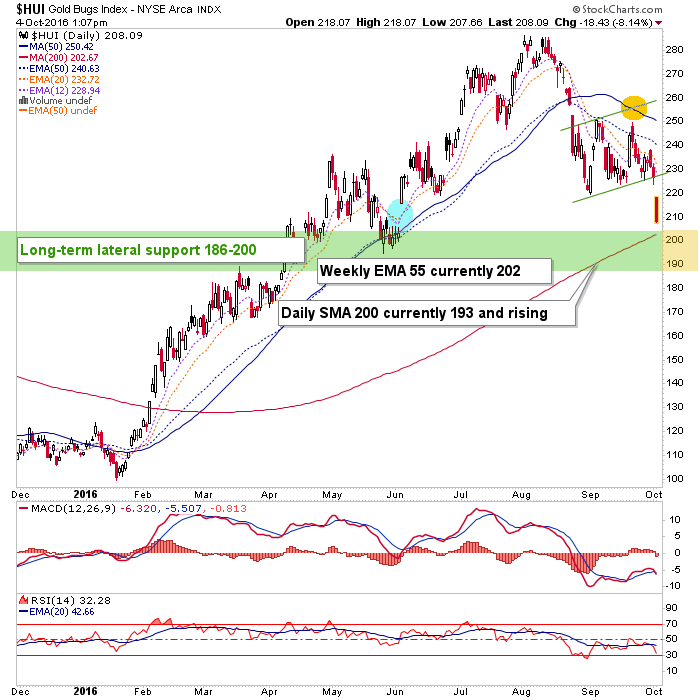
Please reference (and pardon the promotional tone of) the previous post, which updates HUI’s current situation. Here is a simple chart from the post showing HUI at the logical pullback zone we have been anticipating. There is no need to make a big deal about this because we have had it foremost on radar for many weeks now. There is a convergence of support in the HUI 180 to 200. I’ve stretched the original zone down to 180 or just below because there is a gap down there.

Here’s the daily chart, giving more detail.
I guess the main thing I want to stress now is patience. But looking at my own Premier Gold (PG.to) for example, it’s a falling knife right now. One day, this will turn out to have been a gift if the sector’s fundamentals do not fall apart. I’ve held 3 items, PG.to, KLDX and SAM.to. They are all getting clubbed and that’s fine. I am at the positioning that I can be comfortable with (very light) because I have positive views on these items and a reasonable view on the sector.
Other items are crashing down as well. It is time to be paying attention if you are an investor with fundamental conviction. You are going to be told repeatedly (now that the market is backing the view) that gold is done for (there are people who obsess on gold from a negative angle as well). While there are some things in the fundamentals I don’t love, the case for inflation continues apace and that would eventually be an underpinning. But all due caveats about not obsessing on the gold sector would also apply, especially if the gold breakdown vs. the stock market is not a quick thing, subject to reversal, as it was was earlier in the year when the ratio of gold to SPX (GLD-SPY) broke down briefly.

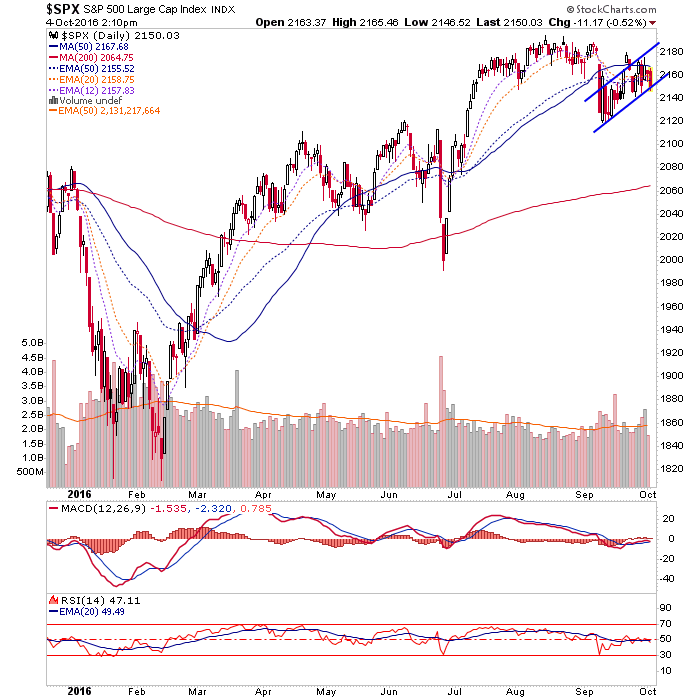
Which leads us to the stock market. I continue to see SPX as being in some sort of a bear flag, which has not broken down. What I don’t like is the proximity below the 50 day averages.
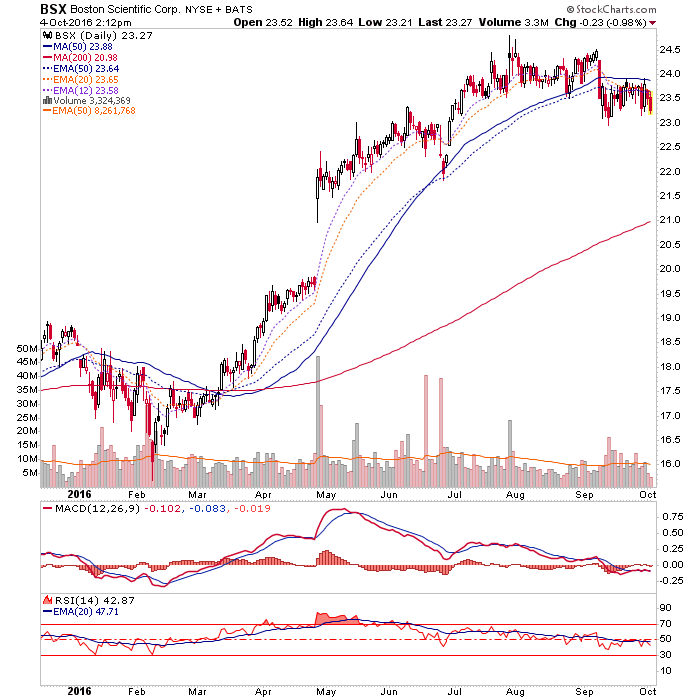
It’s not just SPX either. Several indexes and stocks are in a similar situation. Here is an individual item with a bad daily chart; none other than former NFTRH+ bull stock BSX. This is an ugly pattern (and I’ve shorted the stock). Recall we have been continually noting that the Medical Device sector is over bought and no longer of interest. I’d like to see a resumed market correction cure that issue.
I have so many forming thoughts, but it is best to put them in an update that is not done during a crazy trading day. I’ll try to get a more sensible narrative going tonight, tomorrow or on Thursday. But I want to leave you with this interesting picture, which is right in line with recent analysis about a potential inflationary phase. TIP-TLT is breaking the trend line to the upside today. I would not fall for the deflationary hysteria that could whip up amid Brexit2, Deutsche, etc.

It appears time to begin looking for buying opportunities in the precious metals, commodities and other items that would do well in an inflationary environment. Patience, as always however. I will also keep the view in play that sees a potential pullback in SPX to 2100 +/-, potentially down to the 200 day MA (currently 2064).