Here is the (weekly) Russell 2000 chart we used in 2015 to show that a moving average cross and a similar looking pattern have occurred that resulted in severe downside in 2008. I think we can disqualify the 2011 ‘comp’ because that moving average cross was quickly reversed and the current one, despite the big rally, is nowhere near being undone.
The right side of the pattern ground up and down in 2008 before the plunge but this one dropped and popped with much more dynamism. Back in February, when projecting a bounce we noted that a rise to 1100 to 1150 would likely be a good shorting opportunity (for those who like to ‘play’ as opposed to manage risk in cash).

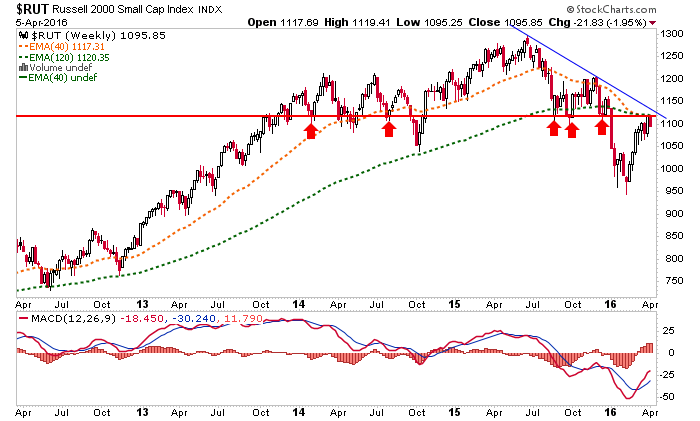
If things go according to plan, RUT could work its way down to the low 900’s. Here is another weekly chart, showing stiff resistance with a fledgling cross (down) of two other (slower) moving averages that had acted as support and now as resistance.
One could short IWM or another small cap ETF or a leveraged bear fund as the vehicle, or use put options. For me, a straight short works best. No leverage.
Sell Short Target: 1100-1120
Buy to Cover: 950
Stop Loss: Above 1120 (and the EMA 120) to suit risk tolerance but I would be careful about letting it get above the blue trend line at 1140+.
A reminder that chart based NFTRH+ updates are technical trade setup ideas, which may not be revisited as the buy, sell, stop parameters are already noted. They are meant as a starting point for further research if interested. I will not personally buy every item highlighted and will sometimes sell – without prior notice (because this takes time and resource away from NFTRH’s main functions) – any item that I do buy, below target, which is something I often do as a trader. Also please be aware that I am not a fundamental stock analyst. Due diligence is your responsibility.