S&P 500
If today follows through with more downside, the bounce scenario would be in trouble. [Note: When I began the update, futures were down handily, and at its completion, they are up handily. The update is as it was, when the futures were negative]. Using SPX as the example, consider 1867 as the key ‘do or die’ level on a daily close. As it stands now, bulls are being challenged, but the bounce, such as it is, is not broken down.

This gets to some points in the weekend report. Specifically that VIX and the Equity Put/Call ratio got jammed right back down to moderate levels by the 3 day burst that was the Hammer candle reversal and 2 positive follow-on days. That was not bullish, as it showed anxiety was quick to find relief. But yesterday’s downside may have been the response to that caveat.
What do I think? Well, I think that given the sentiment extreme a bounce should last longer and go higher. But I am not paid to think so much as I am paid to interpret. If SPX drops below 1867 and closes any day that way, the market would be in short-term trouble. As stated often, it is already in trouble in its trend, which is bearish.
As noted at Biiwii yesterday morning, I did some profit taking as the market came out of the gate wobbly. I still hold a sizable chunk of SPY and I sure as shootin’ still hold short positions in relatively weak items against it. The bounce, if it resumes, is indicated to be an opportunity to sell/re-short as its primary function. Playing the bounce long is secondary.
Precious Metals
As for gold, we have mostly used weekly charts to show a bear market and any bounce within that as just a bounce. In NFTRH 377 we dialed in to some specifics.
We have noted all along that they are in bear markets by the simplified weekly charts we usually review. The dailies put some perspective on a would-be bounce. Not until gold exceeds its SMA 200 and then the top channel line will it be indicated to be in anything more than a bounce.
Here is the updated view of that daily chart in order to keep perspective, because with the stock market having major issues, you just know that certain gold-centric analysts are at the ready to pump gold bugs up. A bull cycle is not indicated until gold makes a higher high to October, above 1192.

I am not saying a bull cycle is not in the making. I am saying that it is far from being confirmed in any reasonable way. Here is the view of the short-term pattern that may have people a little excited. This is live as of 6:40 US Eastern time.

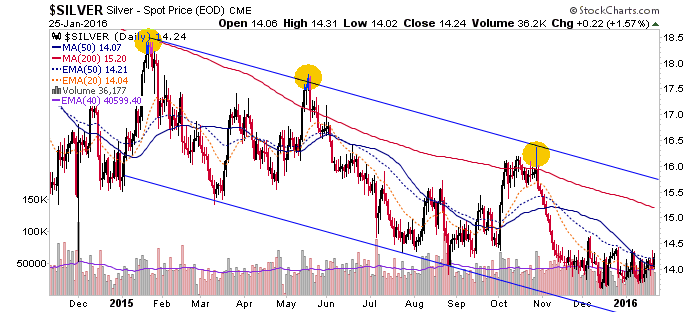
Silver is much the same way. Here is the chart from #377. There is a long way to the channel top and silver could bounce that high. But a higher high to October would be needed to break the trend.
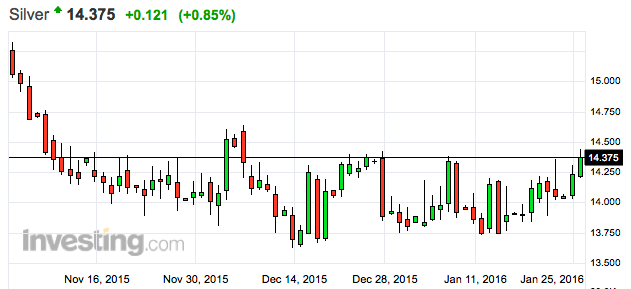
Here is silver’s nice little pattern, up to the moment.
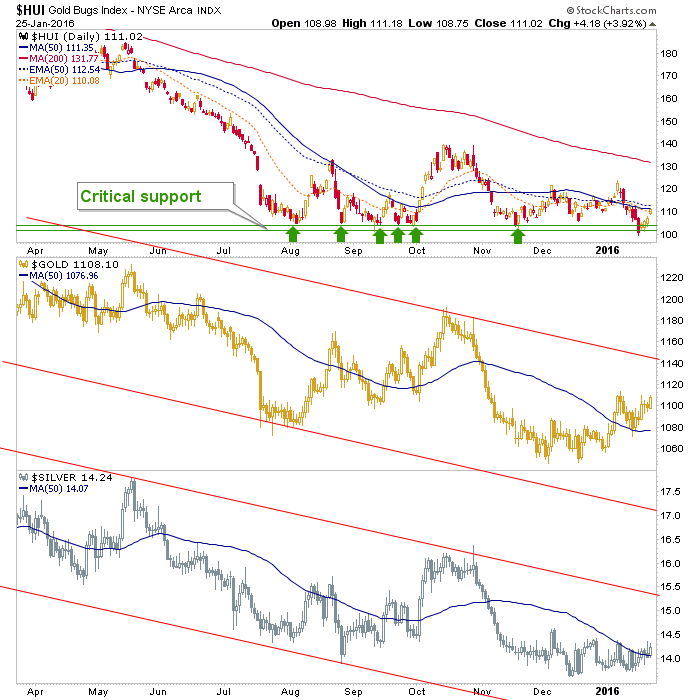
Here is a daily chart of HUI from NFTRH 374. It includes the gold and silver downtrend channels and for HUI, a critical support zone that is still intact. After making a bear trap whipsaw, the index of course bounced just to put max confusion into everybody.
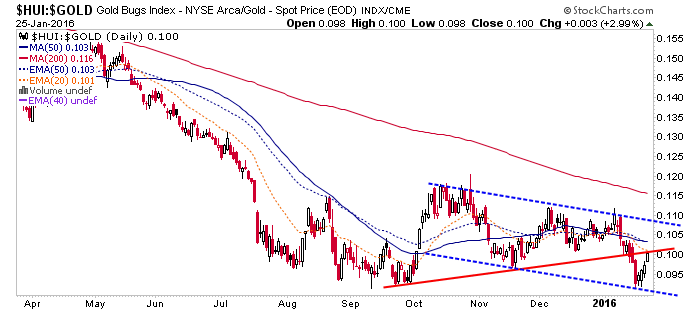
HUI-Gold ratio, which gold bugs would like to see in an uptrend is not only not in an uptrend as it exists in a downtrend channel from October, but it is also still below a breakdown line, which we noted by a weekly chart in NFTRH 379.
Can the sector continue to bounce? Yes, sure. But the above pictures show it as just that, a bounce. On the plus side, the process that global (and now, US) stock markets are going through is likely to one day prove positive for the gold sector because it is counter-cyclical stuff. We have been following the 1999 to 2001 cyclical turn as a guide and we are still in that process. We have used busier charts in gauging the 1999-2001 ‘comp’, but here is a simple, clearer one. Let’s just not put the cart before the horse.
