We have been following gentle downtrend channels like this one in SPY on the SPX and Dow for weeks now, along with a sideways channel on NDX. Subscribers were well prepared for yesterday’s drop to the channel bottoms and what I think could be a bounce attempt per support noted on this chart.
MACD and RSI are weak, the trend is down, STO has probably not bottomed after crossing below 80 and OBV is very weak. I think we bounce, but those with bearish conviction will be looking at the moving average cluster (which would fill the gap) or as an extreme, the channel top as limiters.

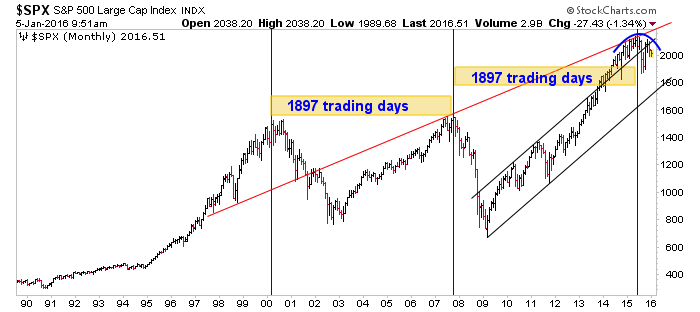
We have been noting the “dunce” cap on SPX head (blue) for months now. Also, this chart is my representation of cycle analysis that I bought (for NFTRH’s purposes) from Peter Eliades that seems to have nailed a top of some kind. We reviewed this months ago as well.
Finally, here is a broader view of the US market using a weekly chart. We have kept this front and center as well. Does this look healthy to you?

I expect a bounce but the intermediate trend is heading to bearish now. A loss of support per the SPY chart above would pretty much seal that deal.
Subscribe to NFTRH Premium for your 25-35 page weekly report, interim updates and NFTRH+ chart and trade ideas or the free eLetter for an introduction to our work. Or simply keep up to date with plenty of public content at NFTRH.com and Biiwii.com. Also, you can follow via Twitter @BiiwiiNFTRH.