The summer correction came and it lasted exactly one day!
Well, that is hyperbole because what really happened was that a market that was sagging and losing momentum was shoved downward in one great, noise-filled plunge as some indexes reached initial support targets that we were noting.
This is not a correction; it is a reaction. Now comes the important part, as the inevitable bounce plays out. What it does from here will determine whether or not we get a proper summer correction.
In NFTRH 349, we used weekly charts for US indexes. Today let’s dial in to the dailies, beginning with market leaders.
From #349: “Biotech index double topped just above 4300. Initial support is the shaded zone from 4050 to 4150. EMA 15 has contained many previous reactions. It is currently 4058. A serious breakdown would only be indicated with a loss of the April 30 low of 3728.”
BTK can bounce to anywhere below the June and March highs and keep a correction scenario alive. What the bulls have going is a still okay looking pattern and a little gap filled to boot (though there is another around 3900 from early May).

Also from #349: “SOX is near a moving average that has supported the last 2 mini corrections in 2015.” That weekly MA was at 685. The daily shows that the MA 200 has been tested and SOX maintains a higher low to March. This qualifies as an actual correction that could be completed, although per the weekly chart in #349 it can drop to below 640 and still be in its cyclical bull market.

Russell 2000 could drop lower to a higher high from early May. NFTRH 349 by weekly chart: “If a summer correction comes about, 1220 or thereabouts is a buying opportunity (with support used as a ‘stop loss’).” But this reaction really took the top off of the momentum, and we need to watch to see what the bounce does. Under normal circumstances (i.e. no acute Greece hype with a side of Puerto Rico, China, etc.) this would qualify as a candidate to resume its uptrend with a test of the MA 50’s.

By weekly chart we noted “Bank index continues to target 85, assuming that our projection for 3.6% to 3.7% interest rates (30 year T Bond) is accurate. In that case, a decline toward 75 would be a buying opportunity if the summer correction/shakeout theme comes into play.”
Well, it has declined toward 75 alright. This has been on a shakeout. A correction could drive it toward 73. A continued rise in long-term interest rates and a ZIRP-eternity inclined Fed would play a big role here. If you like the interest rate story and you like the banks, you are preparing to buy if you have not started to already.

Finally, SPX bounced right to a well defined resistance area, which is a neckline of sorts to an ugly looking pattern. Typical of bounces like this, it may not obediently stop right there. If it dawns on the bulls that Greece was little to be concerned about, and if momentum starts coming back, they could take things further than you might think. Let’s watch the MA 50’s at around 2100. This is a lousy looking chart however and leaves open the chance that post-bounce, an actual correction can get going.

As for global stock markets, I am not yet sure what to make of Europe (amidst the noise), so I have left it alone for now. Again, I have no burning need to be on this trade so if I don’t get STOXX (using HEDJ) at closer to 3200, I may or may not participate. It has hit the top end of the 3200 to 3400 buy range.

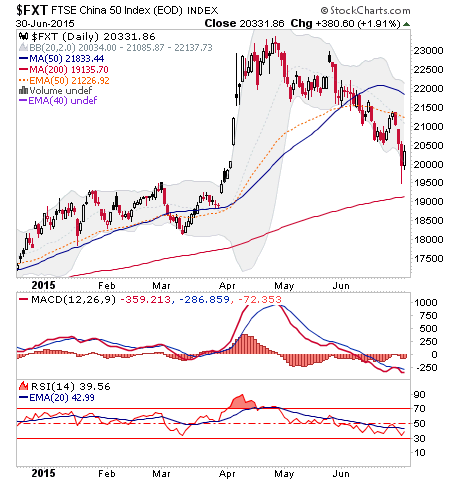
China 25 got extremely close to the buy zone (for China bulls, a subject about which I am neutral at best). It can drop further, but China bulls should be on alert here. A drop much lower than 19,000 might be unrealistic.
Over in the precious metals well, things are on plan, ugly though the plan might be. The metals, indexes and ETFs have been bearish and are getting more bearish still. I also think this has a chance to be a final drive to find a bottom (and the potential for the broad stock markets to find a top). So the theme remains that this stuff is bearish, but that people looking to buy for the next big multi-month or multi-year trend trade should be awaiting opportunity.
When HUI lost 170 (and the SMA 50) in May, it conclusively went bearish again. When it lost 160, it broke the last ditch support parameter. Now it is below 150 again. What is of concern is that while it is over sold, it is not yet extremely so.

The weekly chart is about as ugly as a chart can get. What’s more, RSI is not nearly as over sold as the last 2 instances.

HUI monthly continues to show positive divergence by MACD and RSI and as this continues, it paints the decline as an opportunity to position for a new bull market. I have marked the chart up with the old H&S and ‘370 neckline’ we used to manage in 2012. Its measurement approaches 100.

I see this chart and I feel very greedy. I also feel very patient. It is still technically fighting to hold 2008’s support at ‘around 150’, but this is not a situation you want to get caught gambling on.
Bottom Line
US Stock markets are bouncing, with the nature of the bounce to determine whether this summer is merely a ‘reaction’ or we will get an actual correction.
Global markets (well, Europe and China) are approaching would-be ‘buy’ levels for the proposed macro trade setups we have been noting.
Senior gold stocks (as measured by HUI) are in technical damage city, and very possibly approaching the bear market’s resolution.