Rather than do a full ETF report in the midst of the low volume Santa backdrop, I thought I’d wrap up a few thoughts on the market’s current status, go over a couple charts of individual companies and then hit only the most relevant ETF’s.
Then I’ll probably fade toward radio silence mode heading into Christmas. I want to again wish you and yours the happiest holiday season. It is a time to relax, recharge… and get perspective on the markets too.
Market Notes
To review, a trade was completed (using the S&P 500 for reference) that was short the SPY to the lows (per NFTRH+) and then long the snap back (via big tech captains INTC, MSFT and AAPL), which we also projected (Santa). The broad US market remains at a decision point, but is bullish on the short-term.
Though an interesting condition continues to exist in that none of the first 3 indexes shown below have yet turned their daily AROON trends up (they are within a hair). However, item #4, the Russell 2000 has had relative strength and has turned its AROON up on this rally. That would be in line with the seasonal ‘Small Cap’ theme (post-tax loss, heading into ‘January effect’ season).

As such, my personal focus is going to be to trade the small cap area and in particular, the beaten down potential bottom charts that are both small caps and ‘January effect’ candidates, until the big market clears its direction (breakout and hold new highs, consolidate or correct?) .
It was noted that SGI, SIMO and DAKT are still held while the big tech was sold. These 3 (plus OMED, traded out and back in) are small cap stocks. As for a would-be January play, the speculative biotech small cap below has the kind of chart I am looking for.
Holders of this stock saw nothing but losses in 2014 and 3 trading days ago the stock moved above its SMA 50 (tested yesterday) for the first time since August. The right side thumbnail gives a clear view, including RSI now above 50. I do not own it, but am taking a look and presenting it here only as an example of what a ‘January effect’ candidate might look like.

Let’s update the latest NFTRH+ idea, DAKT, as posted on Dec. 18. Since the update DAKT has broken above visual resistance and is at the moving averages, which can also be considered resistance. This was also noted as a potential ‘tax loss’ seasonal stock and a weekly chart was provided showing significant additional upward potential, all other things being equal. So far, so good. DAKT’s immediate mission is to clear and hold above the MA’s.

Bottom Line
Santa is still in play. But speaking personally, I am going to be looking ahead the 2nd half of the plan, which was ‘tax loss’ / ‘January effect’ seasonals with small caps as a focus. Market willing of course.
KEY ETF’s
To go along with the US market items noted above, we add momentum leader IBB (Biotech). This has been in a strong up trend since the Spring, when the bio’s got whacked. Here we reference the weekly BTK chart (reviewed each week in NFTRH) with its upward curved slope. Yesterday, IBB dropped to test the middle Bollinger and EMA 10. It is still fine.

SMH advises that the other momo leader, the Semi’s are bullish and not over bought by RSI, although they are getting ‘too far’ above the SMA 50 again.

XLE has bounced hard and is trying to turn former resistance into support.

EZU got back above the trend line and SMA 50.

FXI is back above resistance, now support. Recall it’s weekly chart is good if this daily support continues to hold.

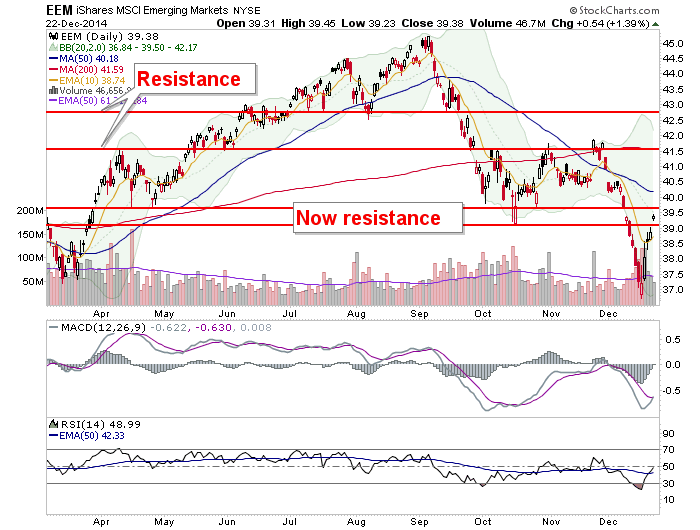
EEM is bouncing into the resistance zone. Still bearish below it and the SMA 50.
USO is still clustering at a deeply over sold point. A higher high to last Friday’s up candle would be a positive sign for a bounce. A lower low to Thursday’s down candle would be very negative.

URA is still constructive for a bottom of some kind. Below 11 is a stop loss on that idea.

PALL is giving resistance another try. The more times resistance is attacked, the weaker it becomes… so the story goes.

GLD remains bearish and yesterday it got more so, in losing support.

GLD vs. SPY was also bearish and yesterday got more bearish. This is an important indicator; at least as important as any other for the gold sector in my opinion.

SLV is back to critical support. Above we noted the more times something tests resistance the weaker that resistance becomes. Well, here is an example in reverse when talking of support.

GDX is also on the third bottom retest express. That is not a good thing.

Bottom Line
The US stock market is probably going to be volatile as we get into the new year, because the downs and ups to end 2014 have been very volatile (from October) and that seems likely to continue. But as we have noted repeatedly, the bull has the ball and he is supported aggressively by policy makers. My plan will be to trade the swings short and long after we deal with ‘January effect’ season.
Europe looks interesting and so does the China 25. Emerging is just bouncing as of now. Canada (not shown this week) should be tied to the energy complex and Japan is doing the opposite of the Yen.
Commodities and precious metals are just flat out terrible. The latter is expected to provide a contrarian opportunity that could be epic, to use a ridiculous word for a bombed out sector. But we cannot paint our desires into the analysis. When the macro is ready to turn we will build the case and be strong bulls.
But as the year-end, forward looking macro data we have reviewed states, the macro appears not quite ready to turn yet. The moment we get real indications, we will note it.