Here is this morning’s pre-market NFTRH subscriber update reproduced publicly, with my compliments for anyone interested. I did not want people to fall for yesterday’s bounce in the gold sector.
We are going to manage this crash as we did the one in 2008 to great success. This one is a different and much more extended animal, but it has finally shown its cards, potentially opening up the terminal phase…
Gold stocks very logically bounced from the equivalent of HUI 152, which is support from 2008 and the 2002-2003 period as we noted in NFTRH 315.
When dealing with these types of support and resistance situations, you’ll note I sometimes write something like “it was always going to bounce there” or “it was always going to stop there”. Well, HUI was always going to pause and try to bounce from 150. I have to believe it is the result of man and machine taking this obvious technical level into account on a mass scale.
But when taking a bear market bottom into account, we need more than a bounce at support. Let’s look at some of the things needed to describe this as anything more than a bear market bounce and for those who play both ways, a shorting opportunity.
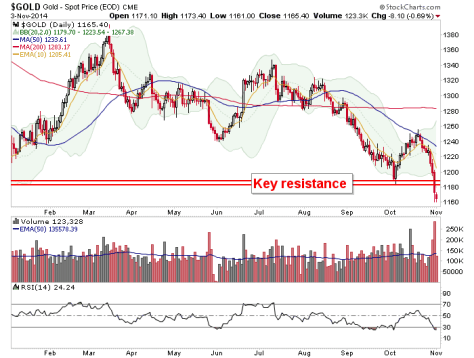
Let’s begin with gold, which we noted must prove that Friday’s drop below critical support was a false breakdown if there is to be any talk of a capitulation and big rally in the sector as a whole. Gold is up 7 bucks to around 1172 in pre-market. Okay fine, but talk to me when you’re above resistance. Until then, it is breakdown mode.
Remember that the 1180 +/- level was support from June and December of 2013, as well as early October of this year. It’s critical.
I will not name names, but there is now some alarmingly bearish stuff out there, with one well known chartist having flipped from bullish hyperbole to ultra bearish hyperbole. That can’t be a bad thing. Everybody’s on the job trumpeting gold’s next stop at sub-1000, based on this technical breakdown.
That is a positive, not a negative because it would seem that nobody in their right mind could be bullish now. Yet obeying technicals has been the way to go through the whole bear market and that is what we need to continue to do. Gold must get above 1180 to mitigate talk of the lower targets (970 is our lowest).
Consider that the bounce happening now is probably a direct response to this bearish sentiment, but again, a bounce proves nothing until it nullifies broken support parameters.
Using GDX because it shows volume, we see an over sold RSI in need of relief. The volume was pretty big on Thursday and Friday, but was it true capitulation? That is debatable.
HUI dials in the technical situation for a closer view. How many little bear flags did we used to talk about during the hard down or recognition phase of the bear market in late 2012 and first half of 2013? Routinely, HUI would drop, flag and drop again.
In losing the December 2013 low HUI technically at least, opened up a door just as it opened a door in November 2012 when it lost the old ‘460 support’ parameter. After that was when all the dropping and flagging came into play.
It has only been a day of bounce, so the little flag I have drawn is just theoretical. HUI is over sold and we should watch to see if it makes an orderly upward flag to punish all of those multitudes jumping the bearish bandwagon now.
As noted above, one prominent writer was turned very bearish by Friday’s events. I for one will be interested to see what the gold “community” burps up for analysis in the coming days. If they start getting bullish again while HUI resides below resistance and/or the EMA 10 (gold line) and MA 20 (dotted center line of the Bollinger Bands) that may not only not be a time to be long, but a time for those who would, to get short.
HUI monthly walks us down memory lane, reminds us of the massive H&S (target approx 110) and also gives an example of a previous bounce (circled) that came after a key breakdown of the Neck Line at around 375. It was a kiss goodbye.
So while there is long-term support at 150, there is nothing proven here from the bullish side unless HUI gets above last December’s low of 188.39. With the damage done in October, that is now a long way up.
Bottom Line
It sounds boring but our theme for years now has been that players can play, trading long and short but for gold bugs awaiting ‘the’ big buying opportunity, it is better to wait and let the sector prove itself before any real commitment. That could involve missing the first 20% of a new bull market’s move, but we began advising that when HUI was about 65% higher than it is now.
Things are in motion now that the would-be bottoming pattern got blown up (September) and last December’s low was lost (October). HUI is either going to turn this bounce into something real or it is going to fail into what would probably be the bear’s final plunge, finally getting that big H&S off our backs.
Understand whether you are a trader, investor and either play the sector accordingly or consider just relaxing until it proves out some parameters.
Subscribe to NFTRH Premium for your 25-35 page weekly report, interim updates (including Key ETF charts) and NFTRH+ chart and trade ideas or the free eLetter for an introduction to our work. Or simply keep up to date with plenty of public content at NFTRH.com and Biiwii.com.


