
We know that for the last couple of weeks SOX is leading NDX and NDX is leading SPX. The market leadership chain is intact and bullish. But not for everybody. It’s bullish for the big MAG7/AI names and the Semiconductor companies that power them.

That’s fine. I have some big Tech and Semi. But the outer reaches of the market are suffering, including gold stocks, as we gauge the length and depth of this “internal” market correction. I remain bullish as long as these reflections of the real stock market, the average or median stock, remain intact to their bull trends despite the correction. Let’s look at a few measures.
NYSE is cracking initial support, with more important support coinciding with the rising 200 day moving average. It is also becoming oversold to the degree it was during the spring correction.

Russell 2000 (Small Cap index) is cracking initial support as well, and testing the rising SMA 200. I would not be surprised if it makes a spike down to support at 2700, however. Regardless, like the above, it’s an unbroken uptrend in a hard correction. IF the bull market remains intact, these are buy opportunity setups. IF…

While the headline SPX index is just fine, Equal Weight SPX is looking for a test of its SMA 200 and support as well. This is the US stock market, and it is in correction. Headline SPX merely paints a picture of the highest weighted stocks.

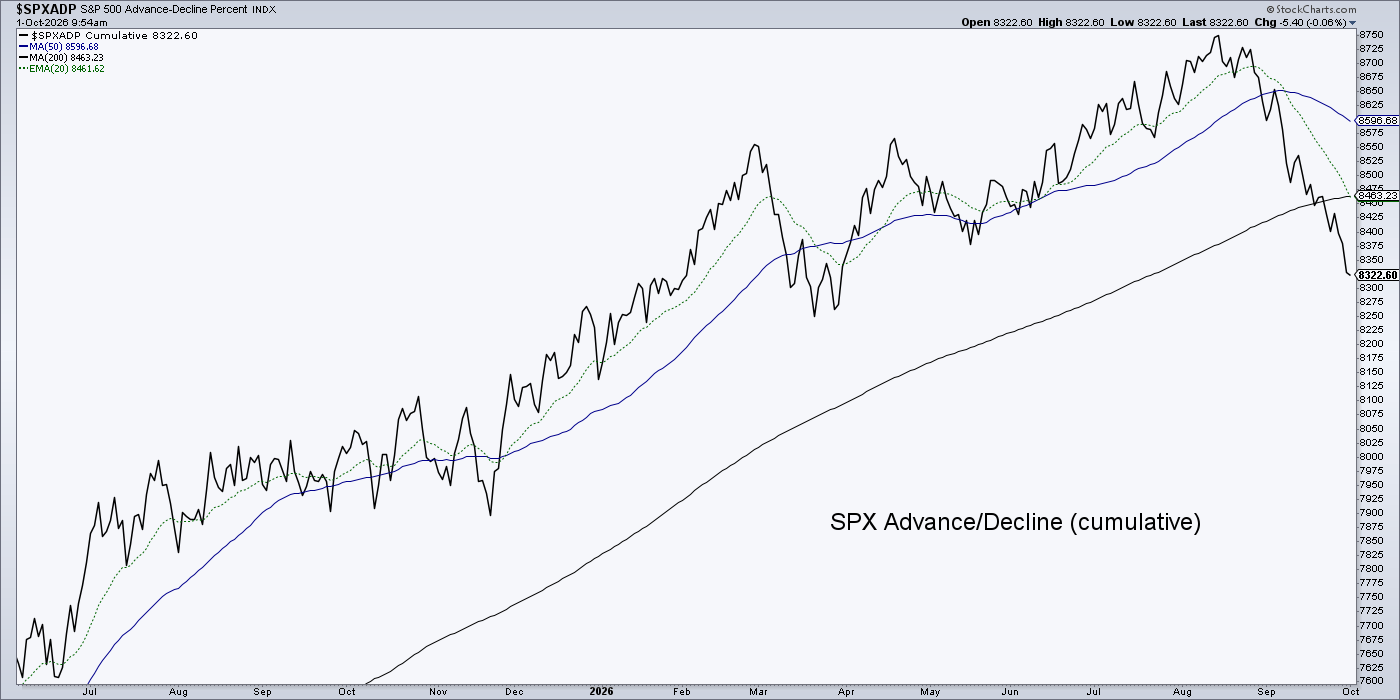
SPX A/D line is still heading south, as would be expected after reviewing the above.
Finally, the median of 1700 stocks is in a similar state to the above. Having lost the SMA 200, the key here is to make a higher low to the spring correction.
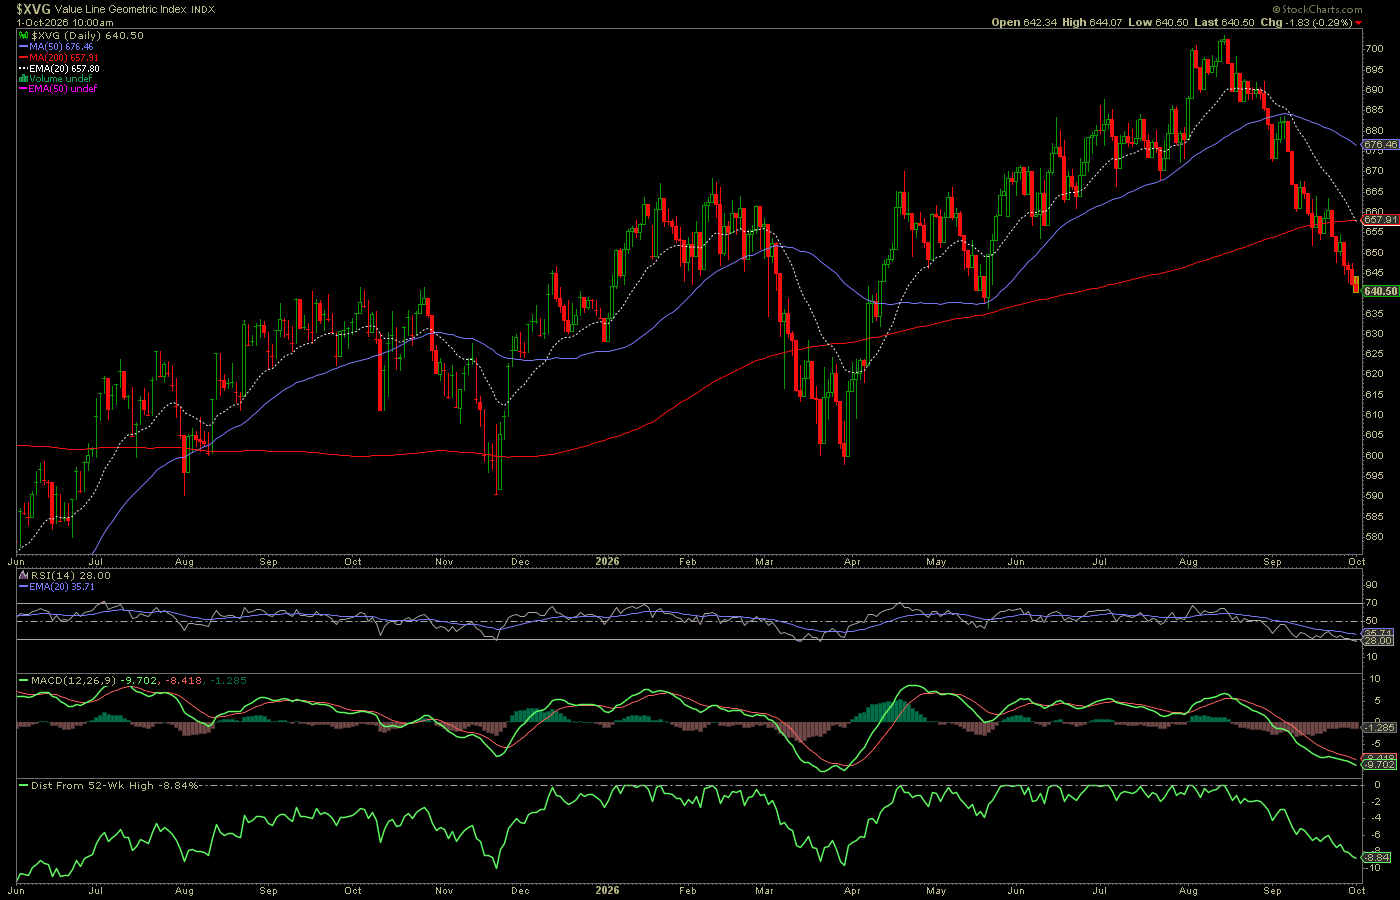
The bottom line is that the broad market is in a correction and is either presenting a buying opportunity or preparing to slide into a bear phase or bear market. Until the trends are broken, it’s a correction within a bull.
