

Summary
A brief summary of the work done in this week’s report and in the updates and reports leading up to this point. Please read the detailed report for the complete picture. There are many granular details that cannot be summarized so briefly.
Precious Metals (bull market)
The bounce/rally is still in effect. See NFTRH+ updates on HUI for details on gold stocks (Aug. 12 & Aug. 13). The favored path, for gold stocks, gold and silver is currently up > down > up (see report). But a less favored alternative is an uninterrupted broad bull (including precious metals) move through the mid-terms.
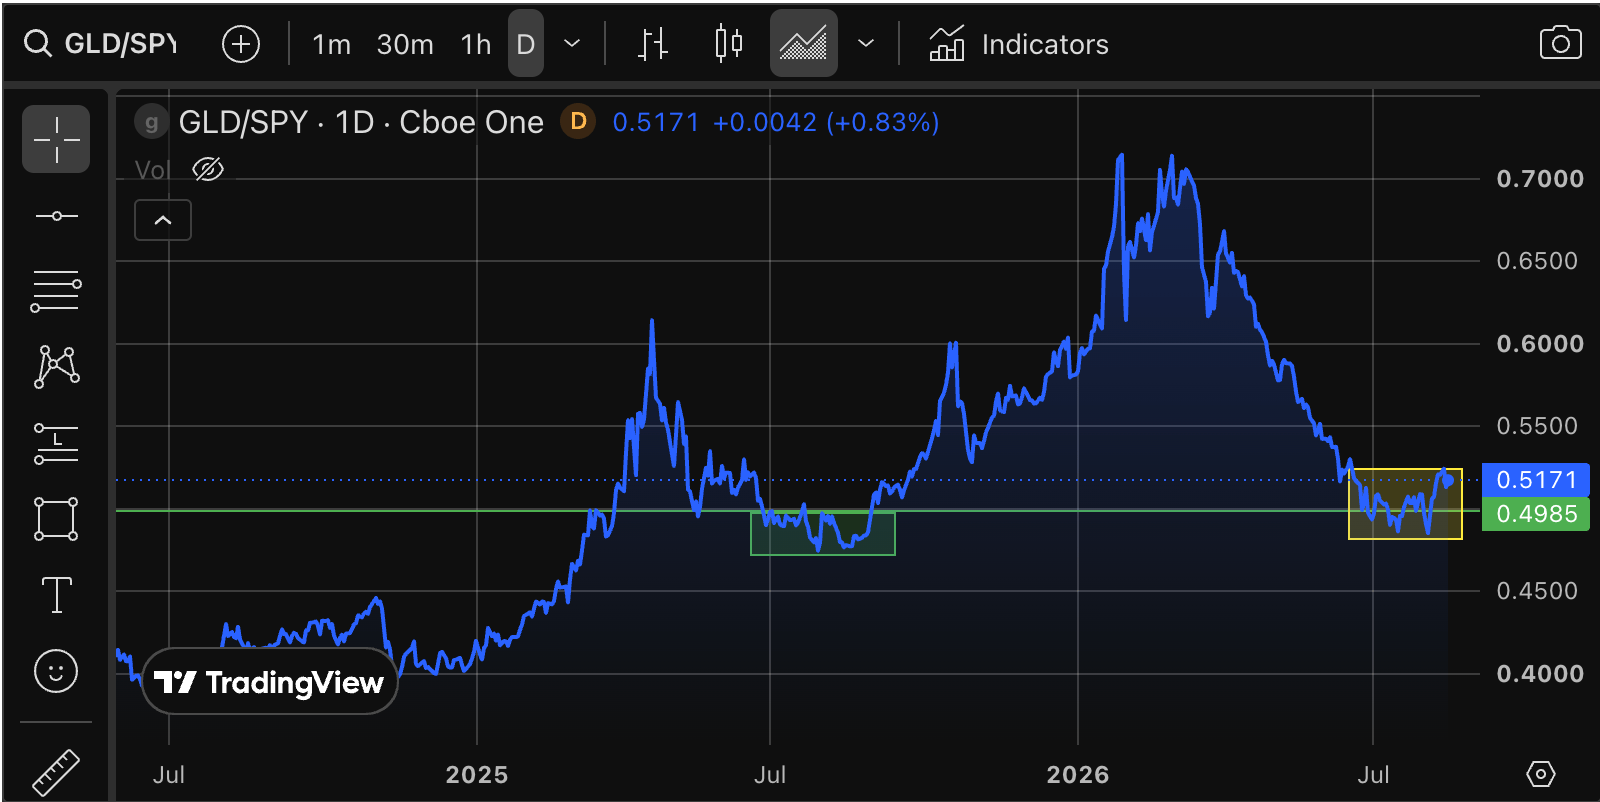
Beyond the noise of the next 3 months, this chart is key. Because if this is a real bottom in the Gold/SPX ratio, it will indicate a new phase where gold and the precious metals once again lead markets.
US Stock Market (bull market)
Bull on, dear Piggy. Bull on. Anticipating an over-bullish, over-bought top in September. Followed by a new bull phase in Q4. However, stocks would under-perform precious metals and perhaps US stocks would under-perform global stocks. The alternative and less likely view sees the thing gunned to/through the mid-terms.
Global Stock Market (bull market)
All about the USD and America’s ability to perhaps sneakily compromise it. I believe Trump is an economic dunce with little knowledge or care about the currency, debt or anything other than appearances. I also believe Bessent and Warsh are intellects capable of carrying out Trump’s wishes covertly. That’s my tin foil hat talking.
Expecting this to be reflected in an eventual global shift to out-performance vs. the US. ACWX/SPY ratio, which is currently testing support to that expectation:

L/T US Treasury Bonds (bear market)
Still no sign of a recovery in long-term Treasury bonds, proving my interim rally view wrong… or early. By that I mean a market correction post-labor day would likely be met with a rise in bonds (if market sheep herds participants lurch risk off) and an interim drop in yields. Longer-term, it’s a bear market and yields are likely to continue to rise, or resume rising after an interim rally.
Commodities/Resources (bull market)
Silver/Gold ratio has not busted out of its little constructive pattern. If precious metals remain bullish in the short-term, along with commodities and stocks, we could envision the pattern breaking upward in line with a final late summer party, bouncing commodities further. After a correction plays out, we’d see commodities as a prime performer in 2027.
US Dollar (short-term bullish, post-2008 bull market)
US Dollar (mega long-term bear market)
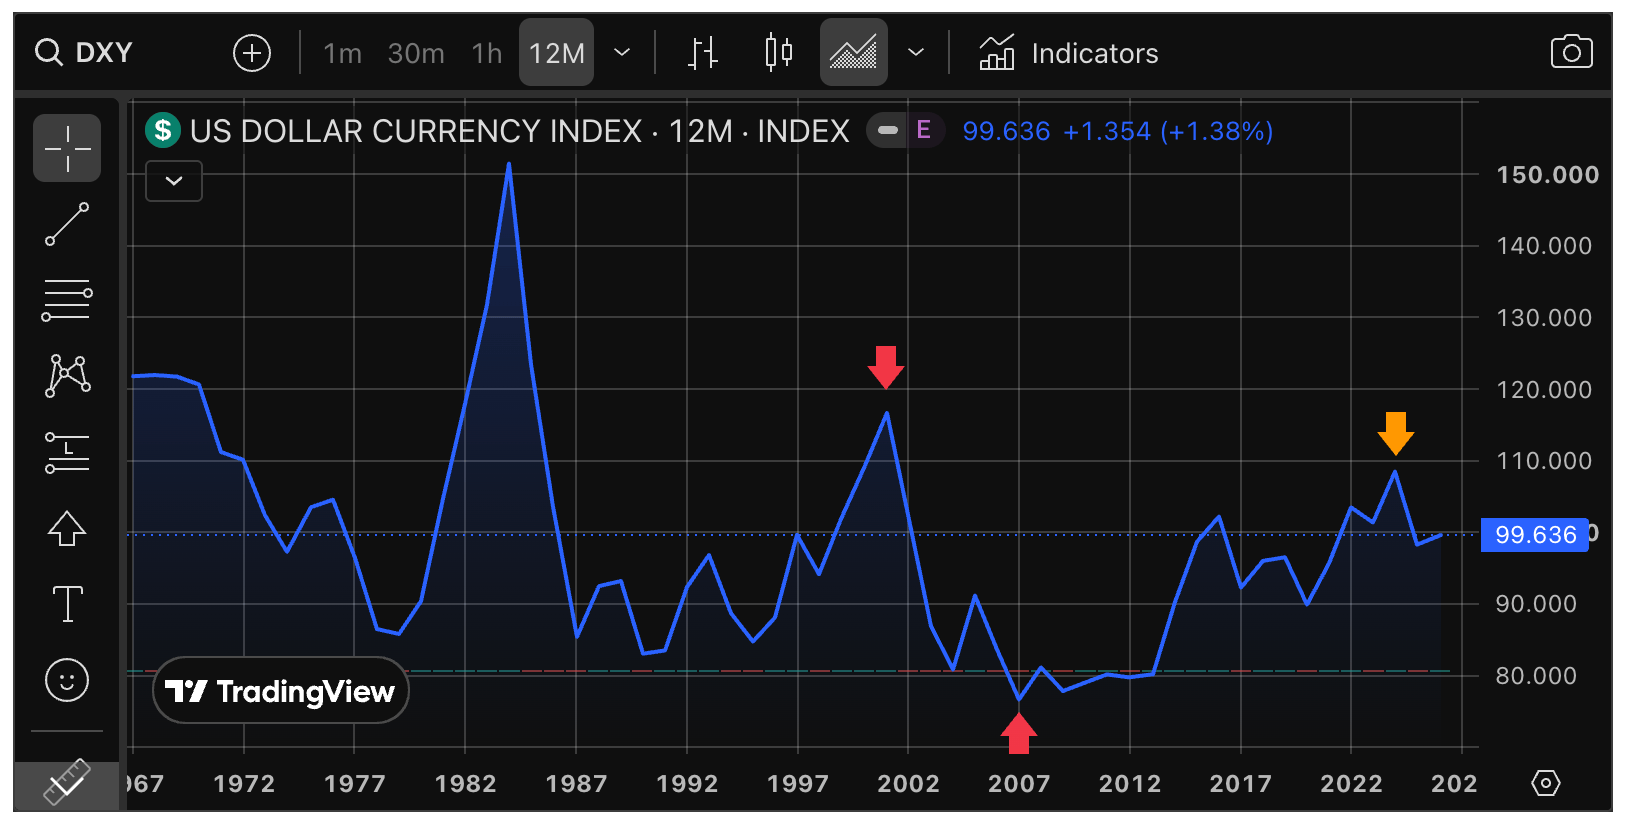
USD’s daily chart continues to wallow above its 200 day moving average. Hence, not broken. And folks, it may not break down if a broad market correction hits and casino patrons seek risk ‘off’ liquidity. A breakdown could come later, out into 2027 when Bessent/Warsh get the disinflationary cover to engage in inflationary actions.
In other words, a drop in inflation and/or economic signals along with a market correction would likely prompt policymakers to begin a new inflation regime. The very long-term is clearly a mega bear market.
Admin Note
We are finally settled in our new home and material to the service, we finally have real internet service. It was a little spooky running my business off of my phone’s hotspot. :-(
Up, Down, Up?
That is the preferred theme for broad markets, including gold stocks. Finishing up the current bull phase across many sectors, and then a pullback into or in September (possibly including a rotation back to defensive sectors, so I’m in no hurry to unload my more defensive stuff).
Then, probably out in October or November, Bull, Phase 2.
Of course, that is predicting markets based on current information and quant history (ref. SPX, VIX and mid-term election seasonals). Which is why I am a “week-to-week” guy. I’ll call it a forecast, but one that is subject to adjustment along the way.
For example, if Bessent and Warsh are at work managing liquidity into the mid-term elections, and if they are given license by easing inflation expectations, the market could just keep gunning without an appreciable interim correction. Including gold stocks.
The Fed is still buying Treasury bonds and reducing MBS, the slack for which would logically be offloaded to the commercial banking sector (post-Dodd/Frank).

But the banks have not (yet) taken up the slack with regard to the consumer.
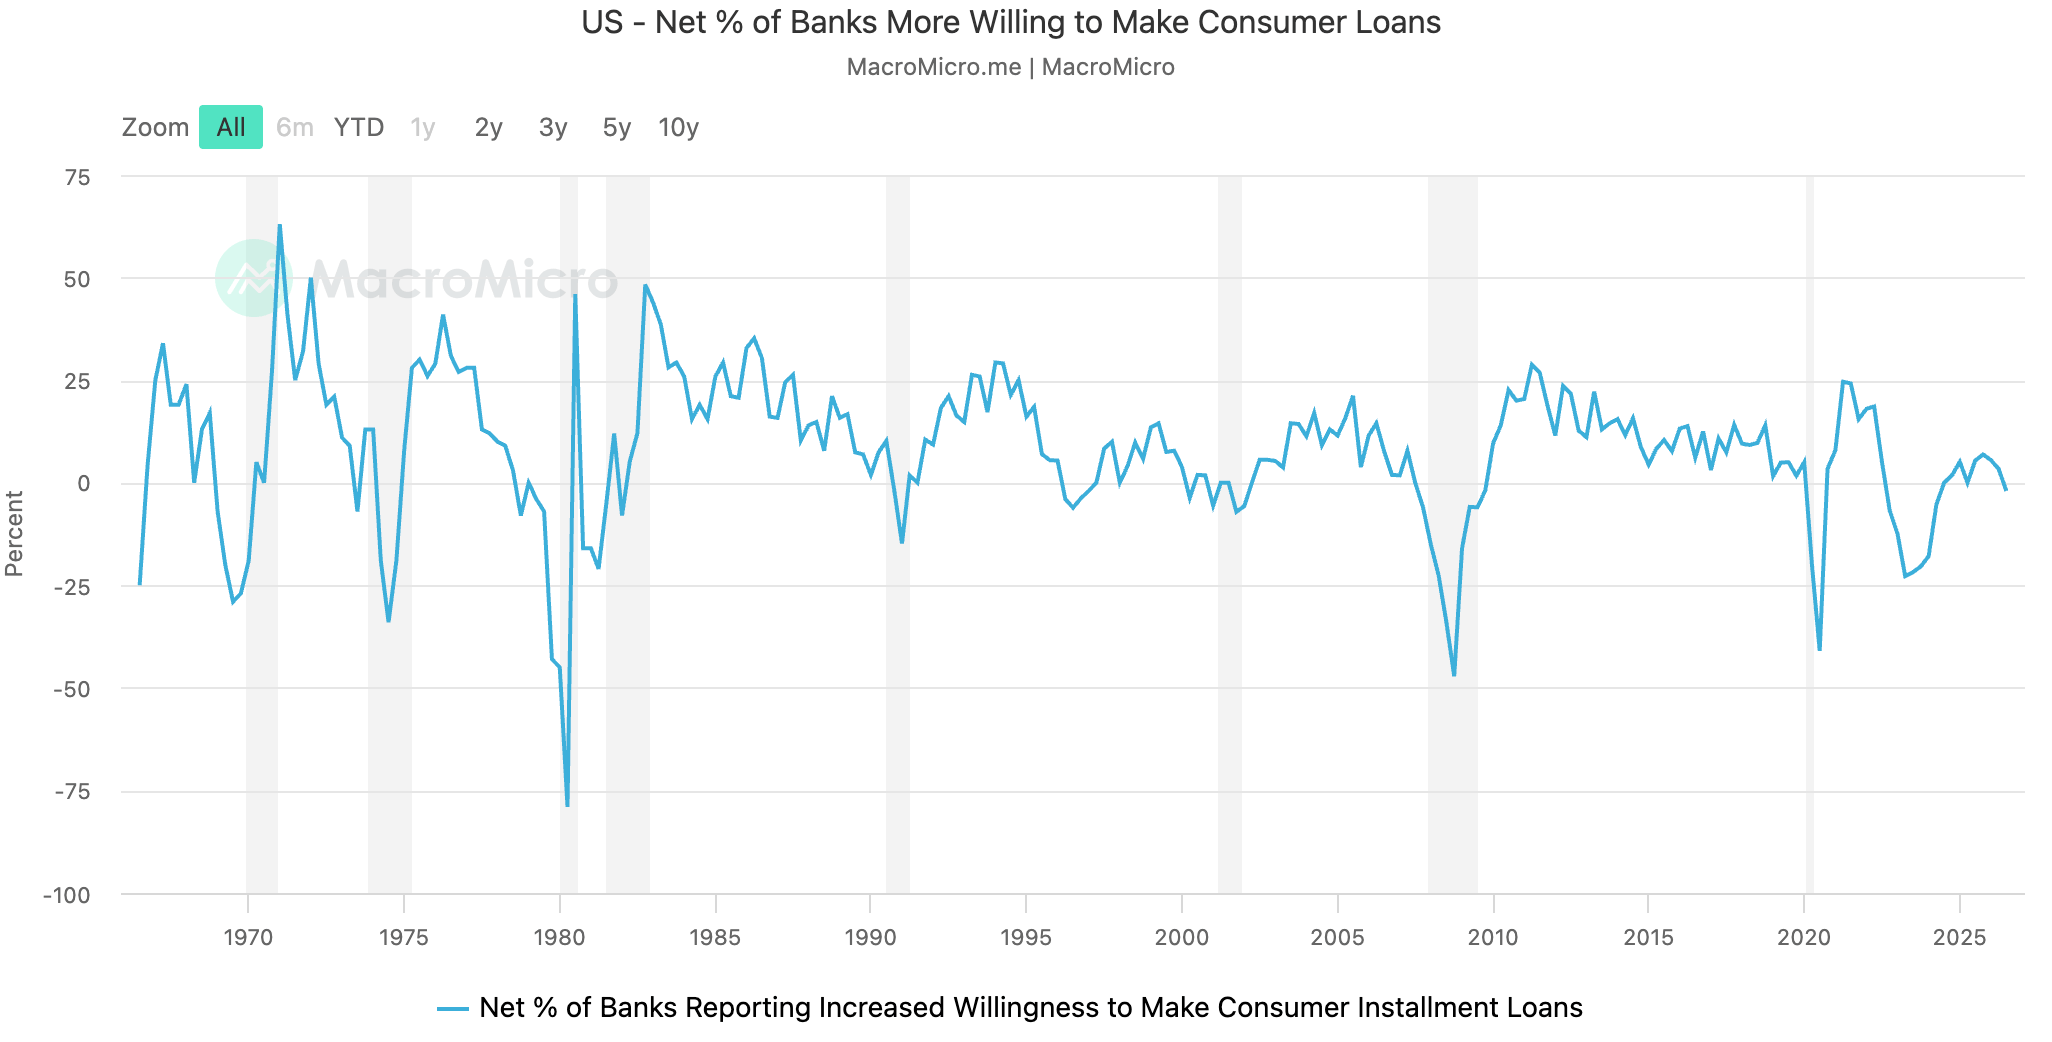
So net Fed liquidity is rising slightly, but when considering the reduced regulations on commercial banks, it’s a picture of future net liquidity creation. Today inflation fears are still elevated. What happens when policymakers are given license to create liquidity (inflate)? Bull, that’s what.
The timing is the thing. For now we’re looking Up (next couple/few weeks) > Down (September) > Up (Q4) on markets.
US Stock Market
You cannot call the amalgam known as the S&P 500 anything other than bullish. Neither the daily chart (nor the longer-term charts) gives a clear basis for target measurement. Let’s call it 7900 and with an obligatory over-shoot, to the round number of 8000 (ding ding ding!), which you can be sure Trump and/or his likely new Spokes-Robot Scott Jennings will be touting.
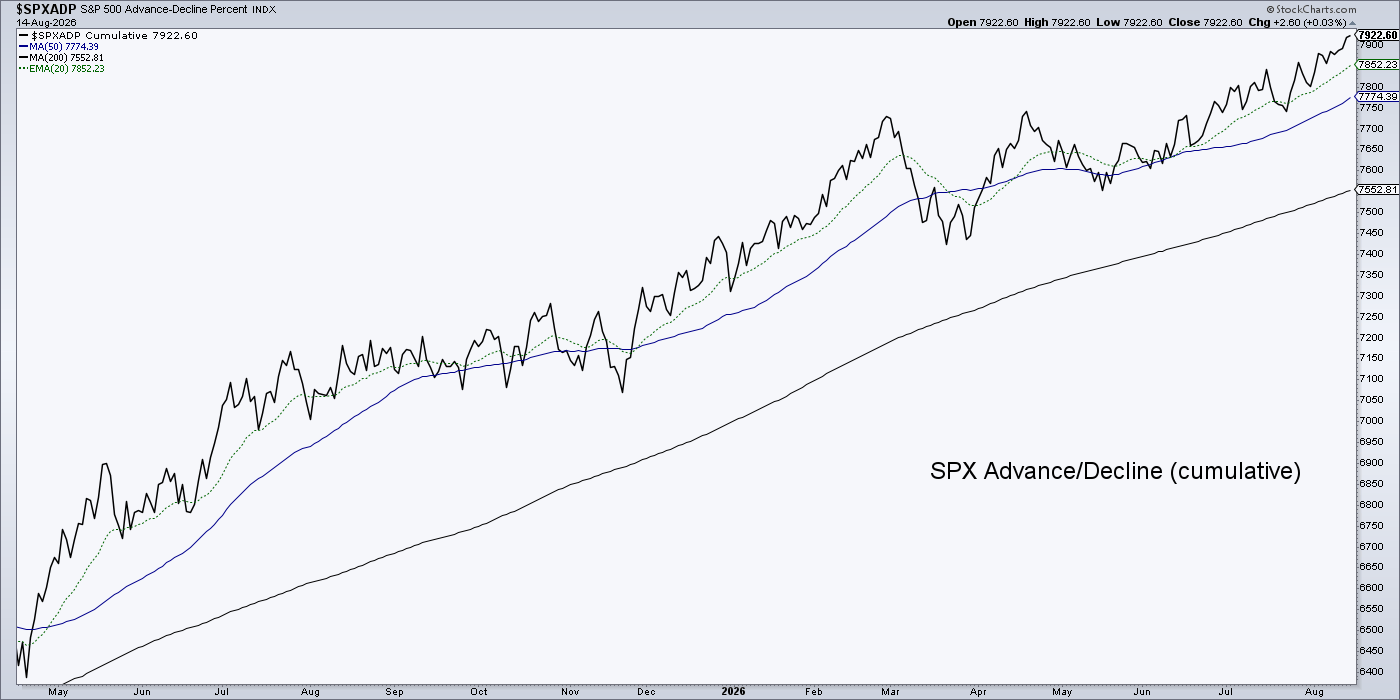
But we are more focused on time than price. If SPX tops out in an overbought, over-loved bull fest, it is set up to time out with the September time target for a correction.

As a side note, this is not an internal indicator that you’d want to fight by being short.
NDX has busted bullish after not quite pinging a 50% Fib retrace to the downside. But in retracing well over 38%, it did its corrective job. RSI looks coiled for more upside and MACD is just now going positive.

SOX, on the other hand, is relatively lame in comparison after it took well over 50% Fib pullback and lurks below the 50 day average.

The leadership chain does however show the Semi sector capable of regaining leadership over NDX. But as it stands now, it’s weak and a negative forward hint for markets. NDX is poised at resistance vs. SPX.
If NDX/SPX takes out its 50 day average it could lead a final surge into the September time frame. If it instead fails, we’re looking at a potential market correction sooner.

Now for an interesting bit of data, with respect to Semiconductors and Hyperscalers as relates to AI (thanks to subscriber BF for passing this along). From Lance Roberts, as published at TalkMarkets.
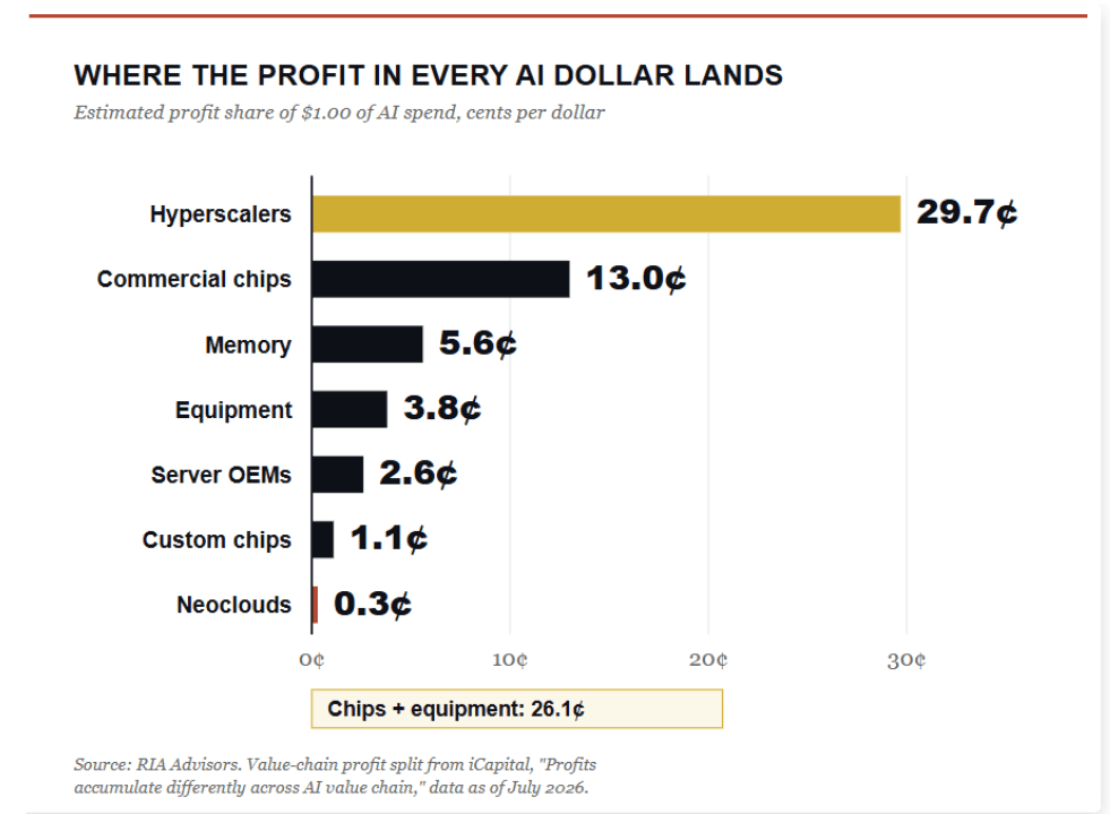
This is for consideration in the future, not necessarily for today if our view of a coming market correction is on base. The Semiconductor sector is not ‘one size fits all’, especially where AI is concerned. And as things currently stand, it looks like the ‘picks & shovels’ in Semi and Equipment are not going to be the most profitable. Competition is gathering across the spectrum.
Considering that many of these companies (I’m thinking of current holding CRDO and especially former holding ALAB) are richly (code for ‘over’) valued due to current growth, any slowing of growth is a harpoon.
While profit distribution may and probably will shift in the future due to changing dynamics, the current breakdown is a striking snapshot today. What’s more, with the recent hit to Alphabet due to its CapEx and the mini-jitters it caused, the implication is higher profits for the Hypers later, beyond the heavy CapEx cycle.
I currently hold GOOGL, AMZN and MSFT and will plan to keep META on watch as well. But they are not likely to go unscathed if the anticipated market pullback manifests.
Sectors
As you know, I am not lugging a focused portfolio into the September window. It is pretty darn diverse, including Healthcare (mostly BioPharma with some Medical Device and an Assisted Living stock). The Cannabis stocks are their own thing, and the near-term will be largely dependent upon whether or not rescheduling goes through.
I have been leaking back out of Software, with DDOG and DT the latest profit-takes. Holding only big boys NOW and MSFT at this time (and I trimmed MSFT).
I forced myself to take a few profits in precious metals stocks (and the Au/Ag bullion fund, CEF). But most are still held amid rebalancing (e.g. out of EQX and AGI, into Royalty FNV). But here we have to have distinction between someone like me (comfortable with trading/rebalancing within a portfolio, though not a day trader) and others (like those accumulating for new bull leadership implied by a bottoming Gold/SPX ratio and anticipated improvement in macro fundamentals).
As to the above, I may tweak some positions in the Roth IRA to upgrade holdings. For example, an item like MAI.V out and EQX or AGI in. That’s just an example of the kind of balance I want to maintain until such time as it’s ‘everybody out of the pool’ for a while.
After getting fairly low on cash/equiv. (for me), in the 65% range, I have started to raise cash again, while being aware of the concepts of increasing defensive positioning, short/hedging, and simple cash/equivalents paying monthly income.
Again, all of this is in anticipation of the “Up, Down, Up” plan. Leaking out of the market now (up). Being safely cashed up/hedged (down). Buying again (up).
Sentiment
Fear/Greed index is solidly on a ‘Greed’ reading. That lines up with the view that a pre-correction market top could come with a final lurch to very over-bullish and a contrarian opportunity to get defensive and mostly avoid the fallout.
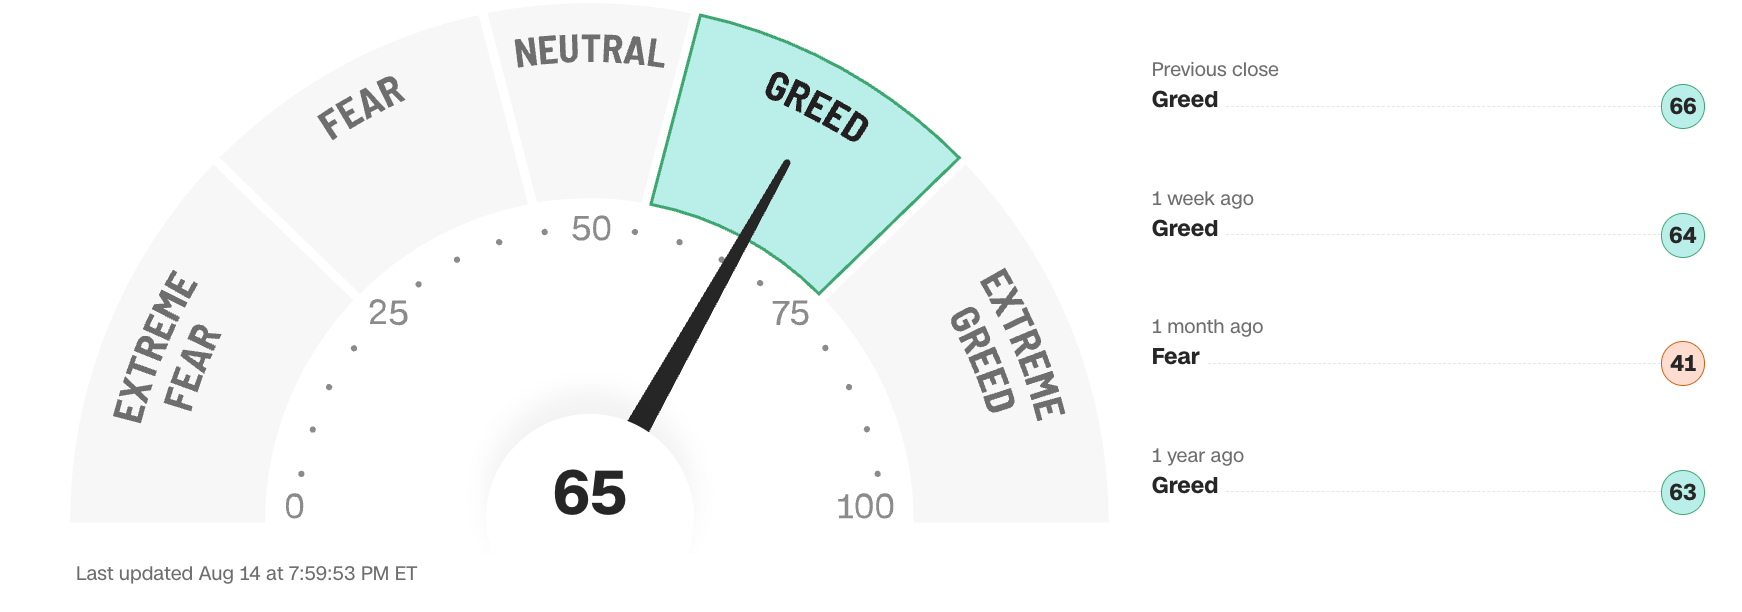
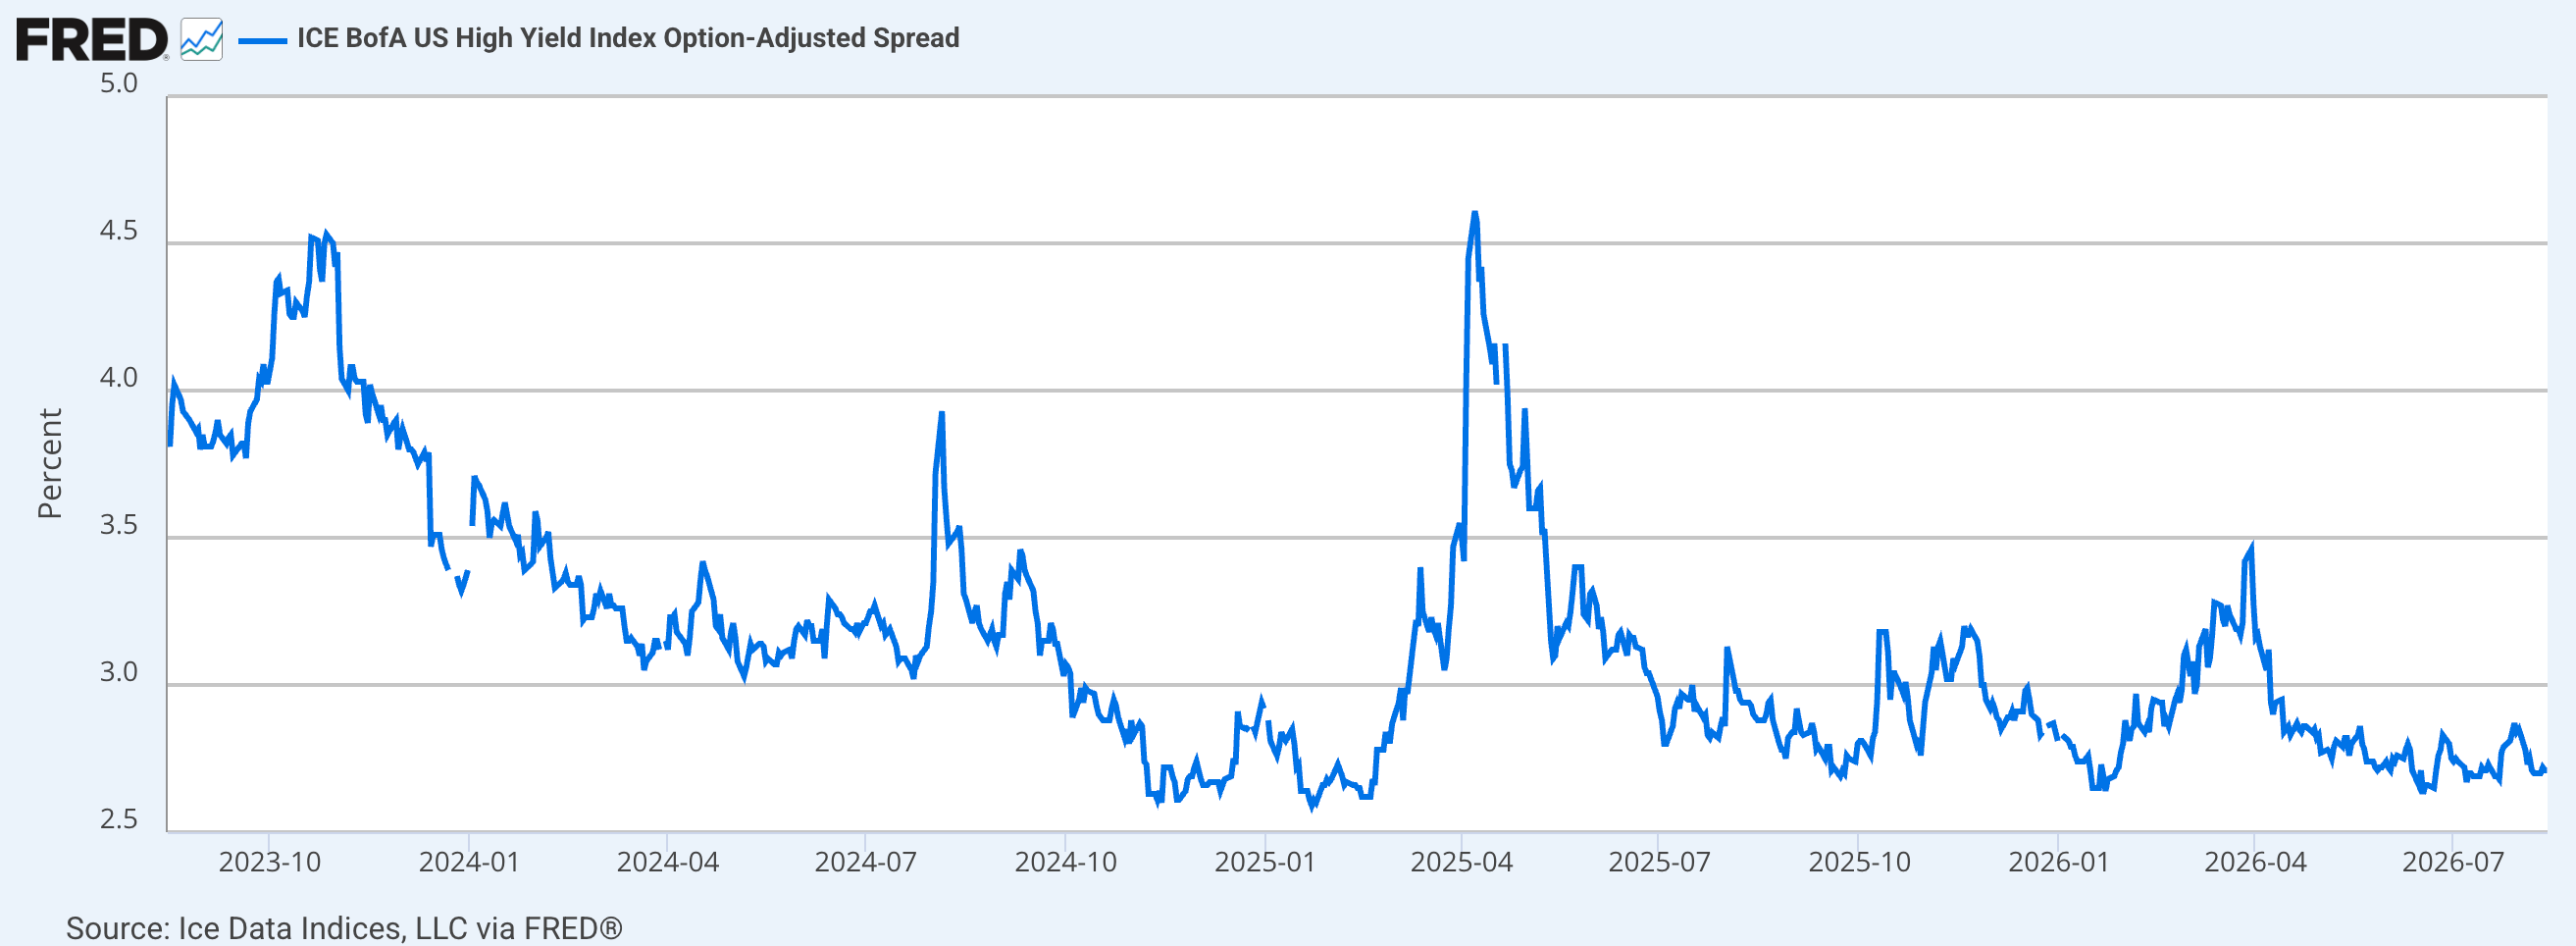
The indexes components are pretty well aligned with the summary ‘Greed’ view. That includes Junk bond spreads, which are face planted to the ground, indicating risk ‘on’ and a lack of caution…
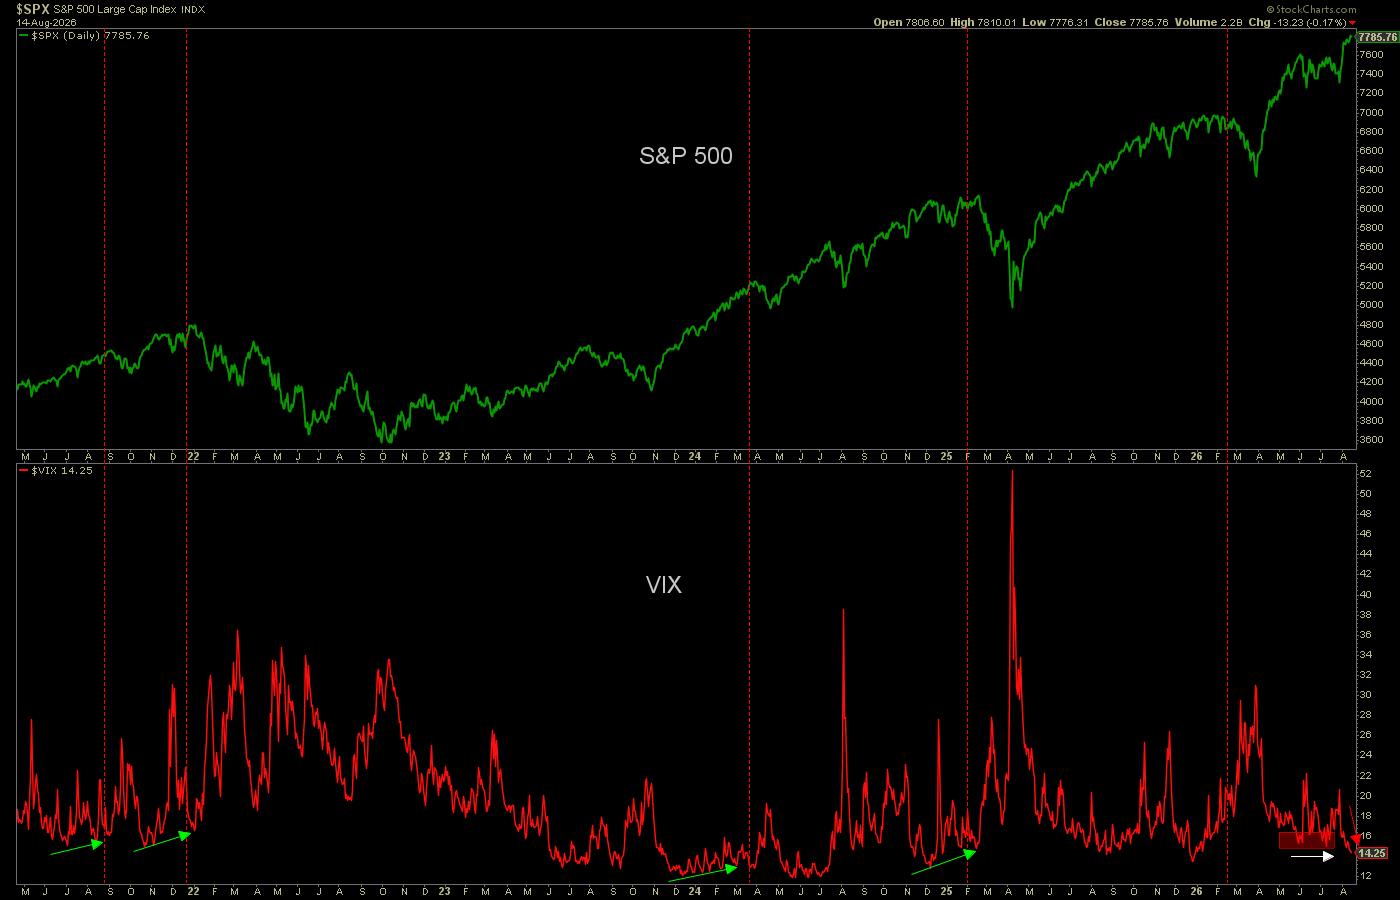
…and the VIX, which indicates very similar conditions. We are not going to get a market correction off of a VIX divergence anytime soon (ref. green arrows). But we may very well get one with VIX indicating absolute greed and no fear.
Precious Metals
Gold (daily) is dealing with it’s SMA 200 (orange), and pausing there as is to be expected. RSI could use a reset back toward its EMA 20. MACD is in positive territory.
I continue to lean toward another leg higher in the near-term. That would theoretically jerk the holdouts in because “BREAKOUT!”… a perfect time then for an interim pullback. The alternative is that the gold price pulls back from the SMA 200, which would obviously be logical. Even more so than the ‘breakout and bull trap’ scenario. But since when are highly emotional, gamed and rigged markets about logic. Eh?

Silver (daily) could perhaps ease further to test the SMA 50 (blue) before resuming the short-term uptrend. I am leaning toward an upside test of the SMA 200 (70.80) and that thick resistance zone (71-74) before a pullback with the broad markets. *

* I am projecting, not predicting. Let’s stay open to new inputs.
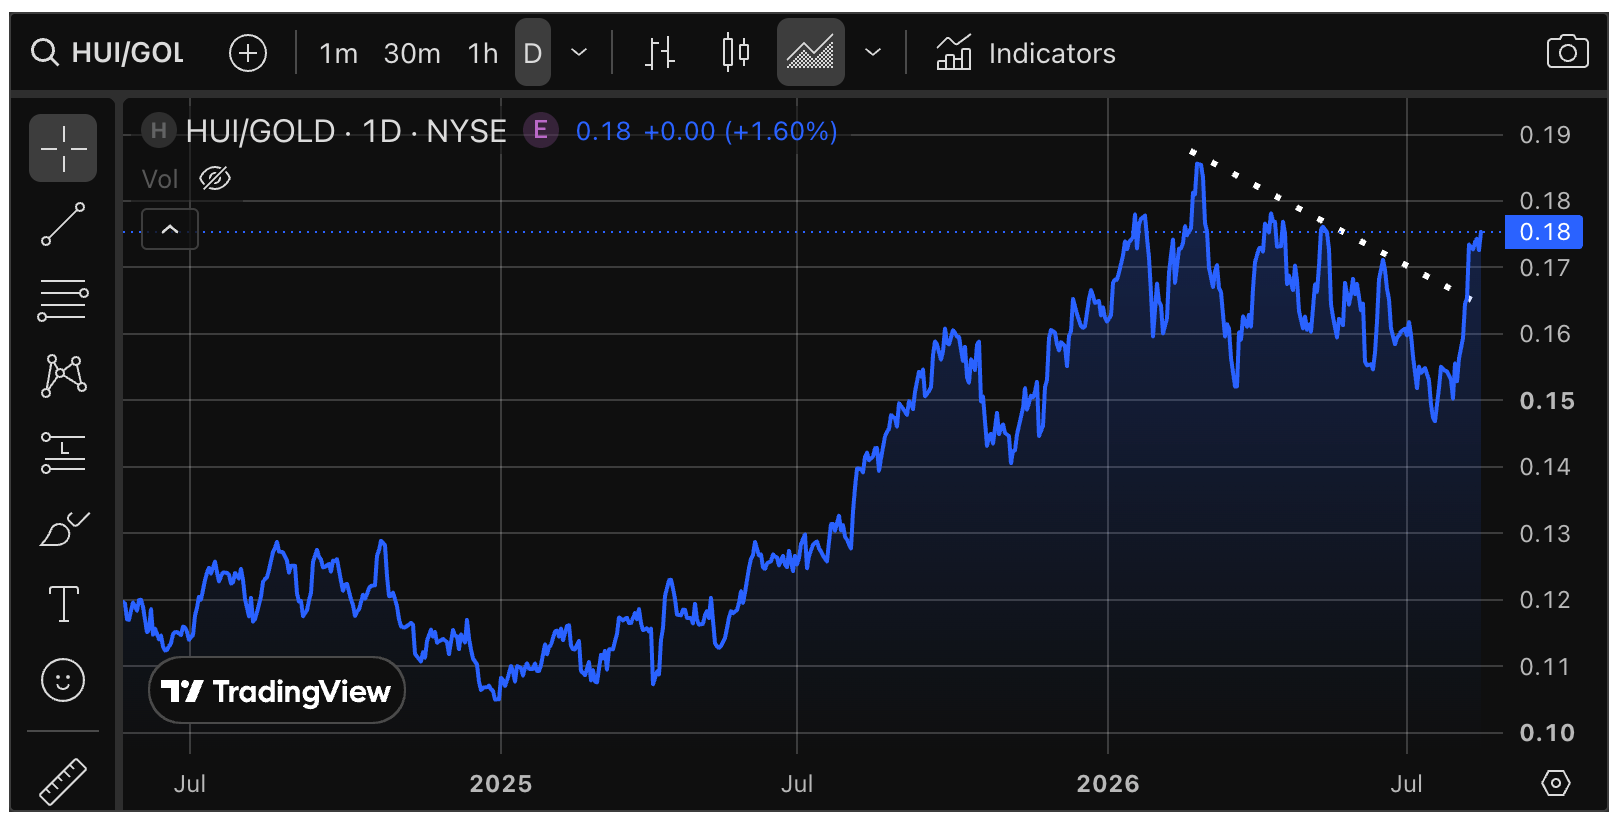
HUI Gold Bugs index has 50% Fibbed already on the rally. That is a quite viable, but not preferred, upside target.

Odds favor a near-term boost to the 62% Fib and resistance at 830 (+/-) due to the HUI/Gold ratio as a bullish internal indicator.
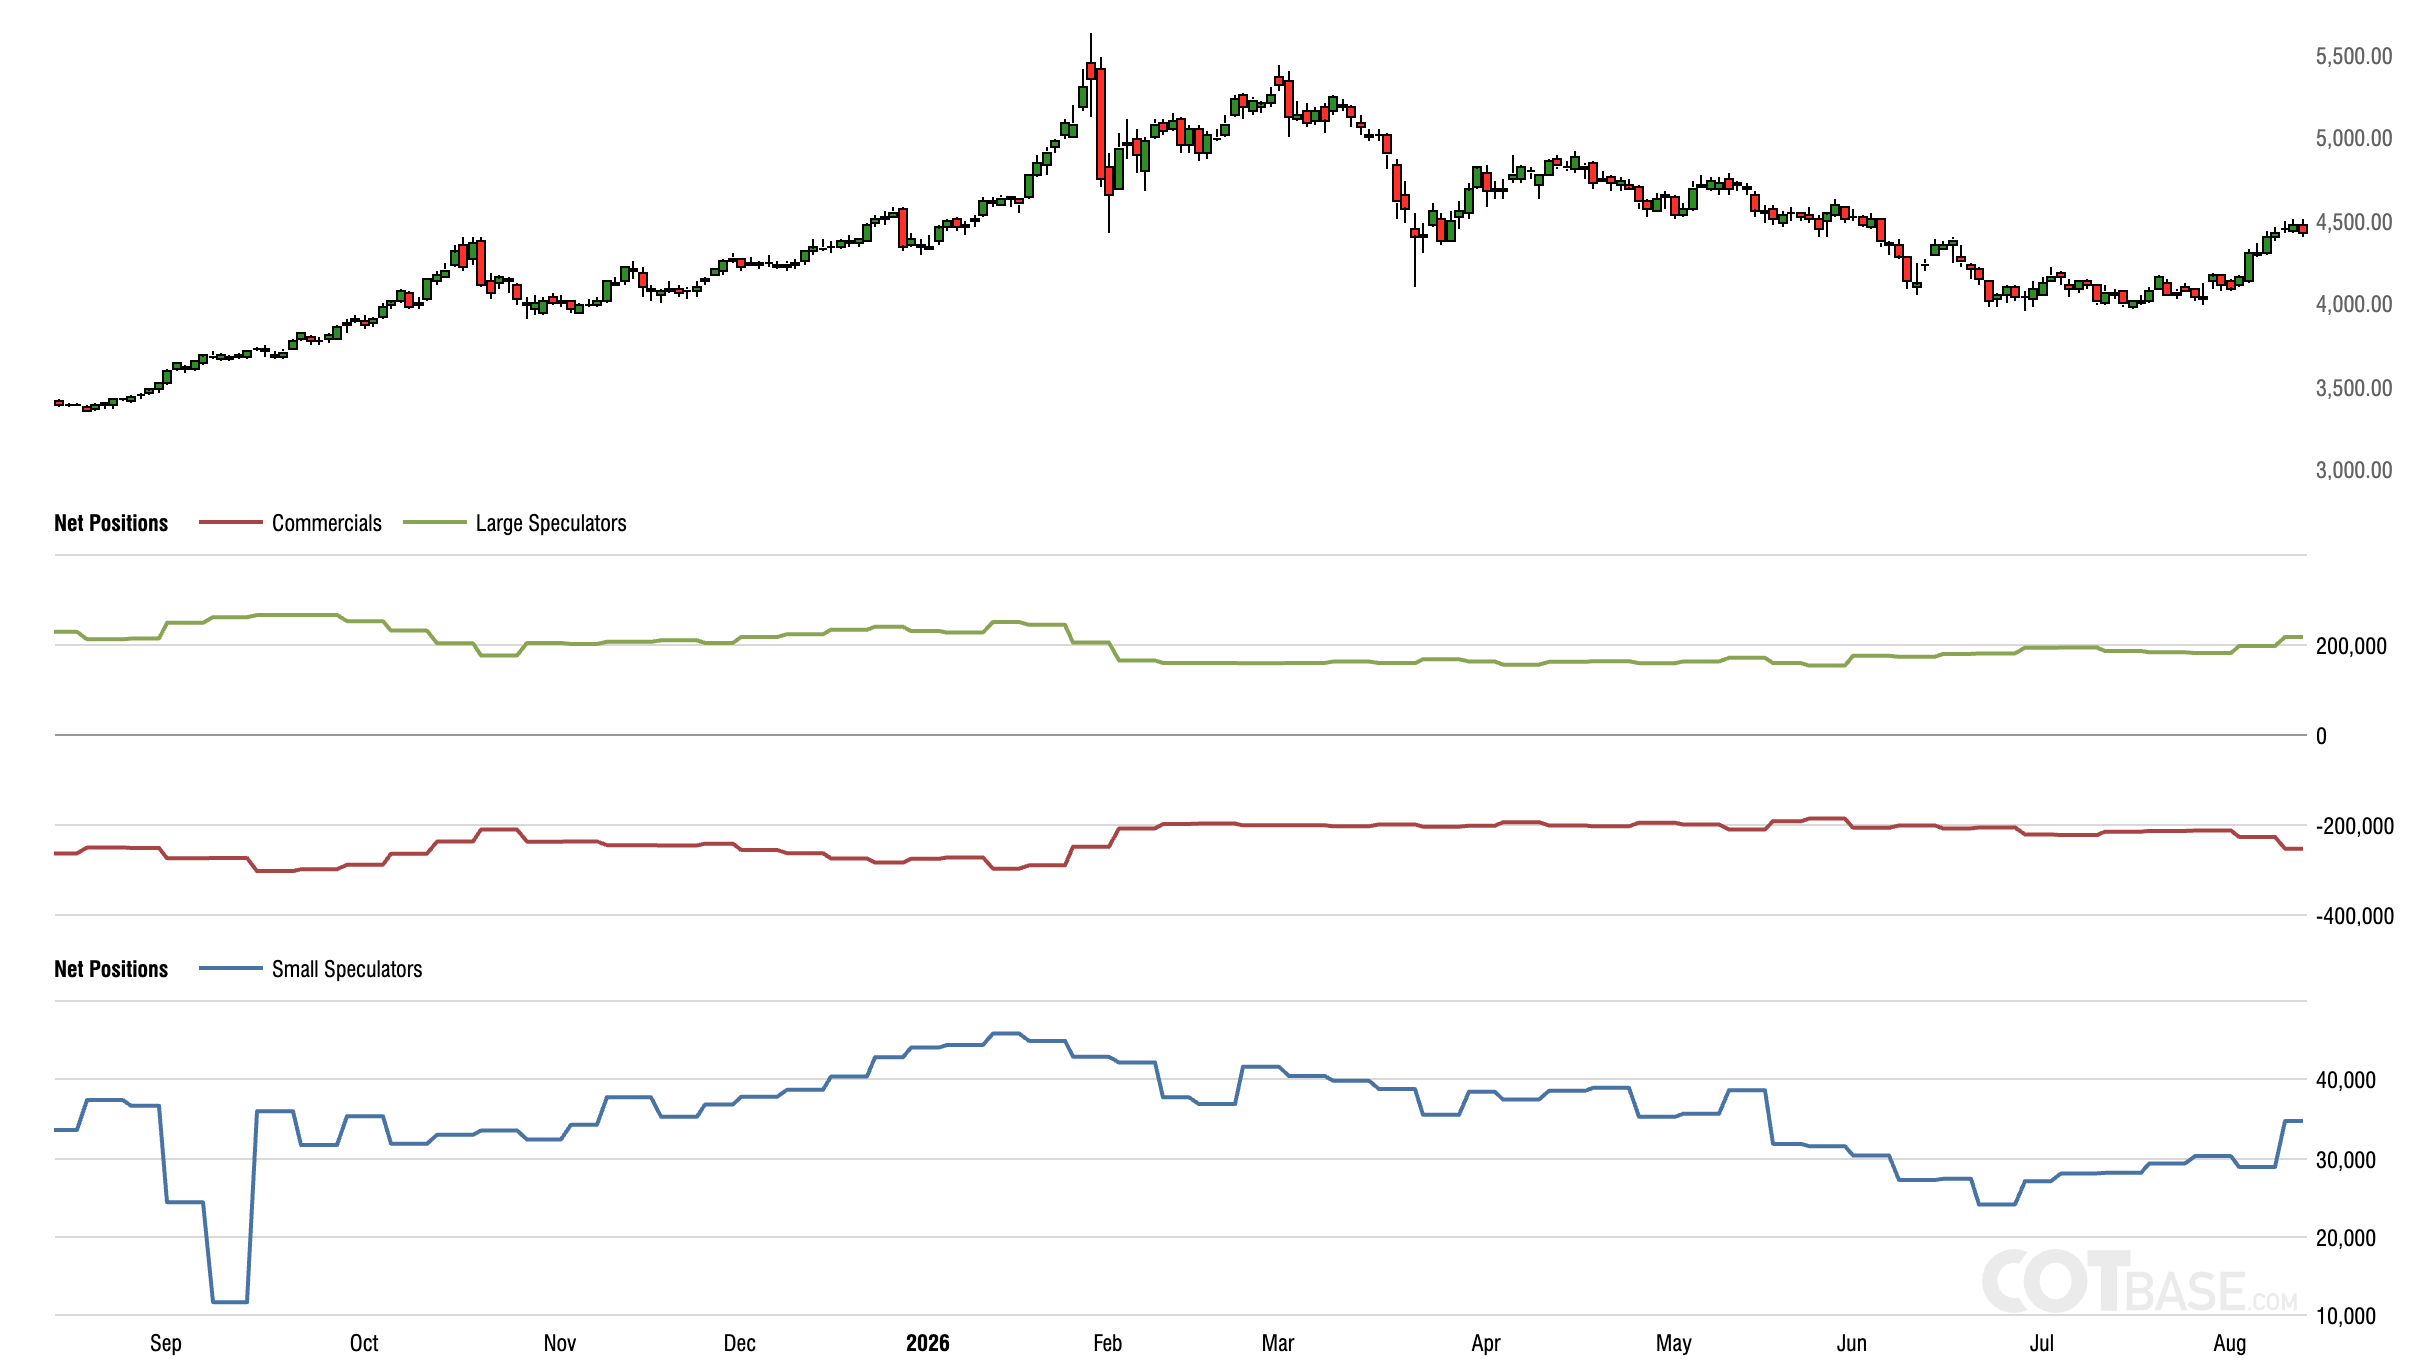
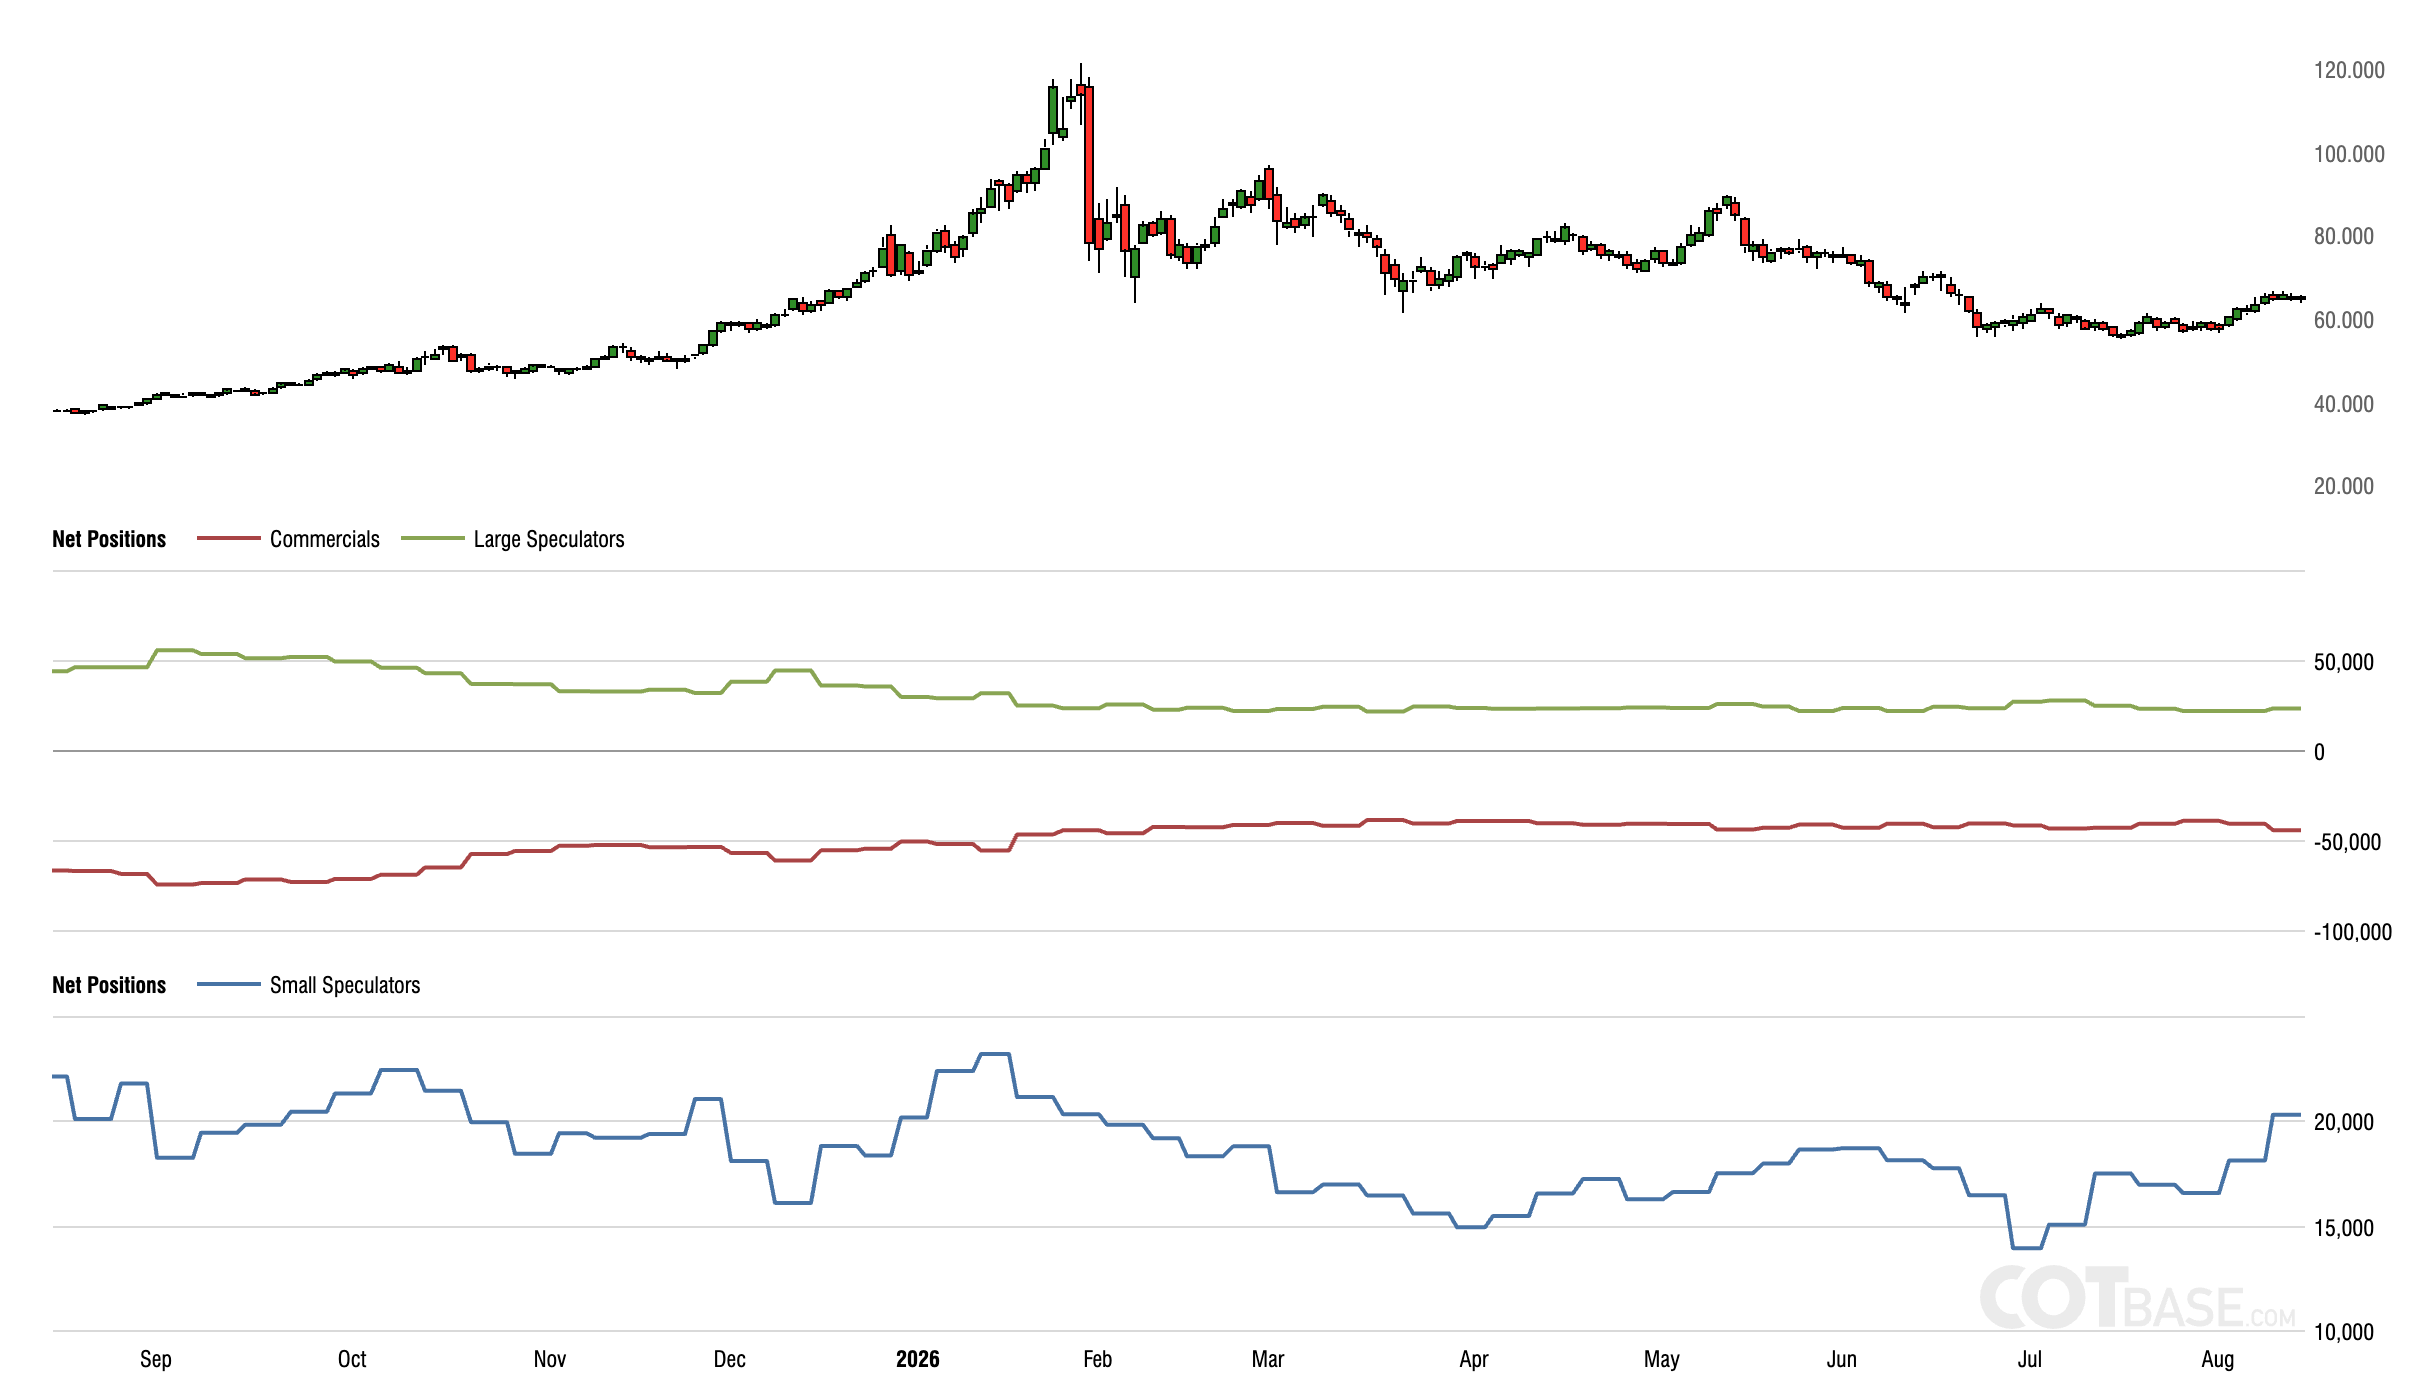
We have not reviewed the gold and silver Commitments of Traders in a long while due to the obviously bearish situation and bleak sentiment as the sector was kicked to the curb in favor of sexier 2026 plays. But now we should watch CoT more closely.
Gold’s CoT is starting to creep contrary bearish as large Specs add, Commercials fade, and the little guy starts to eat. It does not look dangerous, but is inching toward a contrary-bearish situation.
Silver’s CoT is nowhere near a contrary bearish situation, although the little guy is popping his head up like a Prairie Dog, looking around for greener pastures. Perhaps one nice pop in the silver price to get everybody aligned over-bullish prior to a pullback from the thick resistance noted above? Could be.
Between the two NFTRH+ updates and the public article, all linked above, let’s keep the PM segment basic and move on. Anticipating more short-term upside, followed by a pullback, followed by PM leadership on the next broad rally.
Commodities
And if gold is going to lead, and silver is going to assume leadership from gold, and if the USD is going to weaken into 2027, and if they are going to inflate into the next presidential election… well, you can see where I am going with this.
I expect the “Commodity Super Cycle”, so well touted for many years now, to finally get underway. Indeed, with the state of copper and a few other critical/strategic commodities, it is already underway. But the next phase of it would come in unison with the ‘up > down > up’ plan if that plan is a good one.
Favored commodity stocks are copper miners (on which I took profits except for FCX, last week), Uranium stocks (still holding CCJ, NXE and UUUU), Rare Earths (MP, CRML, ALA.TO) and Lithium (profit taken on ELVR, ALB added per NFTRH+ update TA, and SLI).
In other areas, the only reason I didn’t add Gas stocks AR and/or EQT is because if anything, I want to reduce positioning in the coming weeks, not increase it. But this is part of what I meant by this note in the Daily Market Blog:
As it is, I hold way more positions than normal and there are more that I want, eventually. I find the need to satisfy the profit-taking urge. Thus far to limited degree, but over the next few weeks I can imagine it not being so limited.
So I don’t think I’ll add the Gas stocks unless I can find other items I want to sell while rebalancing.
Global Stock Markets
The chart included in the summary at the beginning of the report tells the story. At least the story I am focused on. A macro story. I am not the guy with boots on any ground outside of Massachusetts, USA. I am the macro market internals guy. As such, I want to know what markets first, and what within those markets second.
In other words, “top-down” macro, baby. Getting the macro right first benefits successful stock selection because you’re not fighting the market, you’re looking within it.
Current global positioning includes a few items like Premier Semi Equipment play ASML, Asian delivery app GRAB and French Aluminum producer CSTM. Plus a host of Canadian precious metals/resources stocks.
Just as 2027 is expected to bring a significant commodity trade, so too is it expected to bring a global rotation. Yes folks, it’s the 2003-2007 blueprint!
Portfolios
Gold is long-term risk management & monetary value/stability in a balanced portfolio.
Taxable “Savings” Account
Net cash and equiv: 75%.
The holdings are diverse and cash could be raised if/when the interim market correction view comes forward.
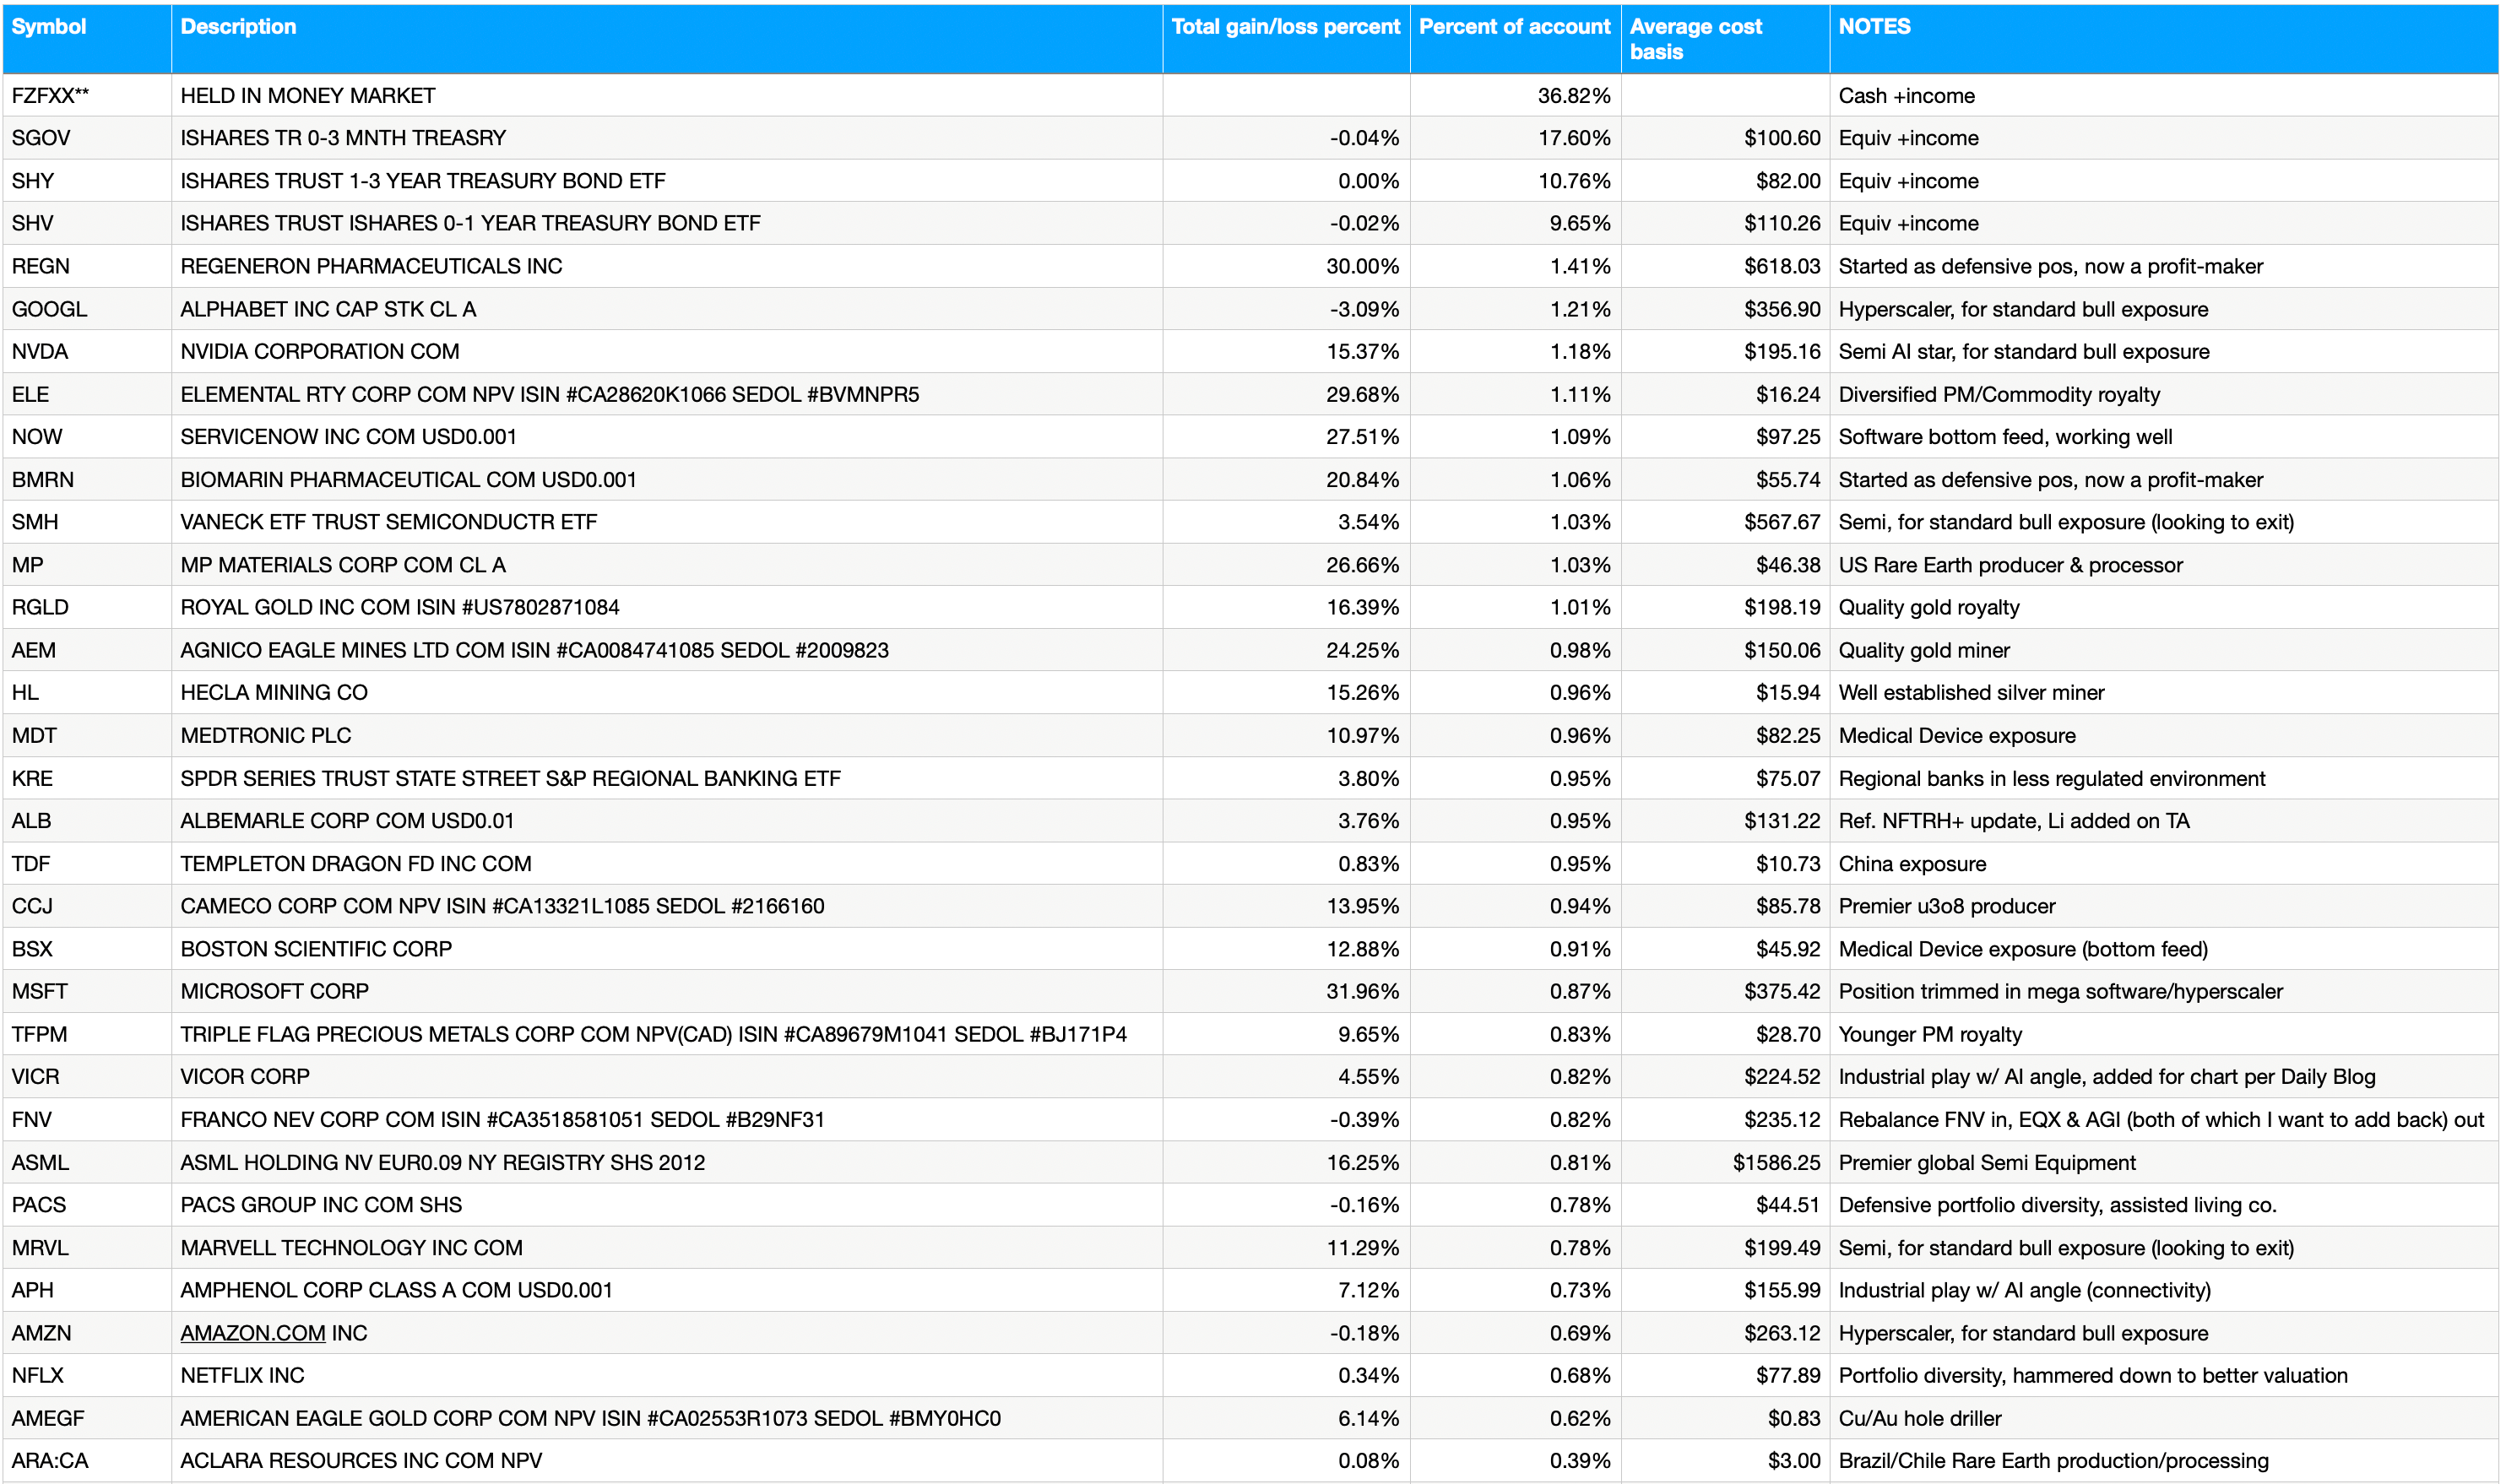
The “Savings” account will vary in its positioning. At times when I am confident of bullish markets it will hold positions, while remaining primarily a cash/equivalents account. At times I am not, it will not substantially hold much beyond cash/equivalents.
Trading Account
No positions. Account may try to short a market correction view and/or trade long a market low ‘buy’ situation. Meanwhile, the trading account sits patiently, holding previous gains and waiting with little urgency. And frankly, I have not had the head space to think about trading over the last many weeks due to our move and the upheaval it caused.
Roth IRA (non-taxable, no contributions)
The YTD chart has broken out, rewarding my patience, holding at previous support. However, I am not likely to tolerate a loss of this new support area without triggering a round of selling/profit-taking. The higher the market (and my account) goes in the short-term, the less tolerant I become.

Net cash/equiv: 69%.
More speculative positions than the ‘savings’ account. But still pretty well diverse. Also subject to profit-taking, loss-limiting and general risk management prep for market correction potential (as usual, but especially now).
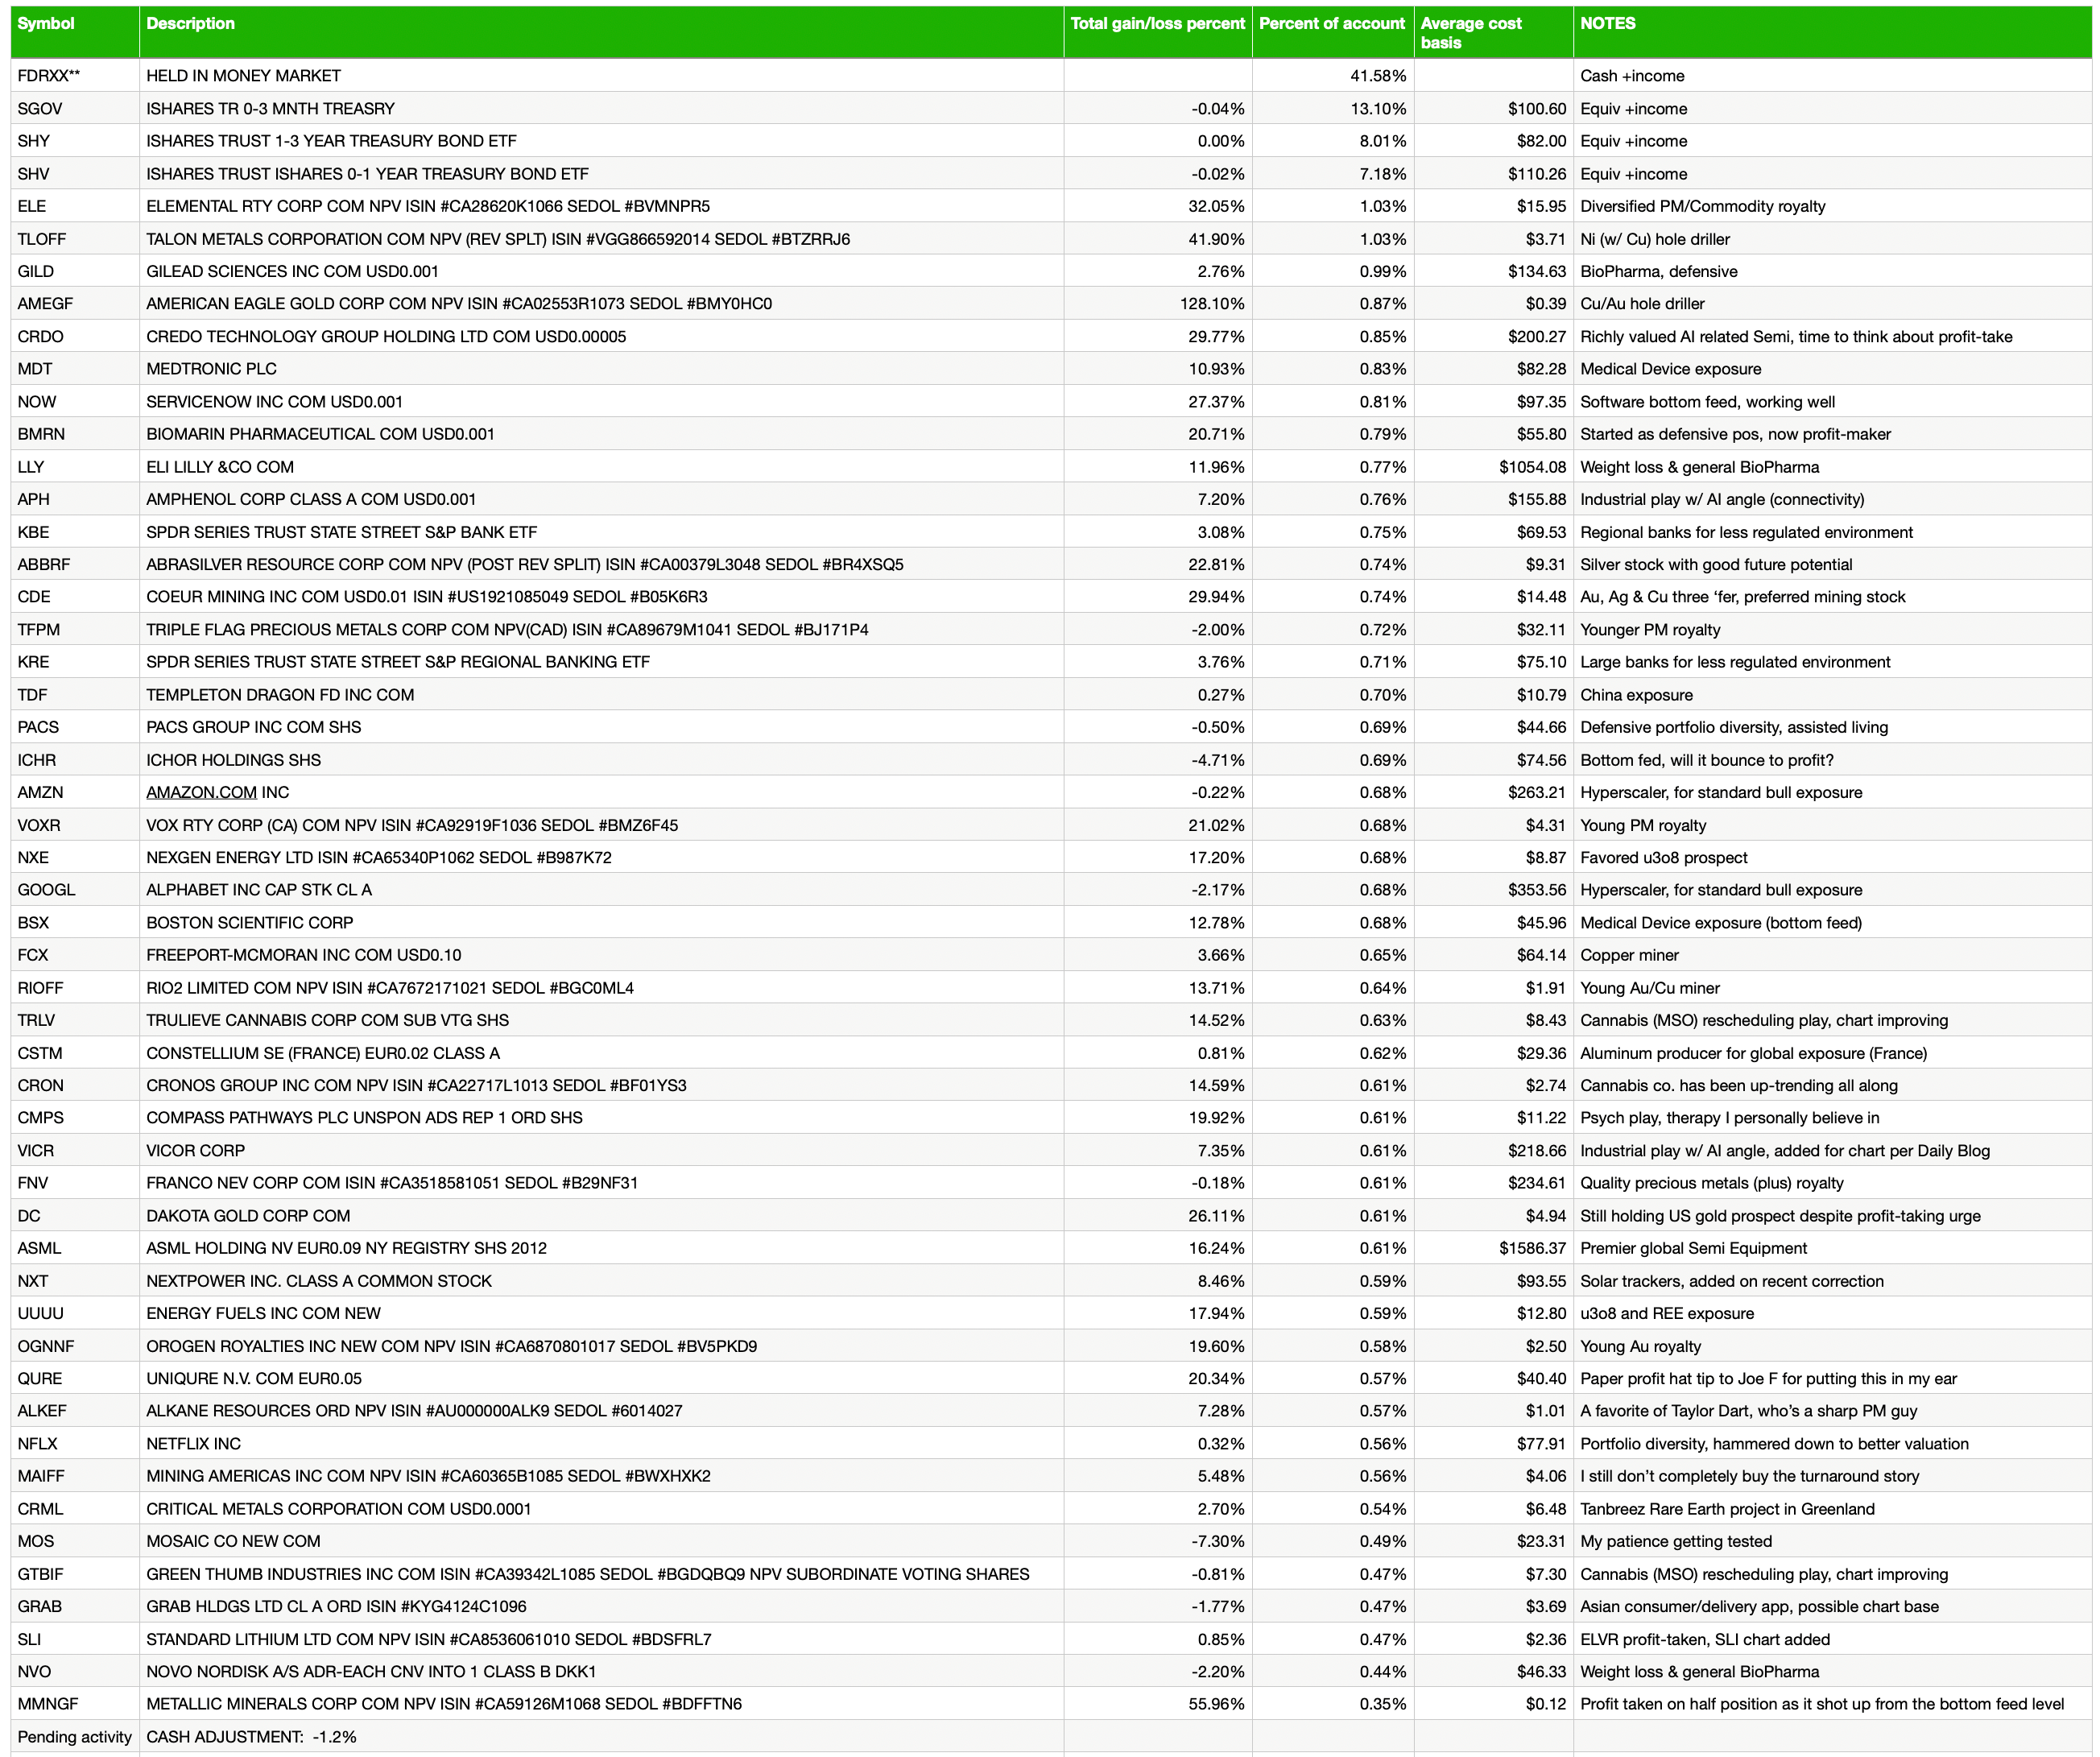
Cash & income-generating Treasury bonds are at levels that are right for me and my real-world situation. Your situation is different. Cash will be adjusted as needed.
Refer to the In-Week Notes under the NFTRH Premium menu at nftrh.com for market talk and occasional trading info, if interested. Also, you can follow on X @NFTRHgt for notice of updates.
NFTRH is not to be distributed to third parties without prior written consent
Notes From the Rabbit Hole (NFTRH) is a weekly market report in which we provide analysis on financial markets. We make every effort to provide accurate and high quality content, but this analysis ultimately represents our opinions and these opinions are provided without warranty or guarantee of any kind. See full terms & conditions of service under the ‘About’ heading in the main menu.

Good stuff Gary, will be watching closely if the metals have another nice bull push ahead before a potentially substantial pullback. The Silver/Gold ratio continues to be stubborn for now, but the consolidation looks like for a break and a $5-10 rapid up move in silver to follow. Your using the 200DMA of the BPGDM is very innovative and a nice bottoming indicator indeed.
Thanks Nik. Under certain circumstances a single hard spike down in BPGDM does the trick. But at the end of a massive move like that and with the “multi-month” correction expected, the SMA 200 builds in patience for us.
Have been following you for a while and decided to pull the trigger on the sub yesterday. Thank you for your insights. We should watch bond yields closely here as the main driver of the macro…. They are looking, ahem, perky… If you think the metals bounce is reversing, appreciate your prompt updates. Many thanks Nik
Well thank you, Nik. And welcome. Please feel free to ask any questions you may have along the way.
That’s the plan. But I have to be careful not to mentally whipsaw subscribers. The 62% Fib on GDX as illustrated in last week’s updates is the upside target. I try to lay out a lot of info ahead of time so I’m not play-by-play calling and fatiguing people in real time.
Makes sense Gary, thank you. By precaution I have been building a position in December 2026 WTI futures. Getting oil sub 80 with the ongoing mess in the ME seems a steal to me and a good hedge against an unexpected and sharp metals pullback.