
Summary
US Stock Market: Bullish and at high risk. No change there. Major indexes at all-time highs with breadth lagging again and an internal rotation back to Growth/Tech from Value. Bullish… bullish… bullish. Risk… risk… risk. Party on and play on Garth, if you will. But remain aware of the bad risk/reward.
US Market Sentiment: At last readings, Investors Intelligence bull/bear spiking at 3.18, briskly over-bullish. AAII heartily (but not extremely) over-bullish. NAIIM chasing the market to over-bullish @ 94%. Sentimentrader Dumb Money heartily but not extremely over-bullish. Risk signals high for stocks both short and long-term.
Market Indicators: The story continues. A story of some indicators showing a bullish, complacent, FOMO-fueled speculative backdrop with danger indicators not yet triggered, but in waiting.
Global Markets: No mention in this week’s unregimented report. But global on balance is a paler version of the US and its headline indexes. Bullish. Exception continues to be China. Asia/EM (AAXJ/EEM) are neutral but making a look that could easily bust bullish, especially if USD bull trapped last week and fails). Finally, let’s get an updated look at the TSX-V, which is grappling with important support. A hold here could see the inflation stuff gain a bounce. A failure and the implications for commodities and precious metals would not appear to be good.

US dollar: USD (DXY) is at a decision point, flagging just below the December high after breaking above it. That break should either resolve to a bull trap breakdown (which could rotate commodities & resources into the party) or a re-take of that high and if it brings the bull biased Gold/Silver ratio with it, renewed pressure upon the inflation stuff along with much of the cyclical world. Goldilocks items like Tech/Growth may try to resist for a while as a strong dollar would not be a direct threat.
The Macro in One Picture
Behold this picture of gold, the S&P 500, the Gold/SPX ratio and HUI over the history of the age of Inflation onDemand, kicked off by Alan Greenspan in 2001. Then we will discuss on the other side.

Notable aspects of the chart:
- Nominal Gold is performing fine in relation to SPX since the new bull cycle began with gold’s 2019 takeout of the ‘1378 Bull Gateway’. That, given the bubbly ‘soft landing/no landing’ backdrop currently in play is an accomplishment in itself; gold being risk ‘off’ with a counter-cyclical utility.
- With the exception of the gold stock bubble years (2003-2008 and again in 2020) HUI has reliably tracked the Gold/SPX ratio, just as it should.
- The 2001-2002 period was a righteous bull cycle. The 2003-2008 period was a bubble, as Greenspan’s inflation problem transitioned from money supply creation to cost-pushed inflationary effects it ate away at the gold miners’ operational performance as gold under-performed cyclical commodities, including mining cost commodities. The post-2020 period was a replay of 2003-2008 bubble excess, except that it was ‘one and done’ and did not feature three separate surges as the ’03-’08 period did.
- Dialing back again, the Gold/SPX ratio remained bullish into 2011, and HUI followed it. 2008-2011 was a legit phase. The bubble years for gold stocks (2003-2008 and 2020) were due to the massive out-performance of gold stocks to their beneficial indicator (Gold/SPX).
- Currently, the beneficial indicator (Gold/SPX) is antagonistic as nominal gold is near all-time highs and the Gold/SPX ratio continues to guide the miners downward (that’s negative leverage at work, and it’s been at work since mid-2020). Again, the miners will not follow gold. They will follow gold’s relationships to important cyclical, risk ‘on’ markets. Enough complaining about poor performance! What is happening now is what is supported to be happening in a policy bubble induced stock mania.
- With respect to the 2020 situation, we noted that gold stocks needed a correction because of how far stretched they were above Gold/SPX. At the time we compared that to the 2003-2008 era, but personally I had no clue the resolution would take so long. It is taking this long.
- But the ongoing macro bubble in policy making and public confidence in said policy making endures. See Thursday’s public post: It’s a Bubble, and It’s Intact. Hence the gold stock correction endures. It’s perfect, if you like logic and abhor hype, hope and desperation.
- Those hating gold stocks simply because they “suck” will be left aside when stocks top out and the macro finally turns.
- That is because they “suck” for a valid reason, although perma-promoters fail to see it that way. The gold mining sector is leveraging the cyclical, risk ‘on’, inflated, bullish macro… to the downside, just as it should.
Frankly, I am blowing myself away with the chart above. We used variations of it back in 2020 to explain why gold stocks had gotten ahead of themselves. But the situation has persisted and matured in that the risks to the ‘risk on’ markets are very high from a risk/reward standpoint. Marry this to our other risk indicators and think about the election upcoming folks, I think we’ve got a very annoying, dynamic, exciting and scary year all rolled into one. It is also a year when we may be able to change the macro be the first on a new phase few will see coming.
Risk/reward is not a timer. It is a condition for a negative change in the big picture macro. If I am right about a negative change to the cyclical macro the above shows that it would be highly likely that the gold mining sector would become unique and quite bullish for the very reason that it sucks now; gold’s relationship to cyclical assets.
Meanwhile, let’s we gold bugs remain aware of the situation but not obsess on it, as has been the advice since mid-2020, when the inflationary macro bull cycle (now transitioned to Goldilocks) began.
Manufacturing Bumps Up, Government Bulks Up
After the January Payrolls report we noted that Manufacturing, the little engine at the rear of the gigantic USS Lollipops’ ship of Services was actually positive, joining typical services economy stuff like Professional/Business, Education and Healthcare, along with Government, which seems to be in a pre-programmed streak of hiring.

I wanted to back test the assertion that Government hiring has been conspicuously strong prior to, and now within this election year, and sure enough it has been. When reviewing this data (BLS) of Government hiring vs. other sectors it has more than held its own as source of job growth over the last year.

Manufacturing (ISM), meanwhile, shows ticks upward in these key categories:
- New Orders: 52.5%, now into expansion and a new high after a trend upward from mid-2023.
- Employment: Still weak at 47.1% and in a gentle downtrend. Okay, so who’s figures are the best gauge for January? ISM show a fade and BLS shows a surge. Do we go with an industry monitor (ISM) or the government itself (BLS).
- Customer Inventories: Dropped to 43.7%, which is not a bad thing if they plan to replace that inventory. That is where new orders come from.
- Prices: Seem in line with our theme that a new mini-bout of inflation can visit in the interim to a deflationary resolution. Prices ticked positive to 52.9% after wallowing in negative territory for over a year.
The bottom line (and referencing last week’s tin foil hat discussion) is that Government and Manufacturing are boosting along with the massive services sectors about T-minus 8 months until the most potentially outrageous, scary, entertaining and ‘for all the marbles’ election in history (IMO).
Reference the thoughts of government able to hire at will (with no realistic limits to deficit spending) to bulk itself up and think about the industries (e.g. Semiconductor CHIPS act, EV/Green initiatives) government may be keeping its back pocket to stimulate at just the right time for max political effect with regard to the election.
In recent weeks the theme that the government may be in there semi-covertly rigging the economy has come to the fore. I usually try to keep conspiracy far away from this work, but if the shoe fits and the data support, I’ll certainly view it as a viable consideration.
Bottom Line: I see the current macro – at least the US-centric macro – as a war between the danger indicators we have in play and a powerful force putting as many fingers in the dyke as needed to keep the thing intact for as along as possible in a dynamic election year.
Precious Metals
So a major guiding indicator (Gold/SPX ratio) is negative and the miners actually show the potential for more downside by their proximity to the ratio.
GDX (daily chart) filled its 2nd gap on Friday on the bear flag breakdown. That’s a positive. RSI is not oversold, that’s a negative. GDX can take a shot at support at 25-26. It could also fail miserably (or gloriously) and fill the gap at 22.35.

Fundamentally, we have a potentially beneficial short-term factor (rising Gold/Oil ratio in Q4, 2023 to be reported this month) and ongoing negative longer-term factor as represented by the big picture chart of gold, SPX, Gold/SPX and HUI. The macro is not ready and it will not be ready, from a funda standpoint, until the bubble blows.
Our view of the gold mining sector is counter-cyclical. I don’t give a damn what the perma-obsessive down the street says. He’s been wrong since mid-2020. The only reasons to even be involved with this sector as I see it are:
- If you, like I, are anticipating a big picture macro turn (with a boat load of patience) or…
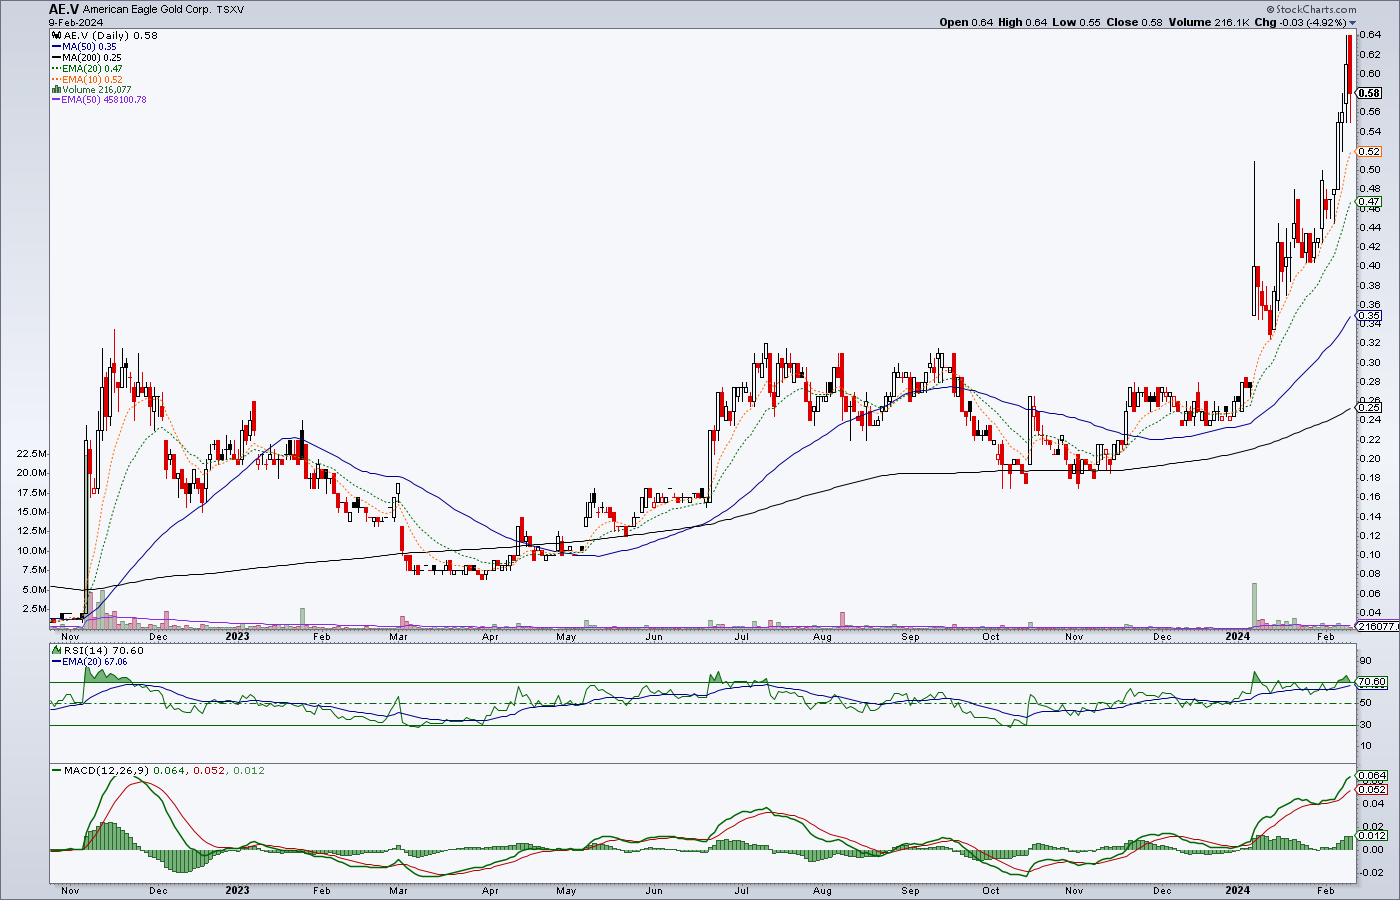
- If you, like I, have a gold stock or two that you do not want to be out of. Mine are (OGN.V, hat tip RK, and AE.V, which I chased last week because one of the people – NFTRH subscriber and geologist MC – who pounded the table on Great Bear’s resource a few years ago is pounding the same table now.
Aside from that, there is little reason (outside of day trading) to be involved in the sector, in my opinion. I don’t know how to be more clear on this.
I write about the miners being negatively leveraged to the bubble macro and feel like it is just a few words in the wind, an ill wind of perma promotion by those warning of a great crash in stocks to come, inflation, China/India buying and the virtual end of the world… any day now. Yada yada yada…
Is the Macro Changing?
You tell me. Did this monstrous move in the 30 year Treasury bond yield mean something profound? It is a monthly chart and it moves slowly. Beyond the scope of this chart the former downtrend in long-term yields dates back to the 1980s. That trend broke. Our view has been that the disinflationary bond market signaling gave full license for monetary (and fiscal) authorities to use the only trick in their bag at every liquidity danger point: Inflation, by various means.
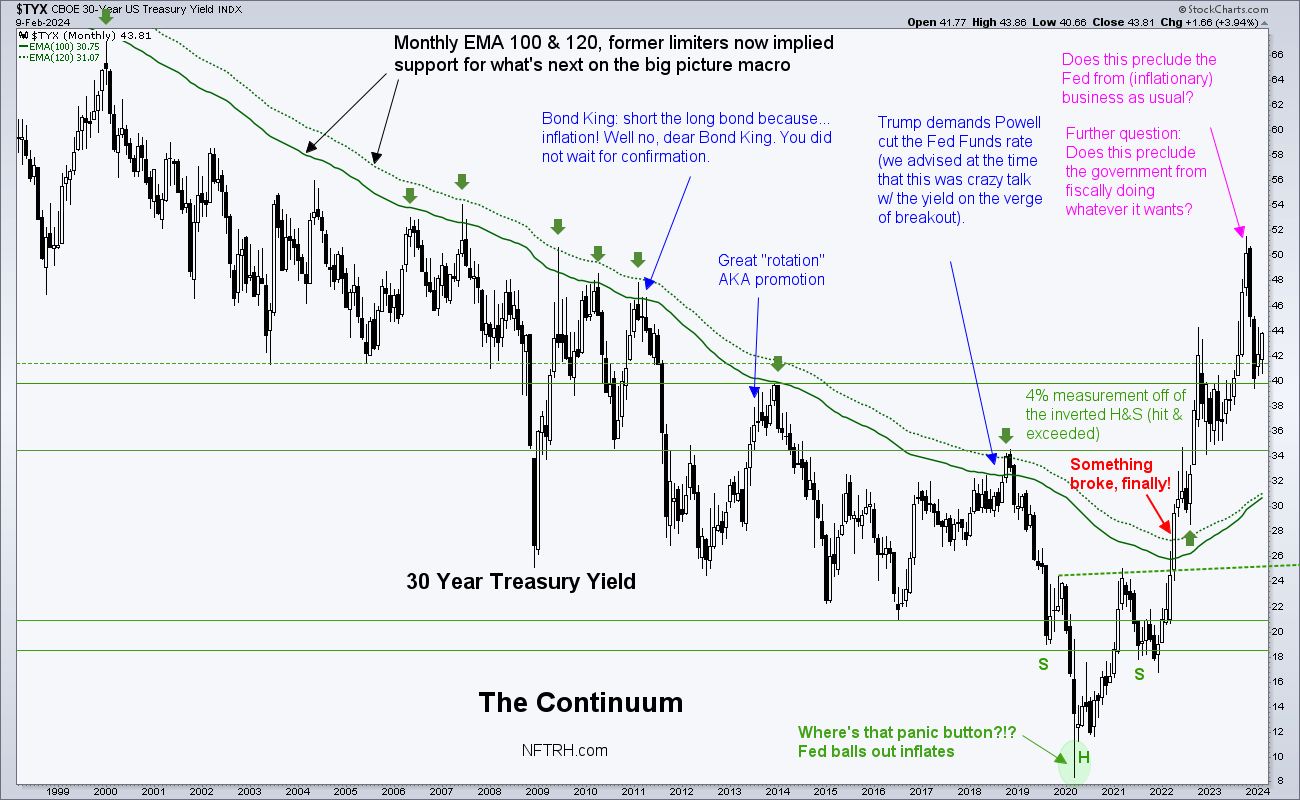
But why then is the bubble still intact?
Good question. My guess is that it’s a dead man walking. A zombie. It is not aware, or at least not yet reacting to potentially profound changes in trends in the mechanics beneath the surface. Of course, I could also just be a lunatic who should stick to stock charting as opposed to the macro ‘top down’ stuff. Well, I am of course biased, but I don’t think that is the case.
Last week it was speculated that the administration in power is probably in the mix in ways we (or I) cannot know, managing the markets in hopes of getting through the election. We also noted that the government could have some Semiconductor sector and EV sector welfare in its back pocket, waiting for the right time to try to send Trump back to the hell he came from. Speaking personally, it grosses me out to think about an administration in power manipulating my market, my line of work and the economy for its own gain. But I’ll put aside emotion and function as directed by the macro situation at all times.
I think that politics and what will be increasingly deafening noise in 2024 have gotten into the picture and that could draw things out for a longer period than normal when indicators like the following are flashing RISK:
- VIX divergence to SPX, which tends to precede corrections and bear markets.
- Yield Curve in a steepening stance (but still inverted).
- 2yr Treasury yield negative divergence to the Fed proxy 3mo. T-bill yield, which preceded bear markets in 2000 and 2007.
- Gold/Silver ratio (GSR) bull biased while USD decides whether to continue rallying. If gold rises hard vs. silver the implication is counter-cyclical, anti-liquidity. USD has been the ‘anti-market’ to the whole inflated shootin’ match for the last 1.5 years. It made a higher high to the December high, pulled back and now… decision time. In that case, Growth and Tech (Goldilocks) could be less effected than the cyclical aspects of the economy.
As you know, there are several other indicators, including sentiment indicators advising that the stock market is two things right now: 1) very bullish and 2) at high risk amid extreme complacency.
Why is the bubble still intact? Human nature maybe. Humans herd, whether they like to admit it or not. Machines evidently herd too. Or maybe they tend and lead the herd.
Again, I’ll choose to view it as a bubble not in stocks, but in the policy that has re-blown the bubble in stocks at every bearish turn (e.g. 2001, 2008/9, 2020) and I’ll also choose to give weight to the idea that bubble making mechanics have been limited (at best) by the implications of the Continuum chart above. If I am wrong about that, the big brains over at policy-central will have come up with other methods of debt manipulation that I am not accounting for. Confidence in our monetary heroes is intact, after all. With the crowd behind you, you can perhaps do anything. But I’ll believe it only when I see it.
Meanwhile, our merry headline stock indexes continue upward and appear to be going the ‘upside blow off’ route as opposed to the ‘roll over’ route after making the anticipated new highs. In my opinion it’s not investment worthy, but it is and has been trade worthy. The trade could end this week or it could persist through the election.

Here I can’t help but think about the 475 target projection on Microsoft. I thought it was improbable when first noted in October with the price at 331…
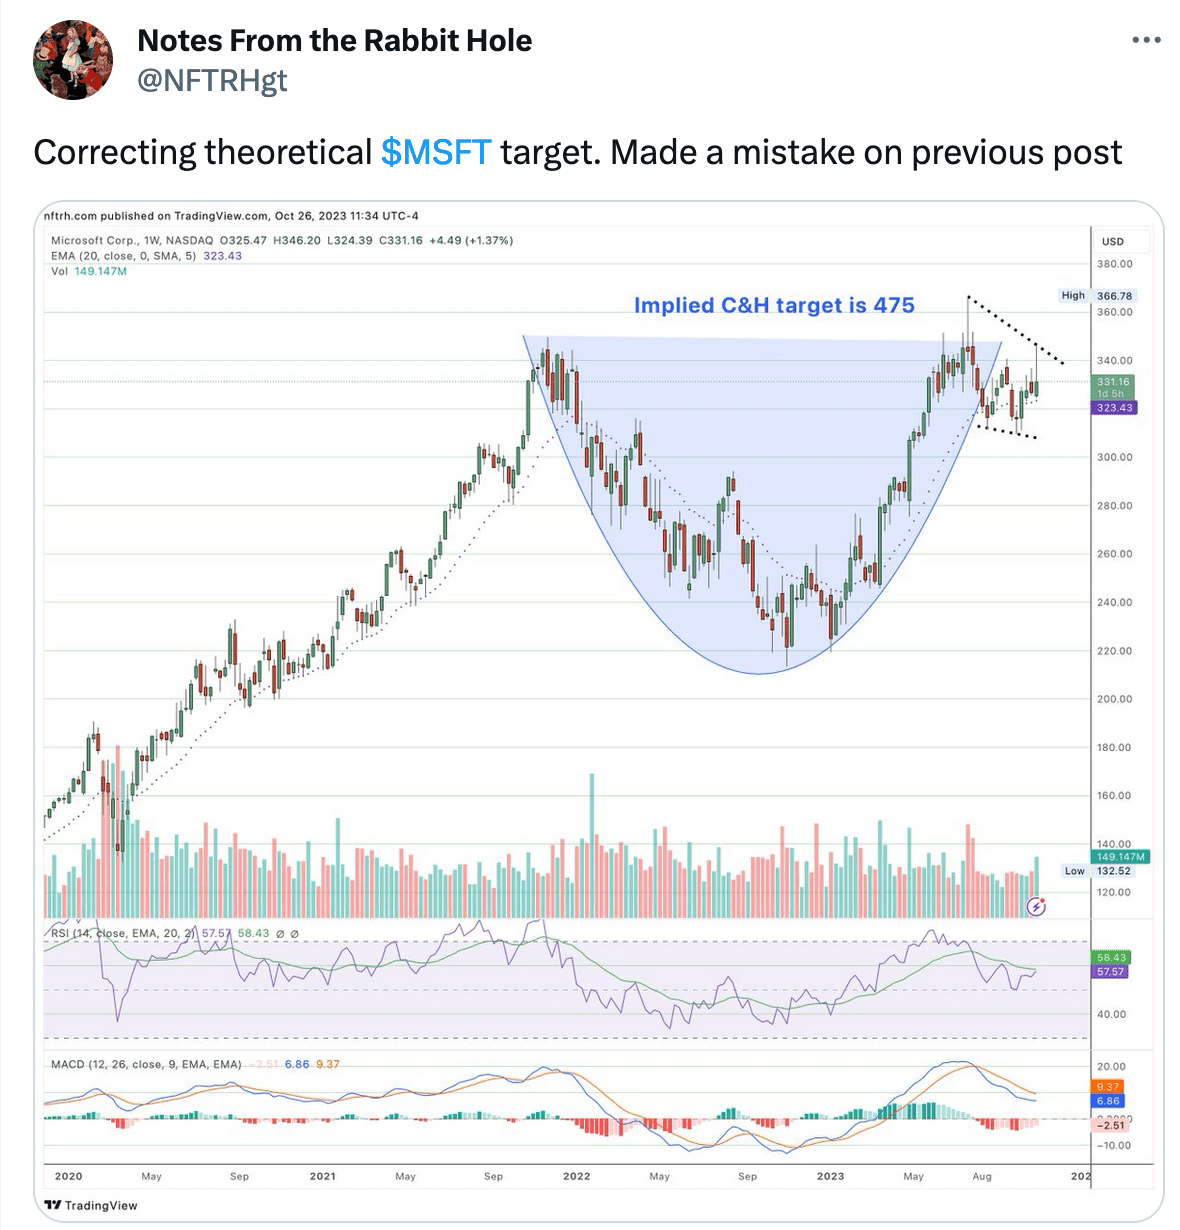
…but at 420 today it no longer seems all that improbable. I am not saying ‘buy Softee’. I am saying that the sexy names the machines and money managers are chasing are massively bullish, despite the risk, and the Microsoft target was noted for a reason; because anything is possible in Wonderland and in a manic market running on emotion and greed.
I think that the market (SPX) ‘double top’ scenario is pretty much out the window and we have an upside blow off specimen, which could – in the way markets work – be the glorious end of the bubble. Think about how crude oil ended in 2008. That was fierce spike upward with promoters like large (Pickens) and small (Martenson) alike providing us with reasons why it was happening (peak oil).
Think about silver in 2011. Think about Nasdaq in 2000. Think about gold mining grossly over done vs. the Gold/SPX ratio into 2008. Stocks (SPX) have not had a glorious bubble since Nasdaq’s 2000 blow out. They simply rolled over into bear markets in 2000 and 2007. So, turnabout is fair play. Eh?
Strategically Speaking
I wish I could assign some sort of sensible methodology to playing this, but it is against my nature to just shut up and be unbiased about a FOMO-driven mania and trying to look like all’s normal until it ends. That is what many are doing now whether they know it or not, or like it or not. When the thing bursts, everybody will be in pain so make hay while the sun shines and then be wrong like everybody else when it ends.
I won’t do that. I will keep looking ahead and trying to define the ‘why’ and the ‘what’ of this experience while at the same time trying not to hype or scare you bearishly. Risk is in play. Cash is a paying 5% ‘no lose’ proposition and stocks are blowing out to the upside. When you think about it, it is a wonderful environment… as long as you do not get caught believing the stories that support it justify valuations.
AI today, dot.com in 2000, peak oil in 2008, ‘silver to da moon!’ in 2011… and so on.
They all end.
Meanwhile, it pays to continue to keep track of the market’s rotations. In 2022 the market rotated to value stocks. In the 2023 recovery it rotated to growth/tech/Goldilocks. That is still where we are, as evidenced by the Growth/Value chart included in Friday’s Trade Log (a reminder that the trade log will sometimes include stock/market charts for reference as a sort of lower priority, more streamlined updating method.
Commodities have generally been on the outs with the main exception being Uranium. Oil is in a positive seasonal and NatGas is just about to enter one. I am on the lookout for the market to either rotate toward commodities and resource markets or start to include more of them before it blows out. That is not a high conviction point of view based on the herd’s intact confidence in the Fed of Oz and its ‘anti-inflation’ stance. But again, here we look ahead and consider possibilities and probabilities. We look back to ‘quant’ history into the process.
Commodities could also be leading the stock market to a coming deflationary liquidity problem and not be due to bounce until government and Fed actively try to manufacturing inflation once again. Again, commodities are not high conviction at this time.
Head in the Clouds (pending Goldilocks remaining in play)
I sold SMCI too soon! And boy am I FOMO’ing. Or more accurately SFMO’ing (sad for missing out… on the subsequent continued upside). The Semiconductor sector is leading and the tip of that spear continues to be AI and Nvidia. Everybody’s got the memo. AI has now transitioned from an oncoming play to a full on mania. Nvidia is the leader in Semiconductors for AI systems and SMCI makes the storage units, servers and switches for Nvidia.
Nvidia is a great company. It’s on the cutting edge of so many of the industries that Semiconductors have gained entry into. But at some point valuation will meet waning momentum. It’s just the way it works.
Meanwhile, I have been going back to my usual bottom feeding roots and flipping over discarded former market darlings, now strewn like garbage on the market’s floor… looking for ‘me too’ and catch-up plays. Cloud/SaaS/Securtiy stuff like ZM (bottom feed, valuation fine now), SMAR (still growing, valuation relatively okay per that growth), TENB (good earnings, ‘me too!’ play to the likes of CRWD and ZS), GOOGL (self explanatory), SQ (improving operational performance) and most recently FIVN (AI automated call agent technology replacing more expensive humans).
As noted in the trade log, I actually nearly bought Cathie Wood’s ARKK based on its chart. Instead, I continued to add more of her type stocks (story stocks, growth, etc.). My interest in ARKK was just before/as the chart was thinking about breaking out of its consolidation/bull flag.

To lighten things up around here let’s play stock pick hack and show the daily charts of those named above with a little discussion (I get a little tired of heavy macro sometimes). These are my stock ‘picks’, they are not recommendations for anyone else. They are vehicles for the current macro assuming it persists in a Goldilocks fashion. Please due your own research. I tend to like bottom feed plays (e.g. ZM below) or long consolidations (e.g. GOOGL below, and SMCI previously).
GOOGL was added on the sharp pullback to the SMA 50. I liked the pattern that formed from October through December and bought on the downside test to the pattern’s implied support.

After letting CRWD go its own momentum-fueled way I took on the less richly valued and less aggressively growing (but still growing well) TENB, another Cloud Security play. It took a good pop on earnings and you can imagine a support line at 48 (+/-) based on the break to a new high for the cycle.

ZM is a bottom feed, with little positive chart rationale. The company’s growth has slowed dramatically from the 2020 bubble days. But its valuation is, in my opinion, actually a value now. It’s loaded with cash and has been taking measures to streamline operations. On the negative side, there is competition aplenty. On the positive side Zoom has name recognition and the resources to expand and differentiate from the pack. Regardless, it’s a spec for me in this macro backdrop.

SMAR is another with some pretty heavy competitors, namely Microsoft, in ‘work management’ software. But its growth has remained firm and its valuation is not out of line, given the comps to others. This was another I held back in halcyon days of 2020 (DDOG, ZS, DOCU, CRM, etc.). The chart is tame but biased bullish.

SQ is the provider of credit card processing services used by little old NFTRH. I am happy with the service. I am not thrilled with the chart, however. It needs to prove that is not a bear flag and get above the SMA 50, under which it is creeping. Any breakdown from here will likely be a ‘sell’ for me. Operationally, I think the company is making good progress and that is why it was added.

FIVN replaces humans in call centers, at about 1/10th the cost of a human. Who needs humans anyway, when you have AI? While I hate talking to a robot when I make a call, it is the way we are going. It’s not a particular value vs. its projected growth, but the chart is attempting to transition to an uptrend. Again, the reminder is that I am trying to pick up a few bottom feeds (the weekly chart shows it is still far below its highs) while the macro sun shines (on Goldilocks).

Final Thoughts
The stocks above are laying in wait to either do what the overvalued PLTR and NET did, which is ram upward amid the FOMO-driven Goldilocks market, or fail to do so. I am not going to chase much of anything. I held NET but chickened out due to valuation and never bought PLTR due to valuation. This market does not care about that. It wants sexy, baby!
An exception (to not chasing) is an outlier situation like I believe AE.V (American Eagle Gold) may be. I had to buy the Canadian symbol in an account I no longer buy stocks in because it is not available in my IRA and I don’t feel like paying the $50 settlement fee for foreign stocks that the US OTC listing is subject to. Maybe if it drops significantly, I’ll revisit that. I had the same issue with Great Bear and/or Great Bear Royalties a few years ago. GBR was a similarly long-term play (since bought by Kinross with a still long lead to future production, I believe).
AE’s NAK project in British Columbia is a large Copper/Gold resource in its early stages of definition. But when a geologist I trust uses terms like “real deal” and notes potential for large size high grade and potential for a “10 to 20 bagger” I take note. I had a former gold stock fund manager guide me/NFTRH into GBR, then MC came along and added a double shot of resolve to my confidence level. In other words, he’s proven himself to me. Personally, it’s worth the speculation (and to be sure, it IS still a speculation) with a long-term horizon.
I hesitate to even highlight (promote) it. But if I don’t and it fulfills expectations I’ll look back and wish I did. So here it is. It is up to you to ignore it or look further into it. Caveat: I chased it to position. A pullback to .47/.48 looks viable, technically, to remove some froth. All things being equal, I’d like to add there if possible.
Generally, gold stocks are not technically good (copper stocks are not much better) and the sector is not fundamentally engaged, although there is still a chance that earnings due to be reported this month could show positive implied by the Q4, 2023 Gold/Oil ratio. That’s another reason I still have positioning (along with the forward macro view).
But if I prove incorrect in thinking that the Q4 Gold/Oil ratio may help bump the sector here in Q1, and downside potential is realized, I’ll hate gold stocks as much as the next casino patron and either short or rid myself of all but maybe AE.V, OGN.V and perhaps WDO.TO. Frankly, the portfolio is already orders of magnitude lighter than it will be when the proper macro backdrop engages.
Porfolios
A perma note that funds are balanced by gold (long-term risk management, if you will).
Special long-term holding, AE.V, owner of a prospective Copper/Gold deposit. Would likely add a sharp pullback.

Roth IRA (non-taxable, no contributions)
Cash is 83% and continuing to collect its income as I lag the performance of the bubbling stock market. Someone recently asked how this portfolio performed in 2023 and the answer is a modest 7.5%, or right about where I’d have expected it to perform given my low participation in a late stage bull market and my frequent holds of loser items like gold stocks and outlier commodities (e.g. Uranium usually positive, REE usually negative).

My method can be a frustrating one because I wait for the big, table pounding, no-brainer turns that only come about periodically (ref. Q4, 2008 and to a less intense degree H1, 2020) amid macro fundamentals that make sense. I do not ‘invest’ in what everybody knows is the winning stuff. A year ago everybody didn’t know, but we did. Then true to my form I do not go full conviction and the momos take over.
As a side note, if I get it right, as I did with Goldilocks in 2023 and the post-2012 Semiconductor led Goldilocks phase, please play it for gain as you wish. Often I will call the macro and then fail to play it fully because I don’t believe in it, fundamentally. That’s either a counterproductive bias or one that will save my ass one day and also prepare my ass to make a killing amid widespread angst.
Short of a big turn I trade, make great profits, limit losses (with the occasional ‘blowup’ loss), get mentally whipsawed, see things make sense, get a little bored and generally keep my pulse rate even… but I don’t invest. It’s a late stage bull situation and it’s underpinned by the likes of Doc Hussman’s concerning graph above. I’ll continue to muddle (and play) along, thank you, until the next macro phase presents. Then if/when I see things lined up as in certain ways, it will be time to capitalize.

Cash & income-paying Equivalents are at levels that are right for me and my real-world situation. Your situation is different. Cash will be adjusted as needed.
Refer to the Trade Log under the NFTRH Premium menu at nftrh.com for trade info, if interested (not that you necessarily should be). Also, you can follow at Twitter @NFTRHgt for notice of updates.
NFTRH is not to be distributed to third parties without prior written consent
Notes From the Rabbit Hole (NFTRH) is a weekly market report in which we provide analysis on financial markets. We make every effort to provide accurate and high quality content, but this analysis ultimately represents our opinions and these opinions are provided without warranty or guarantee of any kind. See full terms & conditions of service under the ‘About’ heading in the main menu.