
Summary
US Stock Market: SPX and most US indexes lose the SMA 50 once again. I’ve seen enough now to way station in increasingly income bearish cash until one of the primary scenarios plays out. A) SPX holds 4300 and resumes bullish or B) SPX continues to correct and tests 4150. Ironically, the first scenario has the higher potential to bring on the bear market sooner. Right now… decision point.
US Market Sentiment: Contrary sentiment continues to be biased positive for the market. This would theoretically favor option A above.
Indicators: Mix of still sleepy (calm, beneficial) macro indicators (e.g. High Yield Spreads, Libor/T-bill, etc.) and systemic stress indicators (SSI) continues. However, the Gold/Silver ratio (an SSI) is approaching a decision point along with USD, another potential SSI, the 10/2 yield curve may have begun a steepener and if/when enough SSI’s work together to pressure markets, the sleepy stuff will turn.
Global Stock Markets: Markets are bending even further under the pressure of the USD rally, which is at a clear decision point. Global is transitioning from neutral (at best) to a bearish bias on balance. All (most) eyes on USD.
Precious Metals: The technical correction lives on, despite the recent bounce. Also, gold mining fundamentals are impaired by the OPEC oil price manipulation. Silver got smacked after NFTRH 773 noted a potential weekly chart pattern target of 35. Figures. But the pattern is still viable and the precious metals remain in normal correction mode. Bottom line, however, has been that the sector has not been unique since it became one of leaders out of the 2022 bear market (that wasn’t) and led the current market correction after double topping in May. In other words, the real play here is still in the future, although we should keep in mind that the gold stock sector, on average, often puts in a bottom of some kind in September.
Commodities (per last week): CRB back above the breakout point and targeting 305. WTI Oil is too and targeting 105. Energy sector is very interesting. Uraniums still look good. Industrial metals also trying to join. Outliers like Li, REE, PD & Pt are varying forms of underperforming to bear trending. Want to stick with what is working for the same reason I’m doing so with the precious metals. IMO, it’s a trade, not an investment at this time. NEW: CRB is driven by oil which is driven by OPEC price rigging. All the more reason it’s not viewed as an investment.
Currencies: USD is really pushing the limits and now the Gold/Silver ratio is bouncing hard, which brings on an important decision point. If these two fail (USD is overbought on the daily chart) another leg up in markets could generate and be led by commodity/resource/precious metals stocks and Emerging Markets. Ah, but if USD and GSR breakout and move up impulsively, the other side of the decision point is ‘everyone out of the pool’. Hence my personal patience sitting in a way station, collecting cash income while trading nimbly until resolution.
Laying In Wait For a Real Turn
With cash up to about 90% I am content in not trying to squeeze every last bit of juice out of the lemon known as the stock market and its post-Q4, 2022 rally. To keep myself entertained during the week I will plan to trade, long and/or short in small doses and always remain aware of cash positions. That will be the case if the current unbroken rally resolves upward for another leg up or downward for a test of strong support at SPX 4150, which is where the up-sloping 200 day moving average meets clear visual touch points.

As a reminder, a continued drop now could be quite bullish if that support is tested successfully. The less bullish scenario, in my opinion, would be a hold of the 4300 area and resumed rally to new highs. As it stands, SPX is below resistance after possibly bull trapping once again. Momentum has faded and down volume is exceeding up volume.
Among the myriad other issues facing the market like the negative divergence of the 2yr Treasury yield to the 3 month T-bill yield as shown in Friday’s public article, breadth is poor as leadership thins out markedly (also per that article).
What I gather from this view is another indicator (along w/ the 2yr/T-bill and others) stating why the 2022 bear market was not real. Headline SPX took a supposed bear market while breadth improved! Add that to our original rationale for a bull rally from Q4, 2022. But eventually such a negative divergence should matter, and not in a good way. There is no way in hell I am going to invest in a picture like this and its fellow negative indicators.

Yet, we all know about the ability that the stock market has of making fools of us. John Hussman, one of the smartest and dedicated market watchers out there has, due to his fiduciary obligations, been clowned pretty much forever by the market, with brief interludes of validation. Of course, at those times in has ridden the Fed and/or the government to save the day by the only means they know, inflationary stimulus of one kind or another.
Back on the functional message of this segment, I will trade and sit in interest bearing cash until resolution. The best gains will be made at the next big macro turn, not on these weekly gyrations. The options for the next big macro turn?
- A bear market is brewing and is waiting patiently for all the currently bearish and high risk indicators to be proven out. The 2023 bull is viewed as a suck-in, a potential double top, whether or not SPX ticks a new all-time high in the interim. A subsequent bear market would be highly tradable, even possibly a career maker (for those who would actively short). This would of course eventually include a test of, and failure at, SPX 4150 (+/-). But if I am a macro bear, I don’t want to see that test just yet. Ironically, I’d rather see SPX gather itself for one more bullish kick at the can, perhaps from the support at 4300 (+/-).
- A correction now continues and eventually tests SPX 4150 (+/-) and does so successfully. If that happens, the market would likely have received the sentiment fuel it would need to put on a big new rally, perhaps still only to test the all-time highs, but it would greatly extend the time frame (and the price distance) to target before the bear starts and would be quite tradable from the bullish side. This would not be a macro turn like the next bear market, but it sure would be highly tradable. A slightly lesser version of the thing we’ve had so far in 2023 from the bottom in Q4, 2022.
Either way, a bear is coming. But I’d prefer it to come sooner rather than later because I want the BIG macro turn, not a resumption of the current macro. Again, NFTRH is many things, but the thing it wants most to be is a manager of big, even epic changes that a majority get caught unaware of until it’s too late.
Bottom Line
We will either be getting bullish for an extended cycle from SPX 4150 (+/-) or getting bearish for a real bear market that finally gives in to the indicators. It’s handy to recall all of the non-bearish indicators that the 2022 supposed bear came with when thinking about how the 2023 supposed bull is attended by such bearish indicators. Eh? The market often balances itself out so of course this bull has persisted despite such negative divergences!
Either way the bear is coming. Time frame is the question. I will not invest or even intermediate trade until I get a handle on the options noted above. Until I get that handle, I will default to heavy cash and try to nimbly trade.
US Market Sentiment
Smart/Dumb indicators and risk continue to show the potential for another kick at the bull can in the shorter-term (option 1 above). Let’s keep a close eye on SPX 4300 support as the potential springboard for that. Dumb money sentiment appears too bearish to fuel a drop to 4150 but if that does happen this also affirms the reasoning that such a decline could be a very bullish development. Sentiment would be completely wiped out and thus contrary positive for a strong rally. It’s the markets, folks. It’s how they work.

NAAIM (investment managers): From 102% bullish in July to 50% bullish last week, still supportive on a contrary basis.
Investors Intelligence (newsletters): Having pulled back from Bull/Bear ratio over 3 in July to 2.25 currently, still supportive on a contrary basis.
AAII (Ma & Pa): Put on a bounce last week but Bull/Bear ratio is still subdued from above 2.4 to current 1.4. A moderate contrary positive.
Market Sentiment Bottom Line
The balance of the indicators are similar to the current market view, which could hold short-term support and rally anew or drop for a harder correction. To me it’s all the more reason to have cash and stay patient. Sentiment is not standing in the way of resumed bullish activity (and indeed is biased that way on a contrary basis) but not necessarily denying more bearish activity. Middle ground, baby. I hate that unless I am collecting income from cash and equivalents. Then I like it, because I am getting paid to do not much of anything until I have a clearer risk/reward view.
Global Stock Markets (daily charts)
Please take due note that local currencies play a role in market performance for global citizens. NFTRH being American, cannot get too far afield managing all those moving parts with my simple charts. So global market comments and charts are for reference.
The World (ex-US) failed at the SMA 50 and has so far held at the major trend marker, the SMA 200. A hold here likely sees me cover my short on ACWX. A failure sees me hold it longer. Simple. Europe appears to be topping out (here we recall the bearish DAX (weekly) leadership chart potentially showing a bull trap and double top), staggered behind the already topped out UK. Now Canada and Australia may be having technical issues as well after having been neutral.

Japanese Nikkei may yet get a test of the SMA 200. But first it would need to fail here at the SMA 50. Hong Kong (and China) are trending down. EM and Asia in general are not much better, trapped below their 50 day averages and their 200 day averages (not shown).
Canada’s TSX-V is on life support. That also means that committed Canadian resources investors are in trouble if they are playing in the speculative end of the sandbox. This could spread to the wider commodity/resources ends of the spectrum as well when OPEC’s oil manipulation runs it course. Oil is driving CRB, after all.

Brazil looks like a short. Argentine bubble is getting a hard smack back to trend. Mexico looks like a short. Africa is trending down, perma style. Frontier is going the way Vietnam directs it. Meh.

Global Stock Markets Bottom Line
Not good technically, on balance.
Precious Metals
Gold has not really begun to establish itself within the macro, as the weekly chart shows. The stair-step higher vs. the highly cyclical copper is notable, however. The macro moves slowly.

The daily version of the chart shows an ongoing intermediate downtrend vs. CRB and Oil, thanks to the price rigging of OPEC+. In my opinion that will be a limited condition. But until it is resolved, gold mining fundamentals are done no favors by a declining gold price in terms of oil.
I suspect that gold my have bottomed vs. stocks, but there is no technical confirmation yet. Friday’s public article does show a great risk/reward for gold in relation to the US stock market.

Gold is trending moderately up vs. most global currencies, except the Swiss Franc, which makes sense since gold and the Swissy often travel a similar course.

Gold’s big picture view is fine. Very fine, actually. The monthly log chart says “patience, grasshopper”.

The monthly linear chart wants to know if gold will hold the 1900 area support or one of the lower ones prior to attaining all-time highs. Either way, that is a large Cup and very volatile and messy Handle. Our long-term projections is 3000+. And no, you will not find me among the ‘gold to 10,000+’ touts. It may go there one day, but we will take it a stage at a time and at this stage why don’t we simply get a break above 2100 before getting too hyped up?

Gold daily held below resistance and faded the SMA 50. It now needs to hold the uptrending SMA 200 to avoid a date with the ‘must hold’ zone. If that zone is lost it would open the door to a test of the lower support levels in the 1700s, which would coincide with the next support area at 1775 (+/-) on the chart above. If the macro comes under liquidity stress, don’t discount the possibility.

All silver needed was for me to put up that bullish weekly chart and its target of 35 last week, in order to tank. Way to go, G! Regardless, the main theme for silver has not changed. It is in correction and technically intact.

Nor, necessarily, has the weekly pattern’s objective changed.

However, if silver fails to hold the two previous lows on the daily chart above, the Gold/Silver ratio (GSR) may break out and wreck the inflated macro. Never knowing when to discretely leave a shtick behind, I present a chart showing where the 3 emojis of doom were placed on a TradingView version of the chart. This update on USD and the GSR shows them in their original state.
Isn’t it uncanny how the GSR joins so many other indicators at decision points. In this case the decision is whether or not GSR is going to break out and ride with USD (at a decision point of its own, see linked update above and segment below) and ruin the macro or drop again and benefit the inflation stuff, especially. Markets work in slow motion, and it is up to us to keep that perspective and not get impatient.

I went by gut on Friday and took off my miner short (DUST). But that means I’ll have to either re-short or do more selling if GDX remains below the SMA 50. Frankly, I think I made a mistake. Won’t be the first and won’t be the last. But with positioning so light it’ll be fine. If the sector goes wrong in the short-term I’d like to play it and capitalize. If it goes right, I’d do the same.
But either way, the gold stock sector is like like most other markets, in correction and in this case in correction since the spring and locked below the crossed moving averages. This prompts the question, was the late August bounce THE obligatory move in the opposite direction of the Death Cross? If so, it was a relatively weak one.
The chart shows two open gaps, the lower of which I give good odds of filling either sooner or later and the upper of which should easily be taken out and left far behind after the macro turns and the gold miners take a real rally contrary to most of the investment world, after a major low will be made.

Precious Metals Bottom Line
The rally never was to be taken overly seriously as long as it ran with risk ‘on’, cyclical and inflation sensitive markets. The reasons have been belabored and will not be belabored again at this point. The sector was a leader coming out of the Q4, 2022 bear phase and led stock markets by a couple months into the current correction.
The Gold/Silver ratio should be instructive about market liquidity and the USD in the short-term and hence, about all the stuff that has been ‘anti’ USD, including the gold stock sector.
Big picture, gold is fine and in the next macro phase, whether it be deflationary or stagflationary, when economic decay sets in gold should outperform. As such, quality gold mining companies, on balance, should leverage that out-performance. But first the macro will need to continue grinding into a shift. And if the deflationary scenario plays out the buying opportunity may come significantly lower than if the stag plays out.
Final note: Gold and Silver Commitments of Traders actually saw gold’s CoT degrade a bit last week while silver’s CoT pretty much went sideways. Point being that while CoT is biased toward contrary bullish there remains room for a normal correction to continues as well. No change in general status.
Commodities
I think we are pretty well established in the view that the commodity complex (CRB) owes a temporary debt of gratitude to the manipulators at OPEC+. The daily chart makes clear that CRB is being driven by oil. So if oil is being driven by OPEC+ said price manipulators are driving the CRB index. But here’s the point; it’s not real. It’s manip out of desperation to keep oil prices up (and oil bulls on the tout). Let’s keep it real.
The technical targets are CRB 305 and WTI 105. Now, can the manip do that heavy lifting? Will the Gold/Silver ratio fail and help out by dropping along with USD? Stay tuned. But look at those downtrending Industrial Metals and Ags. Commodities are generally bearish. Oil is what’s painting the index bullish. So buyer beware or buyer at least be cognizant of who is currently driving the bus.

As part of my decision to start selling items and taking profits, even on stocks I cared about (e.g. DVAX, ANET, etc.) I did the same in the Uranium patch, deciding not to be greedy. U will be a trade just like anything else until macro resolution. Make no mistake, each of these charts remains bullish. I don’t care. Give me my profit! That is what I am here for.
The exception is FUU.V, which is still held and not coincidentally has the least excessive chart as measured by distance from the 50 day moving average.
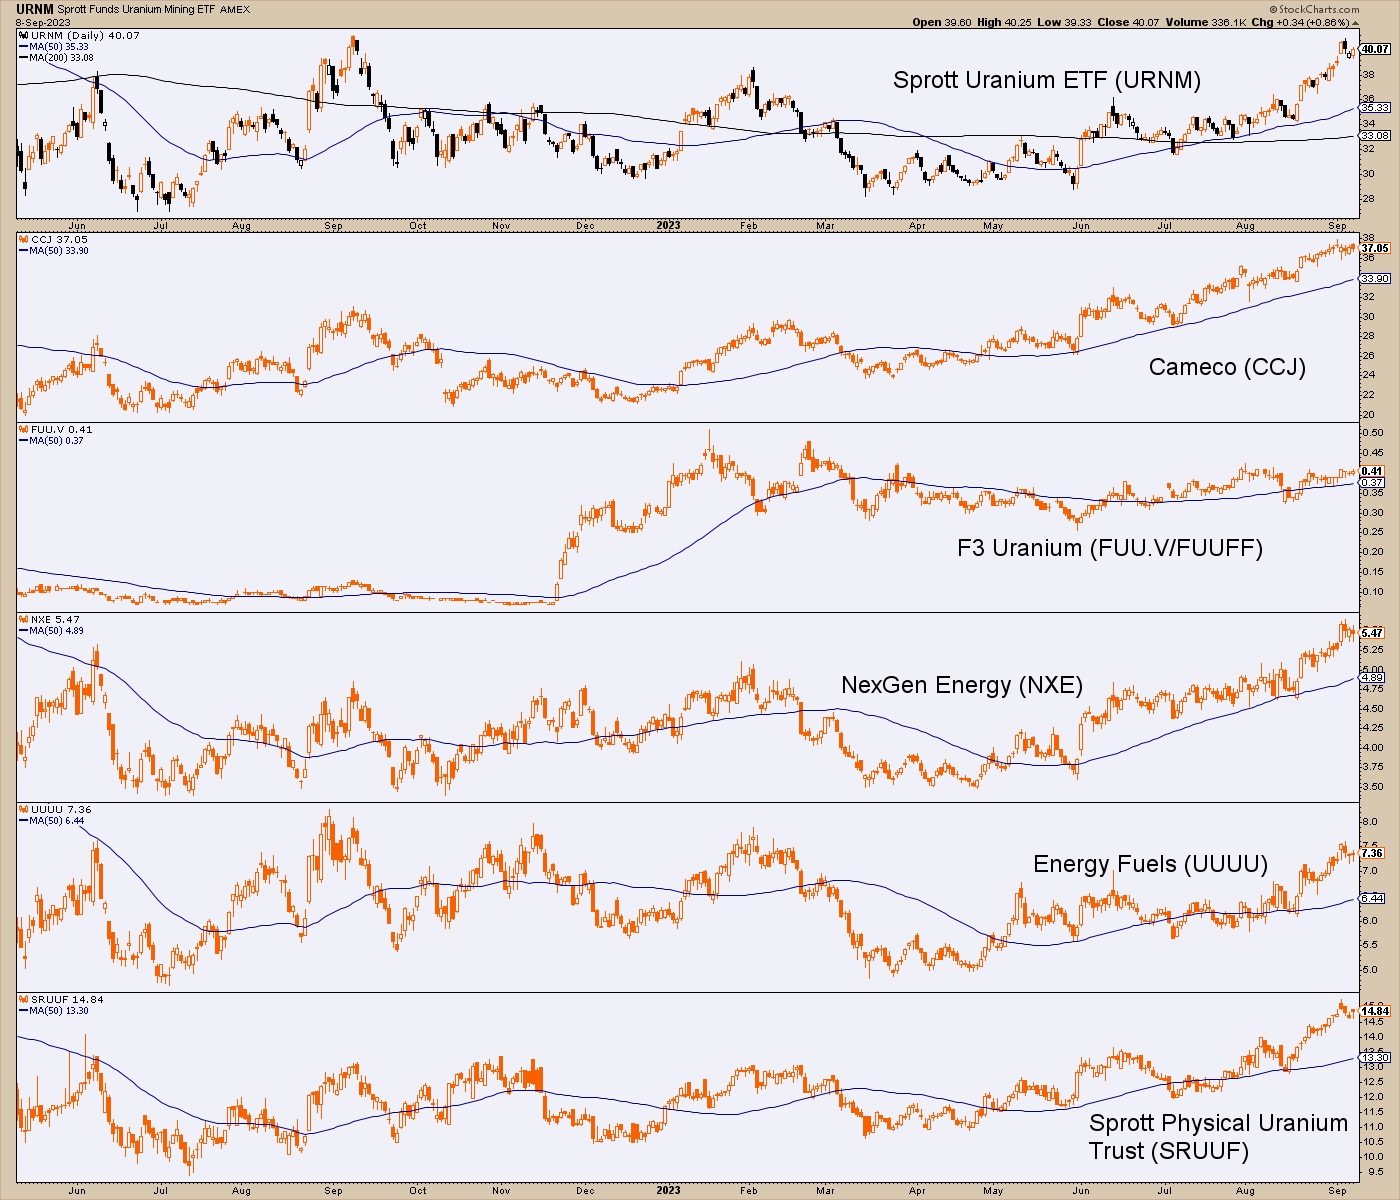
Meanwhile, the other stuff is still in Drubsville. This lends credence to the assertion that commodities and commodity/resources related equities are bearish on balance, no matter what the OPEC-painted CRB says.

Bottom Line
Sector is bearish and will either get clobbered if USD and GSR breakout and rise impulsively or go hard bullish for a trade (beyond Energy) if USD and GSR drop again. Meanwhile, the OPEC>OIL driven CRB index allows commodity super cyclers to ply their trade on the surface of things.
Currencies
With the understanding that USD is in a bull market, no matter what happens at the near-term decision point, let’s again review daily USD and said decision point. Uncle Buck is…
- Above former resistance, tentatively turning it to support.
- Overbought to the degrees that halted the last two rallies.
- Looking upward at the key decision point of 105.87, which is the March high coinciding with clear resistance touch points (red arrows).

When forecasting a bounce that could be more extreme than most would have figured back in July, I did not believe it would go this far. I don’t know why, though. The market continually tells us that extremes will be pushed and pushed hard. That is what Unc is doing right now. I wish I would learn that lesson as a market robot and sublimate human Gary. Amid all that de-dollarization crap OF COURSE Uncle Buck was going to rebel and rebel hard!
Bottom Line
USD is overbought below a key macro decision point. If it bull traps and fails here the inflation trades and some global markets and US sectors would likely get a big boost. That would also likely be attended by a failure of the Gold/Silver ratio. If it goes the other way, the macro changes and everybody figuratively gets out of the pool because there’d be a figurative turd in there!

I believe the next big macro move will see the 2 Horsemen of the Liquidity Apocalypse rise impulsively, but the question – as with the US Market as noted in the open and so many other markets and indicators – is in the interim. Let’s let it play out, as I for one am not going to be caught guessing. There will come a time before long to lean into a tradable view.
Longer-term we’re either going to deflate impulsively (USD and GSR rise) or Stag, or heaven forbid, Crack-up Boom (von Mises) in a hyperinflationary blaze. I am open to either of the first two, but also respect old Ludwig von… In my opinion it’s all on the table after decades of remote inflationary policy control juxtaposed against the broken Continuum of disinflationary bond signaling.

Portfolio
Savings balanced by gold.
Trading Account: Short ACWX & SPY
Roth IRA (non-taxable, no contributions)
Cash (and equivalent) is about 91%. I like that, especially given the general high risk and income being generated by cash on this cycle as opposed to others during the disinflationary age of Inflation onDemand (ref. chart directly above), when first Greenspan and then Bernanke, Yellen, etc. punished savers at every turn in order to bailout and reward speculators, asset owners and in my not so humble opinion, ruin society by hard wiring in the dynamic of rich richer, poor poorer through policy.
As noted in the opening segment, there are a couple of nearer-term options. One quite bearish after a possible short-term renewal of the rally, and the other quite bullish prior to the inevitable bear. Hence, today’s little cash way station until the dust settles on multiple market/indicator decision points.
Anyway, looking ahead the main theme is for a profound change that I will not pretend to know the full nature of just yet. But we will be ready for it and if/when the pieces come together for a low risk opportunity to be very contrary what is today’s consensus, catching a real macro turn could be something to look back upon as something epic for many years to come. I will try my best to interpret it in real time if not ahead of time.

Cash & income-paying Equivalents are at levels that are right for me and my real-world situation. Your situation is different. Cash will be adjusted as needed.
Refer to the Trade Log under the NFTRH Premium menu at nftrh.com for trade info, if interested (not that you necessarily should be). Also, you can follow at Twitter @NFTRHgt for notice of updates.
NFTRH is not to be distributed to third parties without prior written consent
Notes From the Rabbit Hole (NFTRH) is a weekly market report in which we provide analysis on financial markets. We make every effort to provide accurate and high quality content, but this analysis ultimately represents our opinions and these opinions are provided without warranty or guarantee of any kind. See full terms & conditions of service under the ‘About’ heading in the main menu.