
Still Calm
Various pictures indicate a still-calm underpinning beneath the market’s surface. I know that it is unpopular to issue such declarations while everyone is alarmed (those stoking hysteria gain much more attention), but my job is to illustrate what I see, not what my emotions want to see or want you to see. Anecdotally, I am getting more and more incoming feedback of the tin foil hat variety, where nefarious evil is perceived around every corner.
“They” are always going to win because “they” control the markets. The government is lying about the payrolls data. You can’t trust the charts because “they” are painting them as needed. “They” are manipulating gold and commodities. On and on it goes.
Well, “they” are manipulating. The government surely cooks its share of fairy stories. The large media cooks more than its share of fairy stories. But importantly, so does the small media. The small media includes the likes of your letter writer and other reputable independent sources; but it also includes very dangerous independent sources throwing spaghetti against the wall to see if it sticks. In other words, if you’ll eat it, they’ll write it. Beware the tin foil my friends.
What I see is that yes, it’s a mess out there. Yes, everyone seems to be in the game manipulating through word and deed. But what I also see are historical precedents when we have obeyed the market signals we have gotten and ended up the better for it.
In the crash of 2008, while gold bugs were loudly and emotionally crying foul (excuses for the follower bugs to digest) we noted that the fundamentals were slamming into place even as the inflation bugs puked en masse. That worked out.
In January, 2013 we noted that the Semiconductor industry was gearing up with a new trend of positive book-to-bill ratio data, implying forward growth for the sector and as a cyclical leader, an eventual recovery in manufacturing and employment. That worked out. On cue, I might add.
In Q1, 2020 we took note of the Federal Reserve taking extreme measures to stop the liquidation of markets, realized money supply would be ramped through bond monetization and other aspects of the economic alchemy known as MMT (modern monetary theory, which I flip over to its true self, TMM or total market manipulation).
My point is that sure, I get it. It’s a mess. It’s concocted, controlled (to a degree), manipulated and screwed over in many different ways. But looking beneath the surface in an almost forensic manner we will find the breadcrumbs needed to indicate caution when things are going to turn. Today, as the Q4-Q1 rally grinds (and I do mean grinds) on. It could end on Monday, or it could go on to a point that could gall stock market bears. The bottom line is to let the market – manipulated mess that it is – speak. When some emotional guy with a megaphone is speaking he is invariably shouting out false signals if he is using his bias filled brain rather than actual indications.
Diatribe complete, let’s look at some signals indicating “still calm” or at least “intact”.
Our simple US stock market leadership chart shows the trends up in the Semiconductor sector, which is leading SPX and NDX from the October lows and notably, big Tech still leading big broad (NDX/SPX) thus far in 2023. “They” can and will influence markets, and that is precisely why we need internal views of markets like this. When they break down, it will be appropriate to raise caution. We end an emotional week of Fed hawking and a bank failure with the situation intact from this perspective.

However, intact above is not intact in the BKX/SPX ratio. This is definitely an ongoing forward caution on the US market, as it was trending down even before last week’s down spike on the Silicon Valley Bank blow up.

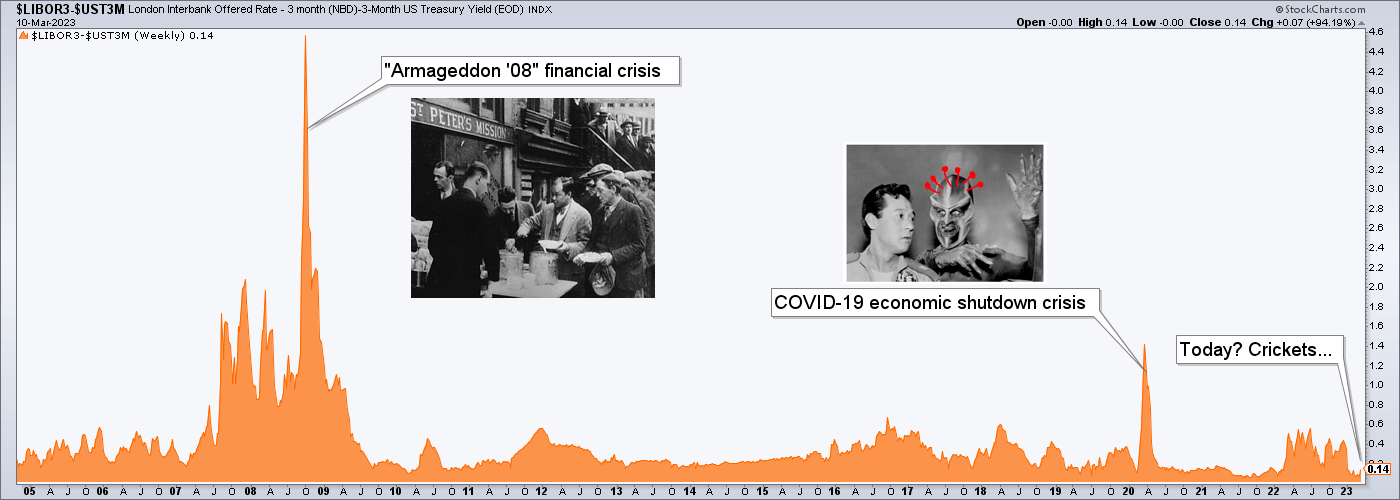
However, hat tip to Steve Saville for this indicator, the spread between Libor (inter-bank interest rate, which NFTRH’s earliest subscribers may recall we used often during the 2008 financial crisis) and 3 month T-bill yields. I’ve created a chart of the spread and added my artwork for effect. Last week closed to the sound of crickets on this chart, even if the sound of doomsaying was heard loud and clear in large and small media alike. Manipulated markets or not, if a macro blowup were imminent, this picture would not be so sedate. Maybe on Monday it will change. But the point is that it has not changed.
When liquidity stress comes upon the markets junk bonds will break down vs. higher quality corporate bonds. The daily chart shows the ratio got hammered on Friday with the systemic stress impulse. But the major daily trend (SMA 200, black line) has not yet been broken and it is up. This will bear close watching, obviously.

The ratio of junk to Treasury bonds also logically got whacked on Friday but it too is in an unbroken major daily uptrend as it looks to test that trend at its SMA 200.

A related chart that we have been keeping tabs on lately measures spreads of high yield (junk) to Treasury bonds. When the spread rises, negative pressure is indicated. There’s a little bump there. You can see it if you look closely. It looks like a gnat on an elephant’s butt. The trend, however, is still down and calm. Why not wait for it and others to make a definitive move before getting overly emotional?

Finally, the 10yr-2yr yield curve, which we have shown recently to be inverting to levels not seen since 1980 or so, got a bump on Friday. But it too maintains its main daily trend, and that trend is down. Again, could go hyper spastic on Monday but more likely will not. An ongoing inversion is not the time to worry about systemic stress. The subsequent curve steepener, after something breaks, is the time to worry.

Bottom Line
Given my extremely high cash levels I hope you realize that I am putting forth “calm” analysis above that is contrary to my positioning. That is due to my view that despite our being on the Q4-Q1 rally theme since November, this is a bear market rally. I want it to prove that it is ongoing before I deploy further. But beaten up though it is, said rally is not broken by index technical parameters. What’s more, using SPX as an example, it has a normal upside objective in play and an outlandishly bullish one as well. A real FOMO suck-in potential.
But first the market rally has to stay intact by those technicals and by would-be caution indicators like those above. The indicators show risk (as an example, the yield curve is so deeply inverted that the risk of a coming inversion is rising strongly), but in general it is risk as yet unrealized. On Monday we may well realize it. But that is unlikely. We will realize it when the indicators say so.
There are a lot of entities out there using any signs of fear, loathing and hysteria to promote whatever their bias or agenda may be. We will go by what we see, not by what we hear megaphoned in from the Hype-o-sphere. Okay now, on to those technical parameters and views on the stock market which, using SPX as the broad guide, shows technicals in trouble and approaching the “bear back on” zone.
US Stock Market
Let’s keep it simple and review the broader picture (the multi-sector SPX) with the realization that Semi and Tech are still leading (and insofar as current trends hold, of more interest). SPX daily dropped to and through the 200 day moving average to end the week. How about that bullish “golden cross” 1.5 months ago, eh? Comical how many stupid bromides get lapped up by many casino patrons.
SPX has lost the preferred “comfort” of the SMA 200 and now looks to the ‘do or die’ parameter where it should hold the December low at 3764.49 or likely resume its bear market. What a mess. But it’s an intact mess. NDX and especially SOX are better as they test support and their respective SMA 50s. But I don’t want to be casual about the fact that this market is on warning from a technical perspective. Personally, I want to be cashed and taking interest. Not getting run like a hopeful fool.
Hold the parameter and the Q4-Q1 rally on life support may one day breathe on its own. Lose it and the bear market resumes. Pretty simple. If the rally does hold up, recall that the next upside objective is the 4219 gap and the resistance just above it.

The weekly chart has long since lost the right side shoulder of the would-be bullish Inverted H&S. It has also lost the trend line (orange) breakout, which also serves as the pattern’s neckline. Ah, but a man staring at the chart who wants you to be bullish will advise you of the “complex inverse head & shoulders” that he sees. He will enthrall with mysterious word “complex”. But what he means if he is being honest is “I have no effing clue because the thing grew an extra hump… but oh wait, there is a left side extra hump so we have “symmetry!” *

* “Symmetry” is another fancy word TAs sometimes use when trying to get you to see the things they think they see.
Bottom Line
SPX is approaching make or break, but its leaders are still intact. With FOMC upcoming and now the hawk view in at least a bit of question (Treasury bonds ramped up – yields down – on Friday) it is advisable not to jump in bearish just as it is also advisable not to do so bullish until/unless the thing takes back some technical parameters. Oh and cash is paying out. Watch the daily chart’s downside parameter of 3764.49 and on the upside any attempt to re-take the moving averages.
It could get pretty wild leading up to FOMC (March 22nd) with a good slate of important incoming economic data coming in the interim. I am not predicting anything but for example, what pressure relief might the Fed feel if this week’s inflation * readings come in cooler than expected?

* These are actually the effects of inflation, with the actual inflation by money supply perp’d by the Fed in 2020.
Global Stock Markets
Global got dinged on Friday as well, but the balance of the world (ex-US) was firmer in relation to the US, as the USD dropped on a little Fed dove impulse due to the hysterics about the bank blow up. Here is ACWX and ACWX/SPY. The nominal ETF may seek out the daily SMA 200 area for support.

ACWX/SPY bounced a bit but still looks suspect. By extension, a failure here could mean new strength in the US dollar, by which global has had more pressure than the US. Uncle Buck, by the way, dropped on the hopeful Fed dove knee jerk as SV Bank hit the news. But the USD uptrend from early February is intact.

Precious Metals
Okay, so if Friday was a knee jerk to ‘Fed dove’, to systemic meltdown and to a general 2023 ‘we all gonna die!’ framework, then gold and the miners’ fundamentals improved in a meaningful way. If it was just a brief knee jerk (that’s all it is at the moment, ref. the indicators in the first segment) then the macro funda are still in the process of turning.
Gold only corrected to the first support level before the hype drove it upward on Friday. If the banking system is ending and “we all gonna die!” then it could keep going and assume its preeminence within the macro mess. But… the intact indicators in the opening segment.
On the chart, RSI has ticked positive and I do like the look of the still negative MACD, which is trying to trigger up. But gold is at important resistance right here at the SMA 50. Until that is taken out last week’s excitement should be tempered. And even then, we should never get excited, eh? Too many bugs use excitement as their primary view when not wallowing in the manic opposite, despair.

Silver dropped into the most extreme “normal” support we originally noted as it was clustering below resistance at 24.50. In a sign of a market working the way it is “supposed” to, you might recall that 24.50 was our upside target back in Q4. The silver price is at very important support and should hold 19.50 to avoid more serious issues. I came close to adding PSLV last week but with the bounce decided to hold off. Silver, like gold, is at resistance (in this case defined as the SMA 200 and clear lateral traffic).

HUI tried to bounce from clear support, but stalled at its SMA 200. Hence, the major daily trend is down. It is important to note that regardless of what the price of HUI does, gold miner fundamentals will improve vastly if last week’s fear and loathing results in breakdowns in stock markets (including banks, obviously), commodities and the risk ‘on’ world in general. The miners would leverage gold’s improvement relative to those things. We had an update on Friday with some pictures of what would need to continue macro funda wise.
As to the chart, if things do not reverse upward from here, which is not yet indicated, the GDX daily chart we’ve been tracking advises its gap down in the 22s, which would mark HUI in the 180s. These downside objectives started out as “low probability” but I was initially wrong to call it low probability. It is higher now. But current support is very clear as well, so for now we’re still managing the next support zone of 200-206.

Let’s look at the HUI/Gold ratio, which is in breakdown mode. Whether or not HUI will test the November lows the HGR appears to want to do just that. When this indicator bottoms with HUI at a logical support area the next buy could be set up.

Precious Metals Bottom Line
Gold is fine. It endures. Silver is correcting in preparation for the next low. Last week gave us a glimpse of what a turn to positive macro for the gold miners would look like as gold went up on the systemic stress impulse. But that was a knee-jerk.
Tune out the inflation bugs because they are wrong. Always. They were puking en mass in the Q4, 2008 and Q1, 2020 market liquidations. When the macro does fall apart and the macro indicators show a real turn to the upside the miners can theoretically still get whacked because… the inflation bugs! But that will also be the turn to the proper fundamentals and if we are lucky enough to buy a low (as dramatic as those two previous events, or more likely not quite as dramatic) and the macro flips at the same time the play is going to yield something special (HUI big pic target of 500). But the thing is, you need to be intact in order to have that opportunity. The Fed is paying us to stay intact while we await the market’s indications.
Commodities
- CRB Index: Remains in its downtrend below the intermediate daily SMA 50 and as noted previously, is also turning its major daily trend marker, the SMA 200, down.
- Oil, Gas, Energy Sector: WTI oil is still below its SMA 50 and hence, not actionable from the bull side. But nor has it broken down. So it could still be a bullish consolidation of the big upside in H1, 2022. Arguing against that is the SMA 200, which has turned down. So if oil (current: 76.68) does rally its SMA 200 (current: 88.26) would be important resistance. I am short Energy stocks via OXY and XOP. But only tentatively so, because if the markets do find relief I don’t think Energy will go down on its own. OXY and XOP do still look technically vulnerable though.
- Doctor Copper & Industrial Metals (GYX): Doc has been in corrective consolidation since mid-January. Doc’s industrial bros have been weaker and are getting worse. GYX dropped back below its downtrending daily SMA 200 on Friday and ticked a low of 436.25 before recovering to close at 440.94. Why make a big deal about that? Well, it may not be a huge deal but it is notable that a take-out of the January low of 437.54 would be a breakdown marker. It’s important.
- Uranium: u3o8 holder SRUUF went from suspect to ugly on the short-term. Meaning its daily chart is taking on water. But the big picture is of the u3o8 price in bullish consolidation (remember these things can last months, if not years) of its break upward out of a long base. The sector (e.g. URNM) is dropping to test its December lows. Not a good short-term look, but still very much on my watch list. Here for your reference is the long-term u3o8 price as of February 28th. The price can ease significantly and still maintain the big picture breakout based on the supply/demand fundamentals that those more learned than I believe are in play.

- Specialty Metals/Materials: REE got clubbed on the market knee-jerk along with most other markets not named gold and silver. For similar reasons to Uranium, I keep Rare Earths producer MP on watch at all times. Future supply/demand for critical materials and in the case of MP, a US based producer. That will be important some day in this ever more contentious world. The Lithium price continues in a hard correction from bubbly highs. ALB and LTHM are the watch list stocks and they both got cracked hard and are technically vulnerable. Palladium is ever deeper into its downtrend that began after the blow off high a year ago. Bearish. Platinum is still relatively stable, trying to hold support at its 200 day moving average. Interesting.
- Agricultural (GKX): The index broke down hard from the daily SMA 50 after failing to even test the downtrending SMA 200 on the upside. Associated stocks MOS & NTR had bounced hard and got killed last week back to technically vulnerable territory. No interest in this sector even as the consumer continues to get b blasted by higher food prices.
Commodities Bottom Line
No current interest. That interest is for inflationists, supply/demand dorks, story tellers and the readership/listenership that hang on every bullish word. My opinion? Commodities are called “commodities” for a reason and that reason is that they are commodities. Commodities – in my experience as a manufacturer, are cheap materials or readily manufactured products that hold little value on their own (exception being rare and/or critical materials that are strategic to the technologies of the newer world). They go into other things. They are some of the components of those things. But they are not the product itself. If the world flips deflationary commodities will drop. If not, and a new inflationary age is upon us, they may rocket. It’s just the way of the sector.
As an example, let’s have a show of hands as to who actually believed the “peak oil” promotions of 2007 as perpetrated by T Boon Pickens and lesser add-on promoters like Chris Martenson and a whole host of theme jumpers of the time? Ooh, they are amplified in the media… they MUST know what they are talking about!
As to the above, supply/demand does strongly enter the equation. If a commodity is in short supply (like Cu has been), then its acquisition value improves. When there’s a glut, it drops. But I believe that retail investors are fed Fairy stories about commodities, glorifying them as something greater than they are. Like when they tell you to sell paper and hold “read” things. Land is a real thing, it is not a commodity, and it is worth holding. It is not readily available. Lumber is a commodity that is currently not seeing good demand and the prices have tanked.
I would try not to let the promotions of others – especially those who have never worked in industry or worse, only worked with a white collar on – color your views. Okay, this bottom line turned into a diatribe. Expect more of them as we continue on our uncharted forward macro course.
Currencies
USD got clubbed on Friday as the ‘Fed dove’ knee-jerk ensued as SVB blew up. Ironically, USD, the ‘anti-market’ dropped as most other things did too. But the Gold/Silver ratio indicated still-elevated pressure and Goldilocks (at best) and a coming market liquidation (at worst). The play would be that even if the Fed were compelled to flip full on dove, that could happen because if markets are liquidating the bid for Uncle Buck would be implied.
USD is looking for support at the SMA 50 after not quite achieving its upside objective at the 38% Fib and the SMA 200. The 2 Horsemen of the (would-be) macro Apocalypse are still riding but as yet they have only ridden to the 3 Bears’ house, within which Goldilocks is enjoying her “just right” porridge. Could change on Monday, could keep going, as with so many other trends not yet broken.

The cavalcade of global currencies shows that gold’s closest currency pal, the Swiss Franc popped hard on Friday. Logical. Everybody else continues to correct since early February, which is not a coincidence given USD’s rally that started at the same time.

Market Sentiment
Smart/Dumb Money indicators show Dumb money dropping hard while Smart indicators are not really eating themselves much stock market. This has now dropped further than what we previously noted as a routine pullback in sentiment to reset. It’s getting into the type of territory where negativity could become self-reinforcing if it does not ease soon. Given the lack of ‘smart’ upside, this still appears to be a caution signal on the very short-term.

- AAII (Ma & Pa): Still in hard pullback mode, running from the market’s recent stresses. Becoming contrary positive again.
- NAAIM (Investment Managers survey): Still aping the S&P 500. Enthusiasm came out of the picture a bit but there is no full scale breakdown in NAAIM sentiment (as of March 8). Feels like a caution flag.
- Investors Intelligence (Newsletters): Pulled back as of March 7th and really not indicating much as it really had not previously joined the enthusiasm of Dumb money and NAAIM.
Sentiment Bottom Line
Over-bullish is long since gone. That was the correction’s job. But neither is sentiment at very extreme bearish levels, and with the SPX downside parameter within hailing distance, that does not seem positive. I know what is positive, however. Cash paying income until things get sorted out from the bull (buy) side or the bear (short) side.
Portfolios
Accounts are balanced by gold.
Trading Account: Short OXY & XOM
Roth IRA (non-taxable, no contributions)
IRA holds 3 gold stocks, 3 Semi stocks, 3 Biotech/Pharma related stocks, a Cloud security play and a Tech giant. Most of all it holds cash, which the Fed has made of value again. I mean, with trillions in debt the bedrock of our economy this government paper is worthless, eh? But it is of value as a tool, eh? If rare opportunity comes about, which 2023 has the potential for, this tool will be used to capitalize on the situation, whether from the bull, bear or gold bug side. Right now the Fed is improving our current primary tool. Improving its ability to work for us when it is time to deploy. Currently that tool is 91% of the portfolio.

Cash & income-paying Equivalents are at levels that are right for me and my real-world situation. Your situation is different. Cash will be adjusted as needed.
Refer to the Trade Log under the NFTRH Premium menu at nftrh.com for trade info, if interested (not that you necessarily should be). Also, you can follow at Twitter @NFTRHgt for notice of updates.
NFTRH is not to be distributed to third parties without prior written consent
Notes From the Rabbit Hole (NFTRH) is a weekly market report in which we provide analysis on financial markets. We make every effort to provide accurate and high quality content, but this analysis ultimately represents our opinions and these opinions are provided without warranty or guarantee of any kind. See full terms & conditions of service under the ‘About’ heading in the main menu.