Well, inflationary signals are back on to varying degrees, if not the reflation trades across the board.
The inflation rate continued to climb in June.

This as our indicators had been fading into the summer cool down as expected. Today a Fed head is out talking about bond purchase tapering, the US dollar is resuming its rally and inflation indicators are popping upward.
The 30yr yield, AKA our Continuum indicator, may well be holding the right side shoulder of its inverted H&S. Yields are responding to the inflation data. Here’s the daily chart holding the SMA 200.
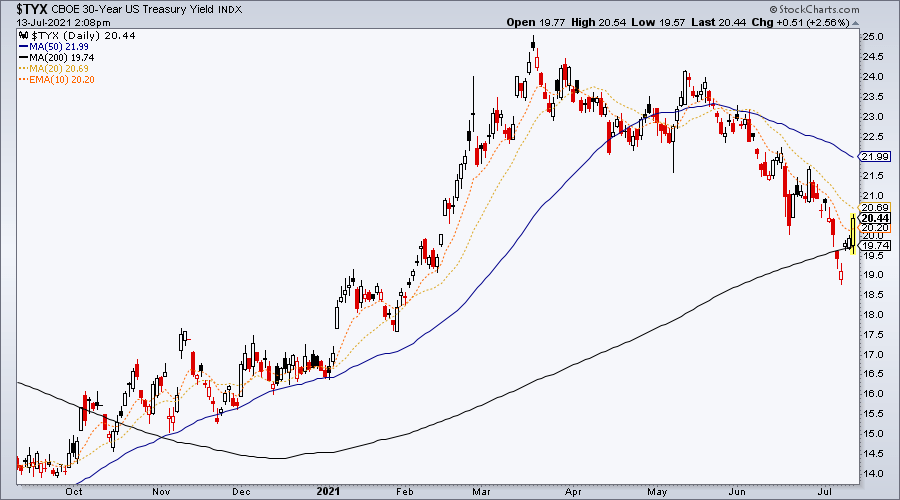
For perspective, here’s the monthly ‘continuum’ view. The right side shoulder does not need to form any further. In other words, should the yield begin to rise now there is no downside objective still standing in its way.

Meanwhile, RINF is bouncing but not yet conclusively exiting the consolidation from the May high.

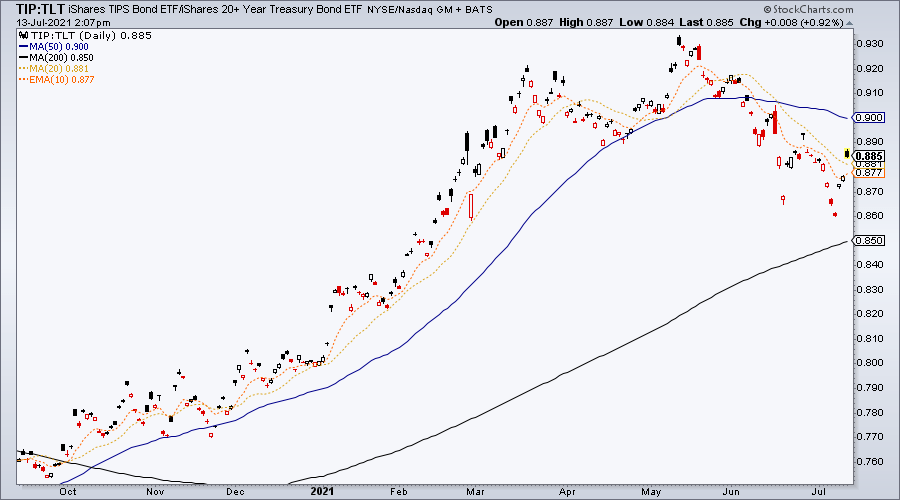
TIP/TLT is similar. Popping on the inflation data but not yet exiting the correction.
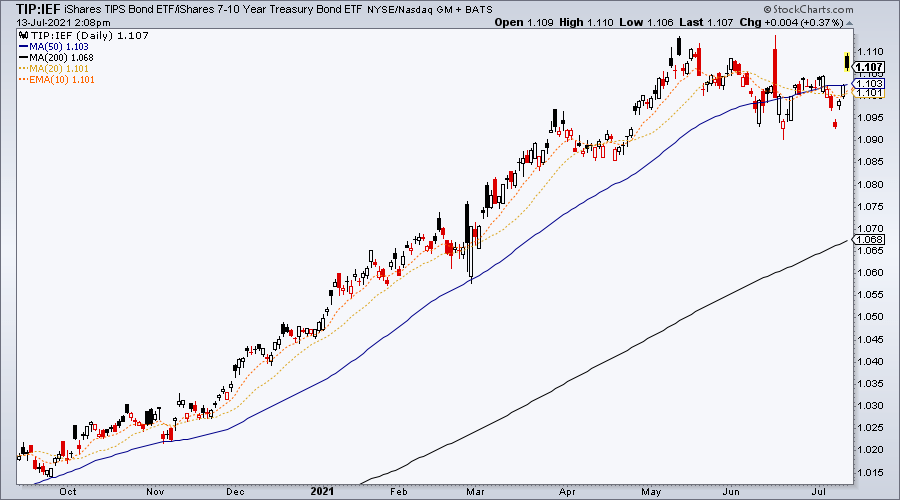
TIP/IEF is the one looking like it could lead the others. I do not know what the dynamics are that have kept TIP firmer relative to IEF’s 7-10yr bonds than TLT’s 20+ year bonds, but on balance inflation expectations look constructive to resume upward.
Now, is it as simple as the reflation trades resuming? Recall that Stagflation is a viable outcome on a new leg up in long-term yields and inflation expectations, if/when it comes about. The Stag is economically negative and that should be considered. Meanwhile, another driver of reflation – and cost pushed inflationary pressures – would be more government spending on stimulus. That is different from the Fed’s MMT/QE, whatever you want to call it, which may or may not be tapered.
A lot of considerations in play, but boiling it all down we can take the above pictures and data as an opening at least for a new leg of the inflation.