IBM popped in January on some news or other and when it dropped to fill the gap I bought it (per the Trade Log), waiting through a bit further decline to test the moving averages and then, this…

It goes ex-div in the next couple of days and that played into my buy decision. But seriously, what gives? It’s an old Tech dinosaur with an AI thing called Watson, who has apparently been sitting on his stodgy ass instead of making tech headway. Maybe this vertical action is telling of improvement there, or something about the new CEO or… maybe it’s just another manifestation of the Everything Bubble. I don’t know because I don’t have the time to be an in-depth stock researcher. It’s a chart (and dividend) thing. I have several positions bought for their charts that looked prospective to make new up trends off of bottoms or long consolidations.
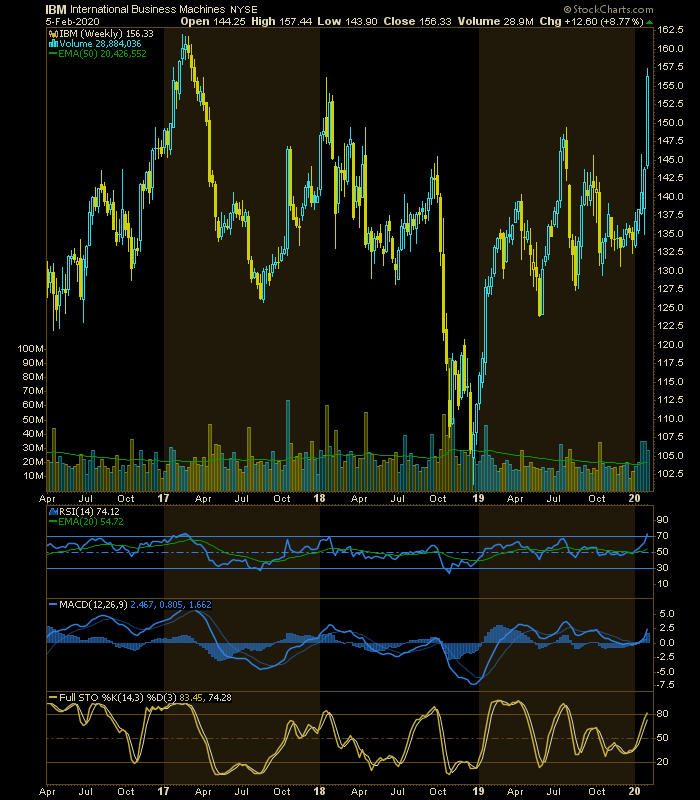
I am holding it for now as part of the portfolio balancing routine, and the weekly chart makes me wonder if maybe it’s got higher to go. I’ll have to think about this. What I think I know is that Microsoft kicked IBM’s ass years ago and it has not recovered even a fraction of that beat down in relation to Softie. But what I think I see is a possible chart launch, not a bubble blow off (hello Tesla, for example).
Subscribe to NFTRH Premium (monthly at USD $35.00 or a discounted yearly at USD $365.00) for an in-depth weekly market report, interim market updates and NFTRH+ chart and trade setup ideas. You can also keep up to date with actionable public content at NFTRH.com by using the email form on the right sidebar and get even more by joining our free eLetter. Follow via Twitter @NFTRHgt or StockTwits.