I got so hung up on future inflation and the global view in NFTRH 543 that I forgot to include a piece on the quant data for post-quad witching phases. This was posted at biiwii yesterday…
The Bearish Aftermath of Quad Witching
The way I tend to go about things, the charts are what they are. The way Rob Hanna of Quant Edges goes about things, the historical data are what they are; indisputable. So the way my analysis goes, it’s a high risk market and we talked about the potential that the SPX rise above 2815 is a bull trap. But that is all speculation against the technical uptrend until/unless it happens.
With the caveat that Quant data fails to prove out its share of times, I had meant to put the historical facts about Quad Witching in front of you for consideration. The data strongly suggest a bearish week upcoming.
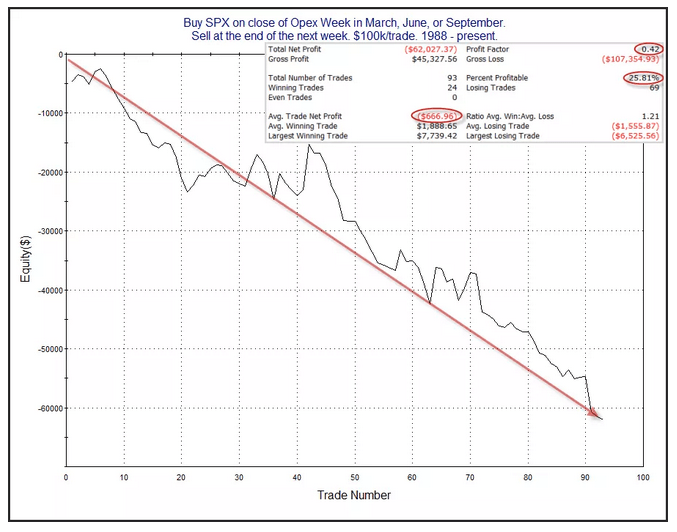
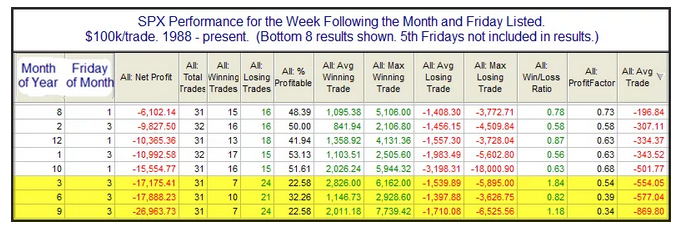
Check out Rob’s article if interested. In the meanwhile, here are his data graphs for your review. This is all short-term stuff (1 week time frame), so take that into consideration as well.
Rob Hanna: “The strong, steady downslope is also supportive of the idea of a seasonally bearish edge. Traders may want to keep this in mind next week.”