A look at the US stock market’s relief rally and another note on the gold sector…
S&P 500/US Stock Market
Folks, as the stock market always seems to do, the parameters have been stretched to the limits. Back on Christmas Eve I was buying thinking ‘boy, there’s gonna be a big bounce coming and I’ll bet SPX can get all the way to 2600 in January’.
And then the reality unfolds, day after day, week after week as the negative perceptions of December were wrung out and the relief of January became the bullish excess of January, leaving the correction as a fading memory. I said then (when projecting a bounce) and I’ll say it now, the job of a relief rally is to change the sentiment profile so as to change perceptions.![]()
So here we are, with SPX having long-since blown through the original target of 2600-2650 and now perched below the next one, which is the SMA 200 (2742). The final target is 2815, beyond which the bear stance would have to be aborted. Also, the first key support level (SMA 50 and the old 2600 upside resistance target) is noted in green.

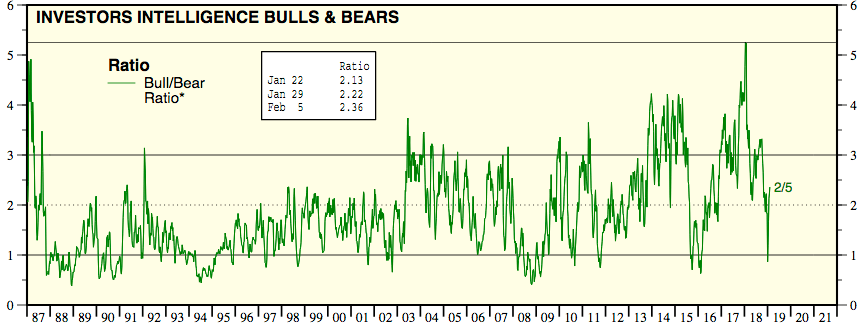
As of Tuesday, the Investors Intelligence Bull/Bear ratio (by way of Yardeni.com) had bounced back quite well. The drop from massively over bullish (what we called a “bull killer” along with the AAII readings of last January) was a real event and a spike was to be expected. While this can spike higher – esp. given the ferocity of the decline – it is now out of the way as a sentiment indicator standing against the bear case.
The VIX has broken below its previous post-September lows and while that opens up an air pocket to lower levels that could go with a manic bullish sentiment burst, as Sentimentrader notes…

The data associated with this condition are not good for the bulls. From Sentimentrader…
The table on the next page shows every day since 1990 when the S&P was still below its average, yet the VIX sunk to a 3-month low and was below 20 at the time. The returns were not good on any time frame, with the caveat that there were really only 5 distinct signals, with several days clustered around some of them. Most notably, over the next six months only two days managed to sport a positive return, and those were small.
The risk/reward is possibly the most negatively skewed of any study we’ve looked at in years.

So we have a price target for SPX as anticipated in advance (after the adjustment from 2600-2650) and historical data to the current situation with respect to the VIX that are not bullish. That can only mean it is time for caution on the stock market’s relief rally. That is not me saying that because I want the analysis (that this is only a relief bounce and the bearish view is not done yet) to be right. It is the numbers saying that.
Smart and Dumb Money indicators are not wildly extreme but as with the Bull/Bear ratio above, have certainly recovered to a point of viable termination if there is to be a double dip for the bear case.

Gold Stocks
In looking through various sentiment graphs for this update I noticed that all it has taken was a gentle pullback in gold (Sentimentrader’s data still indicate gold as BEARISH from a contrarian standpoint, meaning sentiment readings are over bullish) and barely a pullback in gold stocks to get gold stock investors off of what was a strenuously over bullish stance a couple days ago.

As I’ve noted previously, ST’s Optimism data jump all over the place and that is amplified in the gold sector, which itself is very volatile emotionally.
Hence, I am very prepared at any point to release the partial miner hedge noted in last night’s update. The best fundamental view for the sector after all wants the stock market to roll over again and from what I see in the update above, the risk of that happening is in play at yesterday’s close.