Short-term contrarian sentiment has improved this week. With the ongoing consolidation in stocks (red arrow), the dumb money has dropped and the smart money has popped. This is of minor short-term significance but it goes with the theme that the market is sustained by these little bursts of anxiety that crop up. It seems to feed off of every little nervous twitch in investor sentiment.

Sentiment extremes continue to be non-existent and beneficial, as noted in the weekend report.

The general risk profile has gone back to vanilla, with gold retaining its contrarian bounce potential.

SPX has made a normal consolidation to the SMA 50.

Europe is dwelling at the gap-fill area. A higher low (to April) remains key.

EM was a disturbing short trade in which I turned a small profit into a loss. The lesson here was in shorting something simply because it had risen to target and due to a bullish view on a completely different ‘asset’, the USD.

The World consolidated to the SMA 50 and worked off the overbought status. It did the same thing in April and then look what happened. This is how this market rolls; very systematic in its jumps to overbought and then its consolidations to relieve it.

Commodities have resumed bouncing this week. Among the interesting items are copper (as noted) and the uranium fund, URA (as speculated upon in #455).

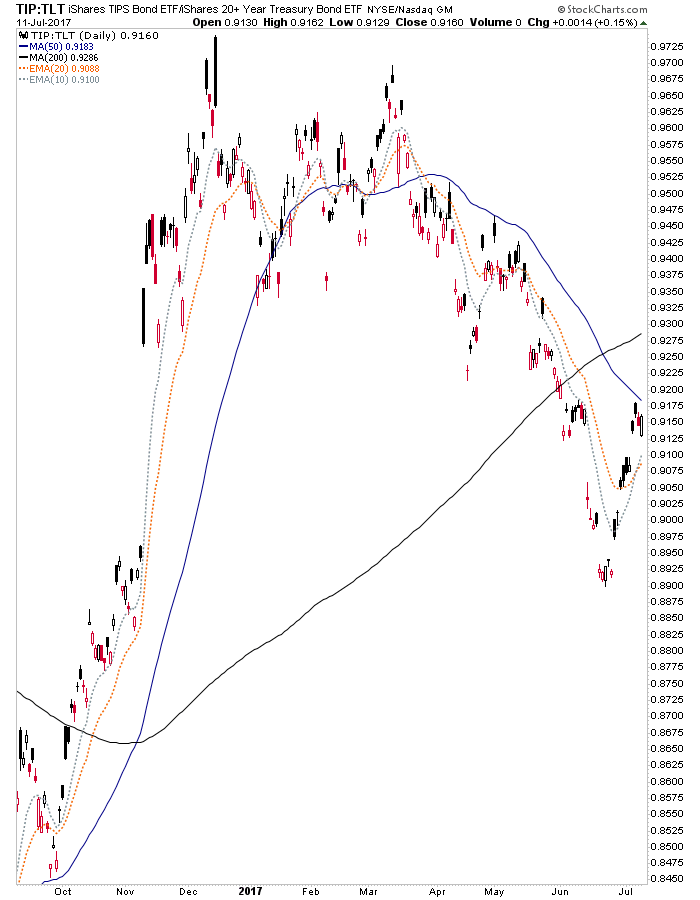
All of this has come with a bounce in inflation expectations as yields rise and USD fades.
USD has dropped to support, but if it is to bottom it appears to be a process, not an event.

This weekly chart shows USD vs. its developed market competition, the Euro. I remain short the Euro because this support level is still in play. But typical of markets, things always seem to get stretched to an extreme. A breakdown in USDEUR (not to mention other currencies) changes the global game. But as of now, there is no breakdown; just a rough looking technical picture.

Notice how the big black candles on the gold/silver ratio are routinely followed by downside when they appear during up trends. These represent spikes in market anxiety that is reversed promptly into relief. Last week we got another spike and this week, relief. This applies to the broad market and more acutely, the precious metals and commodities, which are bouncing.

Gold made a lower low to May off of what we’ve been labeling a double top. Below 1220 it is still in firm lock down. But resistance also appears at 1235 (down turned SMA 200) and the SMA 50, which is also curling down. An oversold bounce is designed to get would-be bulls interested but my job is to read the technical situation and gold is bearish until it clears these moving averages. We anticipated a bounce in the precious metals and here it is, a B.O.U.N.C.E.

Silver made a mini-crash from which it has mostly recovered, if you can call a still-bearish daily chart “recovered”. Resistance begins at around 16 and then the down turned SMAs 50 & 200 (currently 16.71 and 17.30, respectively) come into play.

I understand the supply/demand fundamentals have improved markedly (ref. Keith Weiner’s calculated fundamental prices significantly higher than the current market). That implies a bounce, at least. But I am more interested in macro fundamentals and the technical charts. The macro funda continue to be not yet baked and the technicals are bearish.
There will come a day when the PM segment leads the others in reports and updates, because that will be where the action is. But that day is not today. HUI has bounced from a logical point, especially given the over bearish sentiment backdrop. But it has several resistance markers it would have to overcome before we can call the sector (as represented by HUI) bullish for a long-term trend. The resistance parameters are…
- The declining EMA 20 (
189.96, correction: 186.96) - The declining SMA 50 (190.92)
- The declining SMA 200 (197.17)
- The June high
- The April high
- And finally, the February high

There remain certain standout individual items with bullish technicals. We can still consider them to be positive divergences; i.e. quality looking ahead to a future bull phase. But as of now, as stated, while I may try individual situations on their own merits, I will only buy the sector – even for a swing trade – on a washout similar to December 2016 or on a combination of at least the first few resistance markers being taken out along with improving macro fundamentals.
A sneaky bullish side note here; gold (miners’ product) has been rising vs. oil (miners’ cost input) for all of 2017. We had speculated that the miners could see improvement in Q2 (April-June) reporting, which will be starting promptly. That is a sector fundamental, as opposed to a macro fundamental. In a perfect world we’d see a washout before such reporting would take place. But all we can do is take it week to week, evaluate and adjust if/as needed.

Bottom Line
- Stocks remain on bullish trends and short-term sentiment continues to provide little micro bursts of energy
- Commodities are bouncing, but some, like copper/industrial metals are getting bullish. Agri and REE have put on hysterical bounces that the sector is famous for (hedge fund rotation?) and uranium may get interesting, as noted in NFTRH 455.
- The gold/silver ratio continues to be a concern, not only for precious metals and commodities, but for broad stocks as well. Will it lead the US dollar upward, or will they both be tamed in the face of an inflationary trade? Right now the ‘inflation trade’ is only indicated to be bouncing. We’ll watch TIP/TLT, yield curve and nominal yields for clues.
- Precious metals are technically bearish across the board. Fundamentals are mixed.