As you know, we have the energy sector (XLE) as an ongoing situation from both long-term (monthly view, for investors) and short-term (daily, for traders). Crude Oil fund USO is sporting an interesting bottoming pattern here as well.
Daily RSI is above 50 and a break above the 50 day averages would target 10.50 to 11. No great shakes, but it would help out the XLE situation, obviously.
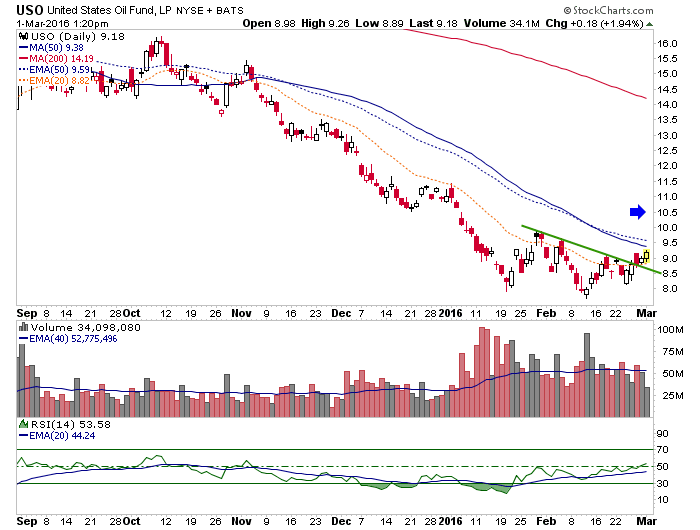
Crude Oil has been a big headliner to the bearish stock market as I suppose the spin is that consumers really wouldn’t want all that extra gas savings to… oh I don’t know, spend elsewhere? Headlines, always rationalizing something.
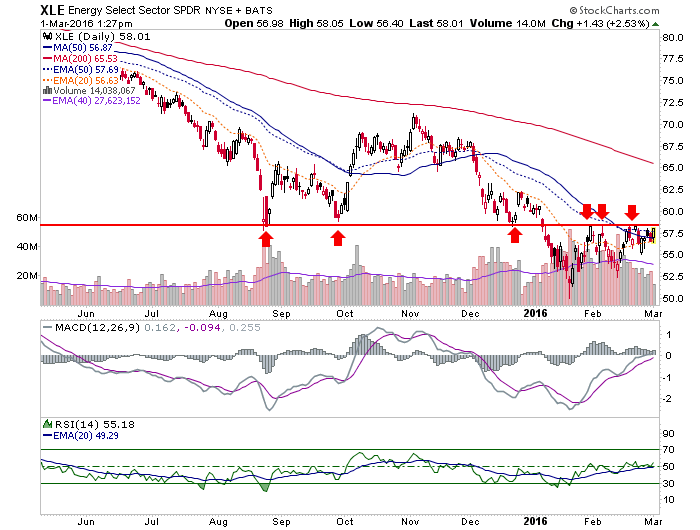
This chart shows why I would prefer to just stick with XLE as long as the stock market remains in bounce mode. XLE-USO is in an intermediate uptrend but has pulled back to a higher low at the 50 day averages. If the stock market holds up it should out perform USO.

No buys and sells on this one since it really is just an extension of the XLE updates. Here is an updated view of the daily XLE chart, still hanging in there at the MA 50’s but still below resistance.
A reminder that chart based NFTRH+ updates are technical trade setup ideas, which may not be revisited as the buy, sell, stop parameters are already noted. They are meant as a starting point for further research if interested. I will not personally buy every item highlighted and will sometimes sell – without prior notice (because this takes time and resource away from NFTRH’s main functions) – any item that I do buy, below target, which is something I often do as a trader. Also please be aware that I am not a fundamental stock analyst. Due diligence is your responsibility.