Below are some pictures of developing bear markets using weekly charts of iShares ETF’s. Some items are getting hit with the China stick, others with the Commodities stick and others with both. Regardless, they are getting hit with an ugly stick.
While I think this could be the start of global bear phase, we are focusing on items that are breaking down now, not showing signs of waning momentum.
I am using the iShares ETF’s for convenience, but you can apply the general parameters below to other funds you may use.
Also, this is just the start of a larger narrative going forward. I have created a chart list called global shorts and I request that you drop me a note (contact link above or gt<at>biiwii.com) me if you would like me to look at a certain country or fund, to be added if it looks like a bearish candidate. By keeping a list, we can review these items fairly regularly going forward to keep an eye on their progress.
Note that currency fluctuations come into play in some cases, whereby an unhedged ETF may be more bearish than the nominal market it represents. So we are just chart reading here, not macro market interpreting.
In bear markets, shorting comes into play (for players… cash is the #1 bear market option) so these views are for people who want to go that way, globally. The red arrows are the downside targets.
Generally, stop losses on the bear view can be placed to suit risk tolerance above broken support (now resistance) levels. As for positioning, I tend to try to wait for bounces back to broken support in order to short if the item in question has already dropped hard. Otherwise, cash is just fine by me.
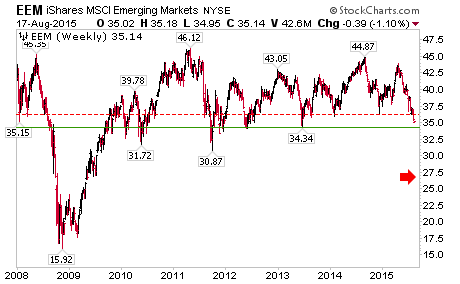
The general EM iShares EEM was noted in NFTRH 356. It has continued to be weak and is below the first support level. A loss of and hold below the next level (2012 and 2013 lows) would load the target.
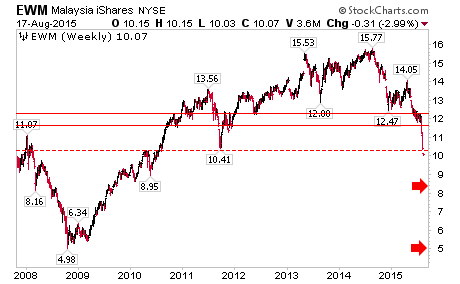
EWM is just a mess. A bounce back to around 12, if a strong bounce happens, would be a classic area to short with a handy ‘stop loss’ above 12.50. It has 2 potential downside targets, based on resistance around 12 and support being tested now at 10.40.
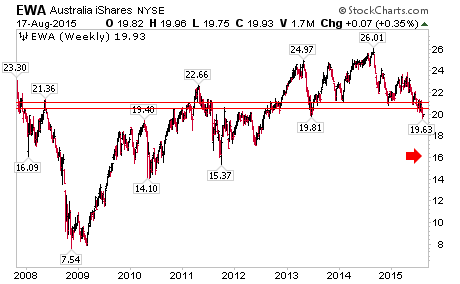
EWA is losing the neckline of a fairly well defined bearish pattern. Stop loss above 22.
EWS is losing support this week. A weekly close below 11.25 would increase the odds that resistance will be built here. Stop loss above 12.

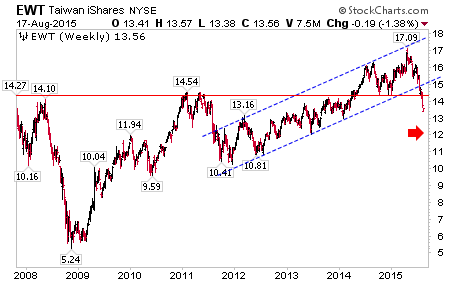
EWT would be a short on a bounce back to around 14.50. Stop loss above 15.50.
Please apply the NFTRH+ boilerplate to the above, as I am just illustrating the situation and will certainly not take all, if any, of the trades illustrated above…
A reminder that chart based NFTRH+ updates are just trade setup ideas, which may not be revisited as the parameters are already noted. They are meant as a starting point for further research if interested. Fundamentals-based ideas are also provided for your further research only. I will not personally buy every item highlighted and will sometimes sell – without prior notice (because this takes time and resource away from NFTRH’s main functions) – any item that I do buy, below target, which is something I often do as a trader. Also please be aware that I am not a fundamental stock analyst.